More Related Content Similar to Olah data (20) 1. Correlations
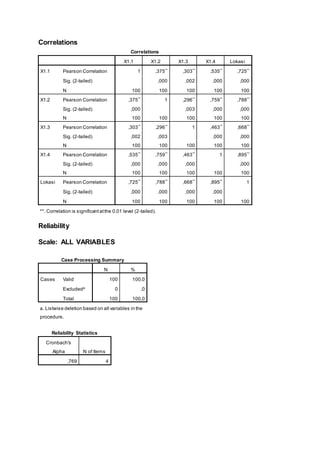
Correlations
X1.1 X1.2 X1.3 X1.4 Lokasi
X1.1 Pearson Correlation 1 ,375**
,303**
,535**
,725**
Sig. (2-tailed) ,000 ,002 ,000 ,000
N 100 100 100 100 100
X1.2 Pearson Correlation ,375**
1 ,296**
,759**
,788**
Sig. (2-tailed) ,000 ,003 ,000 ,000
N 100 100 100 100 100
X1.3 Pearson Correlation ,303**
,296**
1 ,463**
,668**
Sig. (2-tailed) ,002 ,003 ,000 ,000
N 100 100 100 100 100
X1.4 Pearson Correlation ,535**
,759**
,463**
1 ,895**
Sig. (2-tailed) ,000 ,000 ,000 ,000
N 100 100 100 100 100
Lokasi Pearson Correlation ,725**
,788**
,668**
,895**
1
Sig. (2-tailed) ,000 ,000 ,000 ,000
N 100 100 100 100 100
**. Correlation is significantatthe 0.01 level (2-tailed).
Reliability
Scale: ALL VARIABLES
Case Processing Summary
N %
Cases Valid 100 100,0
Excludeda
0 ,0
Total 100 100,0
a. Listwise deletion based on all variables in the
procedure.
Reliability Statistics
Cronbach's
Alpha N of Items
,769 4
2. Correlations
Correlations
X2.1 X2.2 X2.3 X2.4 Tangible
X2.1 Pearson Correlation 1 ,637**
,365**
,168 ,789**
Sig. (2-tailed) ,000 ,000 ,095 ,000
N 100 100 100 100 100
X2.2 Pearson Correlation ,637**
1 ,496**
,098 ,815**
Sig. (2-tailed) ,000 ,000 ,334 ,000
N 100 100 100 100 100
X2.3 Pearson Correlation ,365**
,496**
1 ,028 ,689**
Sig. (2-tailed) ,000 ,000 ,780 ,000
N 100 100 100 100 100
X2.4 Pearson Correlation ,168 ,098 ,028 1 ,460**
Sig. (2-tailed) ,095 ,334 ,780 ,000
N 100 100 100 100 100
Tangible Pearson Correlation ,789**
,815**
,689**
,460**
1
Sig. (2-tailed) ,000 ,000 ,000 ,000
N 100 100 100 100 100
**. Correlation is significantatthe 0.01 level (2-tailed).
Reliability
Scale: ALL VARIABLES
Case Processing Summary
N %
Cases Valid 100 100,0
Excludeda 0 ,0
Total 100 100,0
a. Listwise deletion based on all variables in the
procedure.
Reliability Statistics
Cronbach's
Alpha N of Items
,634 4
3. Correlations
Correlations
X3.1 X3.2 X3.3 Responsivenes
X3.1 Pearson Correlation 1 ,651**
,614**
,859**
Sig. (2-tailed) ,000 ,000 ,000
N 100 100 100 100
X3.2 Pearson Correlation ,651**
1 ,646**
,888**
Sig. (2-tailed) ,000 ,000 ,000
N 100 100 100 100
X3.3 Pearson Correlation ,614**
,646**
1 ,865**
Sig. (2-tailed) ,000 ,000 ,000
N 100 100 100 100
Responsivenes Pearson Correlation ,859**
,888**
,865**
1
Sig. (2-tailed) ,000 ,000 ,000
N 100 100 100 100
**. Correlation is significantatthe 0.01 level (2-tailed).
Reliability
Scale: ALL VARIABLES
Case Processing Summary
N %
Cases Valid 100 100,0
Excludeda 0 ,0
Total 100 100,0
a. Listwise deletion based on all variables in the
procedure.
Reliability Statistics
Cronbach's
Alpha N of Items
,839 3
4. Correlations
Correlations
X4.1 X4.2 X4.3 Reliability
X4.1 Pearson Correlation 1 ,722**
,337**
,835**
Sig. (2-tailed) ,000 ,001 ,000
N 100 100 100 100
X4.2 Pearson Correlation ,722**
1 ,506**
,902**
Sig. (2-tailed) ,000 ,000 ,000
N 100 100 100 100
X4.3 Pearson Correlation ,337**
,506**
1 ,738**
Sig. (2-tailed) ,001 ,000 ,000
N 100 100 100 100
Reliability Pearson Correlation ,835**
,902**
,738**
1
Sig. (2-tailed) ,000 ,000 ,000
N 100 100 100 100
**. Correlation is significantatthe 0.01 level (2-tailed).
Reliability
Scale: ALL VARIABLES
Case Processing Summary
N %
Cases Valid 100 100,0
Excludeda
0 ,0
Total 100 100,0
a. Listwise deletion based on all variables in the
procedure.
Reliability Statistics
Cronbach's
Alpha N of Items
,767 3
5. Correlations
Correlations
X5.1 X5.2 X5.3 Assurance
X5.1 Pearson Correlation 1 ,217*
,336**
,645**
Sig. (2-tailed) ,030 ,001 ,000
N 100 100 100 100
X5.2 Pearson Correlation ,217*
1 ,554**
,786**
Sig. (2-tailed) ,030 ,000 ,000
N 100 100 100 100
X5.3 Pearson Correlation ,336**
,554**
1 ,849**
Sig. (2-tailed) ,001 ,000 ,000
N 100 100 100 100
Assurance Pearson Correlation ,645**
,786**
,849**
1
Sig. (2-tailed) ,000 ,000 ,000
N 100 100 100 100
*. Correlation is significantatthe 0.05 level (2-tailed).
**. Correlation is significantatthe 0.01 level (2-tailed).
Reliability
Scale: ALL VARIABLES
Case Processing Summary
N %
Cases Valid 100 100,0
Excludeda
0 ,0
Total 100 100,0
a. Listwise deletion based on all variables in the
procedure.
Reliability Statistics
Cronbach's
Alpha N of Items
,644 3
6. Correlations
Correlations
X6.1 X6.2 X6.3 Emphaty
X6.1 Pearson Correlation 1 ,584**
,357**
,780**
Sig. (2-tailed) ,000 ,000 ,000
N 100 100 100 100
X6.2 Pearson Correlation ,584**
1 ,635**
,893**
Sig. (2-tailed) ,000 ,000 ,000
N 100 100 100 100
X6.3 Pearson Correlation ,357**
,635**
1 ,807**
Sig. (2-tailed) ,000 ,000 ,000
N 100 100 100 100
Emphaty Pearson Correlation ,780**
,893**
,807**
1
Sig. (2-tailed) ,000 ,000 ,000
N 100 100 100 100
**. Correlation is significantatthe 0.01 level (2-tailed).
Reliability
Scale: ALL VARIABLES
Case Processing Summary
N %
Cases Valid 100 100,0
Excludeda 0 ,0
Total 100 100,0
a. Listwise deletion based on all variables in the
procedure.
Reliability Statistics
Cronbach's
Alpha N of Items
,768 3
7. Correlations
Correlations
Y.1 Y.2 Y.3 Y.4 Y.5 Y.6 Kepuasan_Konsumen
Y.1 Pearson Correlation 1 ,584**
,357**
-,061 1,000**
,562**
,805**
Sig. (2-tailed) ,000 ,000 ,547 ,000 ,000 ,000
N 100 100 100 100 100 100 100
Y.2 Pearson Correlation ,584**
1 ,635**
,001 ,584**
,980**
,886**
Sig. (2-tailed) ,000 ,000 ,991 ,000 ,000 ,000
N 100 100 100 100 100 100 100
Y.3 Pearson Correlation ,357**
,635**
1 -,016 ,357**
,618**
,694**
Sig. (2-tailed) ,000 ,000 ,872 ,000 ,000 ,000
N 100 100 100 100 100 100 100
Y.4 Pearson Correlation -,061 ,001 -,016 1 -,061 ,021 ,206*
Sig. (2-tailed) ,547 ,991 ,872 ,547 ,837 ,040
N 100 100 100 100 100 100 100
Y.5 Pearson Correlation 1,000**
,584**
,357**
-,061 1 ,562**
,805**
Sig. (2-tailed) ,000 ,000 ,000 ,547 ,000 ,000
N 100 100 100 100 100 100 100
Y.6 Pearson Correlation ,562**
,980**
,618**
,021 ,562**
1 ,876**
Sig. (2-tailed) ,000 ,000 ,000 ,837 ,000 ,000
N 100 100 100 100 100 100 100
Kepu
asan
_Kon
sume
Pearson Correlation ,805**
,886**
,694**
,206*
,805**
,876**
1
Sig. (2-tailed) ,000 ,000 ,000 ,040 ,000 ,000
N
100 100 100 100 100 100 100
**. Correlation is significant at the 0.01 level (2-tailed).
*. Correlation is significant at the 0.05 level (2-tailed).
Reliability
Scale: ALL VARIABLES
Case Processing Summary
N %
Cases Valid 100 100,0
Excludeda
0 ,0
Total 100 100,0
a. Listwise deletion based on all variables in the
procedure.
8. Reliability Statistics
Cronbach's
Alpha N of Items
,805 6
Regression
Descriptive Statistics
Mean Std. Deviation N
Kepuasan_Konsumen 21,0800 2,15407 100
Lokasi 13,9200 1,61858 100
Tangible 13,8900 1,43474 100
Responsivenes 9,4900 1,42485 100
Reliability 10,4400 1,27382 100
Assurance 9,6100 1,03372 100
Emphaty 10,5900 1,25606 100
Correlations
Kepuasan_Konsumen Lokasi Tangible Responsivenes Reliability Assurance Emphaty
Pearson Correlation Kepuasan_Konsumen 1,000 ,570 ,503 ,122 ,661 ,046 ,961
Lokasi ,570 1,000 ,370 ,035 ,546 -,019 ,580
Tangible ,503 ,370 1,000 ,175 ,519 ,134 ,524
Responsivenes ,122 ,035 ,175 1,000 -,053 ,611 ,136
Reliability ,661 ,546 ,519 -,053 1,000 -,106 ,701
Assurance ,046 -,019 ,134 ,611 -,106 1,000 ,023
Emphaty ,961 ,580 ,524 ,136 ,701 ,023 1,000
Sig. (1-tailed) Kepuasan_Konsumen . ,000 ,000 ,113 ,000 ,325 ,000
Lokasi ,000 . ,000 ,366 ,000 ,426 ,000
Tangible ,000 ,000 . ,041 ,000 ,092 ,000
Responsivenes ,113 ,366 ,041 . ,300 ,000 ,089
Reliability ,000 ,000 ,000 ,300 . ,147 ,000
Assurance ,325 ,426 ,092 ,000 ,147 . ,409
Emphaty ,000 ,000 ,000 ,089 ,000 ,409 .
N Kepuasan_Konsumen 100 100 100 100 100 100 100
Lokasi 100 100 100 100 100 100 100
Tangible 100 100 100 100 100 100 100
Responsivenes 100 100 100 100 100 100 100
Reliability 100 100 100 100 100 100 100
Assurance 100 100 100 100 100 100 100
Emphaty 100 100 100 100 100 100 100
9. Variables Entered/Removeda
Model
Variables
Entered
Variables
Removed Method
1 Emphaty,
Assurance,
Tangible,
Lokasi,
Responsivenes,
Reliabilityb
. Enter
a. DependentVariable:Kepuasan_Konsume
b. All requested variables entered.
Model Summaryb
Model R R Square
Adjusted R
Square
Std. Error of the
Estimate
1 ,962a
,925 ,920 ,60980
a. Predictors: (Constant),Emphaty, Assurance,Tangible,Lokasi,
Responsivenes,Reliability
b. DependentVariable:Kepuasan_Konsume
ANOVAa
Model Sum of Squares df Mean Square F Sig.
1 Regression 424,777 6 70,796 190,387 ,000b
Residual 34,583 93 ,372
Total 459,360 99
a. DependentVariable:Kepuasan_Konsume
b. Predictors:(Constant),Emphaty, Assurance,Tangible,Lokasi,Responsivenes,Reliability
Coefficientsa
Model
Unstandardized Coefficients
Standardized
Coefficients
t Sig.B Std. Error Beta
1 (Constant) 3,180 ,880 3,613 ,000
Lokasi ,034 ,048 ,025 ,706 ,482
Tangible ,004 ,053 ,002 ,070 ,945
Responsivenes -,061 ,056 -,040 -1,098 ,275
Reliability -,057 ,074 -,034 -,769 ,444
Assurance ,093 ,076 ,044 1,224 ,224
Emphaty 1,668 ,076 ,973 21,943 ,000
a. DependentVariable:Kepuasan_Konsume
10. Coefficientsa
Model
Unstandardized
Coefficients Standardized Coefficients
t Sig.
Collinearity Statistics
B Std. Error Beta Tolerance VIF
1 (Constant) 3,180 ,880 3,613 ,000
Lokasi ,034 ,048 ,025 ,706 ,482 ,624 1,602
Tangible ,004 ,053 ,002 ,070 ,945 ,649 1,542
Responsivenes -,061 ,056 -,040 -1,098 ,275 ,596 1,678
Reliability -,057 ,074 -,034 -,769 ,444 ,423 2,362
Assurance ,093 ,076 ,044 1,224 ,224 ,614 1,629
Emphaty 1,668 ,076 ,973 21,943 ,000 ,412 2,427
a. DependentVariable:Kepuasan_Konsume
Collinearity Diagnosticsa
Model Dimension Eigenvalue Condition Index
Variance Proportions
(Constant) Lokasi Tangible Responsivenes Reliability Assurance
1
1 6,943 1,000 ,00 ,00 ,00 ,00 ,00 ,00
2 ,029 15,510 ,00 ,02 ,00 ,19 ,04 ,05
3 ,008 29,219 ,13 ,00 ,03 ,56 ,01 ,20
4 ,007 30,815 ,00 ,69 ,29 ,00 ,05 ,00
5 ,005 36,938 ,01 ,19 ,62 ,04 ,22 ,17
6 ,004 41,862 ,11 ,00 ,02 ,19 ,47 ,18
7 ,003 45,156 ,75 ,09 ,04 ,02 ,21 ,40
a. Dependent Variable: Kepuasan_Konsume
11. Residuals Statisticsa
Minimum Maximum Mean Std. Deviation N
Predicted Value 16,6980 23,6558 21,0800 2,07140 100
Std. Predicted Value -2,115 1,244 ,000 1,000 100
Standard Error of Predicted
Value
,077 ,291 ,155 ,044 100
Adjusted Predicted Value 16,6571 23,7758 21,0821 2,07721 100
Residual -1,39085 1,26131 ,00000 ,59103 100
Std. Residual -2,281 2,068 ,000 ,969 100
Stud. Residual -2,320 2,097 -,002 1,002 100
Deleted Residual -1,43956 1,29689 -,00211 ,63269 100
Stud. Deleted Residual -2,378 2,137 -,002 1,009 100
Mahal. Distance ,570 21,507 5,940 4,079 100
Cook's Distance ,000 ,059 ,010 ,011 100
Centered Leverage Value ,006 ,217 ,060 ,041 100
a. Dependent Variable:Kepuasan_Konsume
Charts