Chapter 3 cross sectional
•Download as DOC, PDF•
0 likes•605 views

cross section analisis of cs
![Syntax
CROSSTABS
/TABLES=GENDER AGE
MONTHLY_INCOME
EDUCATION OCCUPATION
SERVICCEPROVIDER
TYPE_OF_SERVICE
NO.OF_YEARS_OF_EXISST
ING_CUSTOMER BY
VAR00046
/FORMAT=AVALUE
TABLES
/STATISTICS=CHISQ
CORR
/CELLS=COUNT
/COUNT ROUND CELL.
Resources
Processor Time 00:00:00.02
Elapsed Time 00:00:00.02
Dimensions
Requested
2
Cells Available 174734
[DataSet2] C:UsersRAMANADesktopDATA SAKRU -BSNL.sav
Case Processing Summary
Cases
Valid Missing Total
N Percen
t
N Percen
t
N Percen
t
GENDER *
VAR00046
300 100.0
%
0 0.0% 300 100.0
%
AGE * VAR00046
300 100.0
%
0 0.0% 300 100.0
%
INCOME *
VAR00046
300 100.0
%
0 0.0% 300 100.0
%
EDUCATION *
VAR00046
300 100.0
%
0 0.0% 300 100.0
%](data:image/gif;base64,R0lGODlhAQABAIAAAAAAAP///yH5BAEAAAAALAAAAAABAAEAAAIBRAA7)
Recommended
More Related Content
What's hot
Viewers also liked
Viewers also liked (11)
Similar to Chapter 3 cross sectional
Similar to Chapter 3 cross sectional (20)
More from V.V.RAMANA MURTHY
More from V.V.RAMANA MURTHY (6)
Recently uploaded
Recently uploaded (20)
Chapter 3 cross sectional
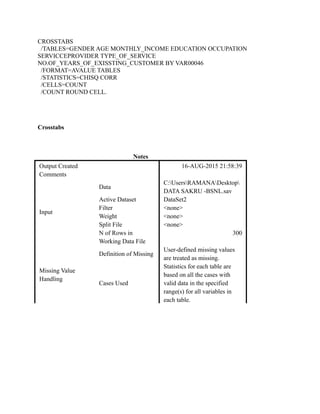
- 1. CROSSTABS /TABLES=GENDER AGE MONTHLY_INCOME EDUCATION OCCUPATION SERVICCEPROVIDER TYPE_OF_SERVICE NO.OF_YEARS_OF_EXISSTING_CUSTOMER BY VAR00046 /FORMAT=AVALUE TABLES /STATISTICS=CHISQ CORR /CELLS=COUNT /COUNT ROUND CELL. Crosstabs Notes Output Created 16-AUG-2015 21:58:39 Comments Input Data C:UsersRAMANADesktop DATA SAKRU -BSNL.sav Active Dataset DataSet2 Filter <none> Weight <none> Split File <none> N of Rows in Working Data File 300 Missing Value Handling Definition of Missing User-defined missing values are treated as missing. Cases Used Statistics for each table are based on all the cases with valid data in the specified range(s) for all variables in each table.
- 2. Syntax CROSSTABS /TABLES=GENDER AGE MONTHLY_INCOME EDUCATION OCCUPATION SERVICCEPROVIDER TYPE_OF_SERVICE NO.OF_YEARS_OF_EXISST ING_CUSTOMER BY VAR00046 /FORMAT=AVALUE TABLES /STATISTICS=CHISQ CORR /CELLS=COUNT /COUNT ROUND CELL. Resources Processor Time 00:00:00.02 Elapsed Time 00:00:00.02 Dimensions Requested 2 Cells Available 174734 [DataSet2] C:UsersRAMANADesktopDATA SAKRU -BSNL.sav Case Processing Summary Cases Valid Missing Total N Percen t N Percen t N Percen t GENDER * VAR00046 300 100.0 % 0 0.0% 300 100.0 % AGE * VAR00046 300 100.0 % 0 0.0% 300 100.0 % INCOME * VAR00046 300 100.0 % 0 0.0% 300 100.0 % EDUCATION * VAR00046 300 100.0 % 0 0.0% 300 100.0 %
- 3. OCCUPATION * VAR00046 300 100.0 % 0 0.0% 300 100.0 % SERVICCEPROVID ER * VAR00046 300 100.0 % 0 0.0% 300 100.0 % TYPE_OF_SERVIC E * VAR00046 300 100.0 % 0 0.0% 300 100.0 % NO.OF_YEARS_OF _EXISSTING_CUST OMER * VAR00046 300 100.0 % 0 0.0% 300 100.0 % GENDER * VAR00046 Crosstab Count VAR00046 Total 1.00 2.00 3.00 4.00 GEND ER MAL E 44 82 8 56 190 FEM ALE 12 43 18 37 110 Total 56 125 26 93 300 Symmetric Measures Value Asymp. Std. Errora Approx. Tb Approx. Sig. Interval by Interval Pearson's R .141 .056 2.467 .014c Ordinal by Ordinal Spearman Correlation .153 .055 2.665 .008c N of Valid Cases 300 a. Not assuming the null hypothesis.
- 4. b. Using the asymptotic standard error assuming the null hypothesis. c. Based on normal approximation. AGE * VAR00046 Crosstab Count VAR00046 Total 1.00 2.00 3.00 4.00 AG E BELOW 20Yrs 3 14 5 25 47 21-30 Yrs 10 34 6 13 63 31-40 Yrs 11 37 4 18 70 41-50Yrs 21 33 11 37 102 51-60Yrs 11 6 0 0 17 61 AND ABOVE 0 1 0 0 1 Total 56 125 26 93 300 Chi-Square Tests Value df Asymp. Sig. (2- sided) Pearson Chi-Square 53.003 a 15 .000 Likelihood Ratio 52.824 15 .000 Linear-by-Linear Association 10.415 1 .001 N of Valid Cases 300 a. 7 cells (29.2%) have expected count less than 5. The minimum expected count is .09.
- 5. Symmetric Measures Value Asymp. Std. Errora Approx. Tb Approx. Sig. Interval by Interval Pearson's R -.187 .056 -3.279 .001c Ordinal by Ordinal Spearman Correlation -.177 .058 -3.111 .002c N of Valid Cases 300 a. Not assuming the null hypothesis. b. Using the asymptotic standard error assuming the null hypothesis. c. Based on normal approximation. INCOME * VAR00046 Crosstab Count VAR00046 Total 1.00 2.00 3.00 4.00 INCO ME 5001-10,000 0 19 0 10 29 10,001 - 20,000 5 32 7 21 65 20,001- 30,000 44 52 14 52 162 30,001- 40,000 7 22 5 10 44 Total 56 125 26 93 300 Chi-Square Tests Value df Asymp. Sig. (2- sided) Pearson Chi-Square 29.590 a 9 .001
- 6. Likelihood Ratio 37.614 9 .000 Linear-by-Linear Association 2.439 1 .118 N of Valid Cases 300 a. 2 cells (12.5%) have expected count less than 5. The minimum expected count is 2.51. Symmetric Measures Value Asymp. Std. Errora Approx. Tb Approx. Sig. Interval by Interval Pearson's R -.090 .051 -1.565 .119c Ordinal by Ordinal Spearman Correlation -.103 .051 -1.779 .076c N of Valid Cases 300 a. Not assuming the null hypothesis. b. Using the asymptotic standard error assuming the null hypothesis. c. Based on normal approximation. EDUCATION * VAR00046 Crosstab Count VAR00046 Total 1.00 2.00 3.00 4.00 EDUCAT ION ILLITERATE 7 8 1 8 24 BELOW SSC 0 5 4 4 13 INTERMEDI AE 3 18 1 21 43 GRADATE 41 83 10 34 168 POST GRADUATE 4 4 10 9 27 OTHERS 1 7 0 17 25
- 7. Total 56 125 26 93 300 Chi-Square Tests Value df Asymp. Sig. (2- sided) Pearson Chi-Square 82.064 a 15 .000 Likelihood Ratio 74.412 15 .000 Linear-by-Linear Association 1.620 1 .203 N of Valid Cases 300 a. 9 cells (37.5%) have expected count less than 5. The minimum expected count is 1.13. Symmetric Measures Value Asymp. Std. Errora Approx. Tb Approx. Sig. Interval by Interval Pearson's R .074 .061 1.274 .204c Ordinal by Ordinal Spearman Correlation .047 .062 .820 .413c N of Valid Cases 300 a. Not assuming the null hypothesis. b. Using the asymptotic standard error assuming the null hypothesis. c. Based on normal approximation. OCCUPATION * VAR00046 Crosstab Count VAR00046 Total
- 8. 1.00 2.00 3.00 4.00 OCCUPAT ION GOVT.EMPLOY EE 6 8 4 2 20 HOUSE WIFE 20 24 4 12 60 SELF EMPLOYUEE 18 53 6 56 133 PRIVATE EMPLOYEE 8 28 4 16 56 BUSINESS 4 12 8 7 31 Total 56 125 26 93 300 Chi-Square Tests Value df Asymp. Sig. (2- sided) Pearson Chi-Square 40.295 a 12 .000 Likelihood Ratio 36.051 12 .000 Linear-by-Linear Association 4.571 1 .033 N of Valid Cases 300 a. 4 cells (20.0%) have expected count less than 5. The minimum expected count is 1.73. Symmetric Measures Value Asymp. Std. Errora Approx. Tb Approx. Sig. Interval by Interval Pearson's R .124 .053 2.151 .032c Ordinal by Ordinal Spearman Correlation .139 .055 2.429 .016c N of Valid Cases 300 a. Not assuming the null hypothesis. b. Using the asymptotic standard error assuming the null hypothesis. c. Based on normal approximation.
- 9. SERVICCEPROVIDER * VAR00046 Crosstab Count VAR00046 Total 1.00 2.00 3.00 4.00 SERVICCEPROV IDER BS NL 56 125 26 93 300 Total 56 125 26 93 300 Chi-Square Tests Value Pearson Chi- Square .a N of Valid Cases 300 a. No statistics are computed because SERVICCEPROVIDER is a constant. Symmetric Measures Value Interval by Interval Pearson's R .a N of Valid Cases 300 a. No statistics are computed because SERVICCEPROVIDER is a constant. TYPE_OF_SERVICE * VAR00046
- 10. Crosstab Count VAR00046 Total 1.00 2.00 3.00 4.00 TYPE_OF_SER VICE PREPAID 12 19 4 17 52 POSTPAID 28 67 13 54 162 CORPORATE CONNECTION 16 39 9 22 86 Total 56 125 26 93 300 Chi-Square Tests Value df Asymp. Sig. (2- sided) Pearson Chi-Square 2.922a 6 .819 Likelihood Ratio 2.923 6 .818 Linear-by-Linear Association .267 1 .606 N of Valid Cases 300 a. 1 cells (8.3%) have expected count less than 5. The minimum expected count is 4.51. Symmetric Measures Value Asymp. Std. Errora Approx. Tb Approx. Sig. Interval by Interval Pearson's R -.030 .058 -.516 .606c Ordinal by Ordinal Spearman Correlation -.026 .058 -.445 .657c N of Valid Cases 300 a. Not assuming the null hypothesis. b. Using the asymptotic standard error assuming the null hypothesis. c. Based on normal approximation.
- 11. NO.OF_YEARS_OF_EXISSTING_CUSTOMER * VAR00046 Crosstab Count VAR00046 Total 1.00 2.00 3.00 4.00 NO.OF_YEARS_OF _EXISSTING_CUST OMER LESS THAN 1Yr 9 16 8 22 55 1-2 Yrs 11 15 0 13 39 2-5Yrs 5 10 5 9 29 5-10Yrs 9 16 0 9 34 MORETHAN 10Yrs 22 68 13 36 139 6.00 0 0 0 4 4 Total 56 125 26 93 300 Chi-Square Tests Value df Asymp. Sig. (2- sided) Pearson Chi-Square 31.190 a 15 .008 Likelihood Ratio 36.831 15 .001 Linear-by-Linear Association 1.115 1 .291 N of Valid Cases 300 a. 8 cells (33.3%) have expected count less than 5. The minimum expected count is .35. Symmetric Measures
- 12. Value Asymp. Std. Errora Approx. Tb Approx. Sig. Interval by Interval Pearson's R -.061 .059 -1.056 .292c Ordinal by Ordinal Spearman Correlation -.036 .059 -.623 .534c N of Valid Cases 300 a. Not assuming the null hypothesis. b. Using the asymptotic standard error assuming the null hypothesis. c. Based on normal approximation.