
Recommended
Recommended
More Related Content
Similar to OFFICE OF INSTRUCTION HLC Academy – Writing Across the Curri.docx
Similar to OFFICE OF INSTRUCTION HLC Academy – Writing Across the Curri.docx (20)
More from hopeaustin33688
More from hopeaustin33688 (20)
Recently uploaded
Recently uploaded (20)
OFFICE OF INSTRUCTION HLC Academy – Writing Across the Curri.docx
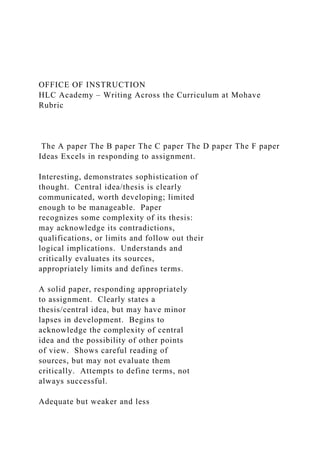
- 1. OFFICE OF INSTRUCTION HLC Academy – Writing Across the Curriculum at Mohave Rubric The A paper The B paper The C paper The D paper The F paper Ideas Excels in responding to assignment. Interesting, demonstrates sophistication of thought. Central idea/thesis is clearly communicated, worth developing; limited enough to be manageable. Paper recognizes some complexity of its thesis: may acknowledge its contradictions, qualifications, or limits and follow out their logical implications. Understands and critically evaluates its sources, appropriately limits and defines terms. A solid paper, responding appropriately to assignment. Clearly states a thesis/central idea, but may have minor lapses in development. Begins to acknowledge the complexity of central idea and the possibility of other points of view. Shows careful reading of sources, but may not evaluate them critically. Attempts to define terms, not always successful. Adequate but weaker and less
- 2. effective, possibly responding less well to assignment. Presents central idea in general terms, often depending on platitudes or clichés. Usually does not acknowledge other views. Shows basic comprehension of sources, perhaps with lapses in understanding. If it defines terms, often depends on dictionary definition. Does not have a clear central idea or does not respond appropriately to the assignment. Thesis may be too vague or obvious to be developed effectively. Paper may misunderstand sources. Does not respond to the assignment, lacks a thesis or central idea, and may neglect to use sources where necessary. Organization & coherence Uses a logical structure appropriate to paper’s subject, purpose, audience, thesis, and disciplinary field. Sophisticated transitional sentences often develop one idea from the previous one or identify their logical relations. It guides the reader through the chain of reasoning or progression of ideas. Shows a logical progression of ideas and
- 3. uses fairly sophisticated transitional devices; e.g., may move from least to more important idea. Some logical links may be faulty, but each paragraph clearly relates to paper’s central idea. May list ideas or arrange them randomly rather than using any evident logical structure. May use transitions, but they are likely to be sequential (first, second, third) rather than logic-based. While each paragraph may relate to central idea, logic is not always clear. Paragraphs have topic sentences but may be overly general, and arrangement of sentences within paragraphs may lack coherence. May have random organization, lacking internal paragraph coherence and using few or inappropriate transitions. Paragraphs may lack topic sentences or main ideas, or may be too general or too specific to be effective. Paragraphs may not all relate to paper’s thesis. No appreciable organization; lacks transitions and coherence. Support Uses evidence appropriately and effectively, providing sufficient evidence and explanation to convince.
- 4. Begins to offer reasons to support its points, perhaps using varied kinds of evidence. Begins to interpret the evidence and explain connections between evidence and main ideas. Its examples bear some relevance. Often uses generalizations to support its points. May use examples, but they may be obvious or not relevant. Often depends on unsupported opinion or personal experience, or assumes that evidence speaks for itself and needs no application to the point being discussed. Often has lapses in logic. Depends on clichés or overgeneralizations for support, or offers little evidence of any kind. May be personal narrative rather than essay, or summary rather than analysis. Uses irrelevant details or lacks supporting evidence entirely. May be unduly brief. Style Chooses words for their precise meaning and uses an appropriate level of specificity. Sentence style fits paper’s audience and purpose. Sentences are varied, yet clearly structured and carefully focused, not long and rambling. Generally uses words accurately and
- 5. effectively, but may sometimes be too general. Sentences generally clear, well structured, and focused, though some may be awkward or ineffective. Uses relatively vague and general words, may use some inappropriate language. Sentence structure generally correct, but sentences may be wordy, unfocused, repetitive, or confusing. May be too vague and abstract, or very personal and specific. Usually contains several awkward or ungrammatical sentences; sentence structure is simple or monotonous. Usually contains many awkward sentences, misuses words, employs inappropriate language. Mechanics Almost entirely free of spelling, punctuation, and grammatical errors. May contain a few errors, which may annoy the reader but not impede understanding. Usually contains several mechanical errors, which may temporarily confuse the reader but not impede the overall understanding. Usually contain either many mechanical errors or a few
- 6. important errors that block the reader’s understanding and ability to see connections between thoughts Usually contain so many mechanical errors that it is impossible for the reader to follow the thinking from sentence to sentence. Modeled after rubric used in the UC Davis English Department Composition Program BUS 222 – Spring 2014 - Essay Assignment (100 Points): I’m providing three separate topics to be addressed in our essay. Please provide at least 500 words on each of the three topics below. The total word length for the essay must be between 1,500 and 2,000 words, contain a cover page, a reference page, and should be written in basic APA format. Do not simply answer the questions below; construct your essay in the form of a quality, logically ordered, college level paper. Please review Essay Grading Rubric document in the ‘Course info & Documents’ folder.
- 7. Keep third party material to professional or academic sources. Make sure to properly cite any third party material. Any use of third party material without the proper citation will be considered plagiarism. Please review the plagiarism policy described in the course syllabus. Try to use examples and real world cases to illustrate your points. I will create a special folder in the Week 14 folder for you to submit your essay. The essay must be submitted to this folder. The essay will be due at the end of Week 14. (May 4 th 11:55 PM Arizona Time) Topic 1: (Address these points in your essay for Topic 1) We have seen the concepts of relevance and reliability mentioned throughout our course. Describe the importance of relevance and reliability in the accounting. How do the concepts of relevance and reliability apply to the role of the managerial
- 8. accountant? How does relevance and reliability apply to the information provided by the managerial accountant for an organization’s management? Topic 2: (Address these points in your essay for Topic 2) Explain the differences between managerial accounting and financial accounting. Explain the role that managerial accounts and financial accountants have in an organization. Explain the accounting data provided by each, why it is produced, the intended user of the data, and how the data is used. Explain how the role of the managerial accountant has changed over time and the reason for these changes. Topic 3: (Address these points in your essay for Topic 3) Accountants must have high professional ethics. Describe the ethical standards that management accountants subscribe to that, in your opinion, help maintain the impression
- 9. that accountants are highly ethical. How do these standards compare to the ethical standards in financial accounting. How are they different? Why are there differences? What organizations are responsible for the ethical standards for financial and managerial accounting? What are the differences between the organizations that maintain the ethical standards for each, and why are they different? How do ethical standards relate to how the accounting information is used by both internal and external parties? 1. Which of the following are correct statements of a NULL hypothesis? Choose all that are correct. On the line next to the question, indicate correct (C) or incorrect (I). (2 points) _____ Ho:
- 10. _____ Ho: _____ Ho: _____ Ho: 2. Suppose that in testing a hypothesis about a population mean, the observed value of the test statistic had a (two-tailed) p-value of .03. Indicate whether each of the following statements is correct (C) or incorrect (I). (2 points) _____ The null hypothesis can be rejected at the .05 level. _____ The null hypothesis cannot be rejected at the .10 level. _____ The probability of a Type I error is .03. _____ There is a 3% chance that the researcher’s conclusion will be wrong. 3. Suppose a 90% confidence interval for the mean is (26, 32). Indicate whether each of the following statements is correct (C) or incorrect (I). (2 points) _____ There is a 90% chance that the population mean is between 26 and 32. _____ 90% of the time, the population mean will be in this interval. _____ 90% of intervals constructed in this way contain the population mean.
- 11. _____ We are 90% confident that the sample mean is between 26 and 32. 4. Suppose that in testing the hypothesis Ho: against the alternative H1: , the null hypothesis isrejected at the .05 level. Indicate whether each of the following statements is correct (C) or incorrect (I). (2 points) _____ There is only a 5% chance that the null hypothesis is true. _____ The 95% confidence interval for the mean contains the value of 50. _____ If the population mean was 50, there is only a 5% chance that we would obtain the observed sample mean or anything more extreme. _____ We are 95% confident that the population mean is not 50. 5. A company specializing in prep courses for college admissions tests (Company A) claims that its clients increase their admissions scores by an average of 50 points as a result of the program. A competing company (Company B) disputes this claim and asks for proof. Company A takes a random sample of 60 clients, and pre- and post-tests them. The average increase in scores is 48.8 points, with a standard deviation of 9.8 points. (a) Write an appropriate null and alternate hypothesis for testing the claim of interest. (1 point) Ho:
- 12. H1: (b) The 95% confidence interval computed by Company A for the average score increase of its clients was (46.3, 51.3). Using this interval, determine whether Company A's claim is supported or not. Explain your conclusion clearly and fully. (1 point) (c) Give two ways of obtaining a narrower confidence interval. Be explicit. (1 point) 6. Company B (from Q5) also claims that the average score increase of its clients is greater than that of Company A. In support of its claim, it takes a random sample of 60 clients and records the score increase of each. The mean score increase in the sample is 51.6 (s.d. = 10.9). It compares its results to those of the sample of Company A’s clients, given above. (a) What statistical test is appropriate for Program B’s claim? Put a check next to the correct test. (1 point) _____ t-test for inference about a population mean _____ z-test for inference about a population proportion
- 13. _____ t-test for inference about the difference in population means using dependent samples _____ t-test for inference about the difference in population means using independent samples _____ z-test for inference about the difference in population proportions using independent samples (b) What effect would each of the following have on the outcome of the hypothesis test for testing Company B’s claim, other things held constant? Indicate whether it would increase the chance of rejection (I), decrease the chance of rejection (D), or would have no effect (NE).(2 points) _____ Using a larger sample size _____ Using a higher significance level in testing the hypothesis (e.g., .10 rather than .05) _____ Constructing a confidence interval rather doing a hypothesis test _____ Using more heterogeneous samples (i.e., samples with larger variances) (c) In testing Company B’s claim, the observed value of the test statistic was 1.48, with a p-value of 0.14. What does this p- value mean? Explain clearly and fully. (1 point) (d) Based on this p-value (not the test statistic), determine whether Company B's claim is supported at the .05 significance level. Explain your answer clearly. (1 point)
- 14. (e) Given your conclusion in (d), what type of error (Type I or Type II) could you have made? (1 point) 7. A watchdog group claims that only 30% of workers are willing to act as whistleblowers for fear of retaliation. The CEO of a large company wanted to know if that was true in her company and hired a consultant to investigate. A survey of 250 workers in non-managerial positions was conducted. Workers were presented with a scenario of impropriety, fraud, or mismanagement by their immediate superior and asked if they would report the incident at a higher level. 92 out of the 250 workers said they would report the incident. (a) Write the appropriate null and alternate hypotheses for testing the claim, assuming a two-tailed test. (1 point) Ho: H1: (b) If the null hypothesis was tested at the .05 level and rejected, what is the probability that the decision to reject was wrong? Explain.(1 point) (c) The hypothesis in (a) was tested using the sample above,
- 15. and an observed test statistic of 2.35 was obtained. What is the lowest level of significance at which the null hypothesis could have been rejected (again assuming a two-tailed test)? Show clearly how you obtained your answer. (1 point) (d) What should the consultant report to the CEO? Write a statement that summarizes the findings from (c). (1 point) 8. The consultant suspected that males and females differ in their willingness to be whistleblowers. In the sample above, 46 of the 140 males and 46 of the 110 females indicated that they would blow the whistle. (a) Write the null and alternate hypotheses to be tested. (1 point) Ho: H1:
- 16. (b) The consultant obtained an observed value of the test statistic of 1.46. Draw a conclusion about the hypothesis based on this result. Explain your reasoning and state your conclusion clearly and fully. (2 points) 9. In each of the scenarios below, write the null and alternate hypotheses to be tested, assuming a two-tailed test; determine the appropriate statistical procedures for testing the hypothesis (choose from the list below); (iii) the critical value of the test statistic at the .05 level (show how you obtained that value); (i) what the researcher’s conclusion would be based on the value of the test statistic given (show clearly how you obtained your answer). Do not simply indicate Reject/Not Reject. (3 points for each question) A t-test for inference about a population mean B z-test for inference about a population proportion C t-test for inference about the difference in population means using dependent samples D t-test for inference about the difference in population means using independent samples E z-test for inference about the difference in population proportions using dependent samples F z-test for inference about the difference in population proportions using independent samples (a) To assess the effectiveness of a negative political advertisement against a particular candidate’s opponent, 212
- 17. prospective voters were asked whether they intended to vote for the candidate or his opponent. They were then shown the negative advertisement about the candidate’s opponent and asked again whether they would vote for the candidate. Of the 120 who originally supported the candidate, 21 changed their minds after viewing the advertisement and said they would vote for the opponent; of the 92 who originally supported the opponent, 11 changed their minds after viewing the advertisement and said they would vote for the candidate. The observed value of the test statistic for testing the hypothesis of interest was 1.77. Ho: H1: Procedure: Critical value: Conclusion: (b) A researcher interested in studying the personality attributes of last-born children gathered a sample of 20 individuals aged 20-25 who were the youngest in a family of 2- 4 children. Each individual completed a scale rating their perception of the degree of conflict amongst siblings they experienced as a child. For each individual in the sample, one of their parents also completed a scale rating their perception of the degree of sibling conflict. The mean perceived conflict score of the last-born individuals was 23.7, while the mean for the parents was 21.5. The means of parents and children were
- 18. compared to determine if they differed. The observed value of the test statistic was 1.87. Ho: H1: Procedure: Critical value: Conclusion: (c) A researcher studying the effect of background music on concentration skills performed an experiment on 40 college sophomores randomly divided into two groups of 20 each. Both groups were given a reading comprehension test. In one group, pop music at an audible level was played; for the other group, the room was quiet during the test. The mean reading comprehension score under the music conditions was 13.4, while the mean under the quiet condition was 15.9. The variances were not significantly different. An observed test statistic of 2.65 was obtained. Ho: H1: Procedure: Critical value:
- 19. Conclusion: (d) A researcher interested in the incidence of binge drinking on college campuses and whether there are differences between freshmen and juniors asked 210 freshmen and 180 juniors whether they had engaged in binge drinking in the last month. 43% of the freshmen and 35% of the juniors said they had engaged in binge drinking as defined in the survey. Using these data, a test statistic of 1.61 was obtained. Ho: H1: Procedure: Critical value: Conclusion:
- 20. 10. In a study of the effectiveness of an innovative after- school program for academically at-risk students, a group of 42 students was randomly assigned to one of two programs. Twenty-one students participated in a traditional remedial program, while the other 21 participated in the new after-school program. At the start of the program, all students were administered a scale measuring attitude toward learning. After three months in their programs, all students were re- administered the attitude towards learning scale, along with a standardized achievement test. The data were analyzed using SPSS; the results of the analysis are attached. Analyses are labeled (A), (B), and (C); the questions that follow refer to these labeled analyses. (A) Comparison of Achievement Scores: Group Statistics Type of Program N Mean Std. Deviation Std. Error Mean Ach Traditional Remedial 21 36.90 3.897 .851 New After-School 21 35.14 3.439 .751
- 21. Independent Samples Test Levene's Test for Equality of Variances t-test for Equality of Means F Sig. t df Sig. (2-tailed) Mean Difference Std. Error Difference 95% Confidence Interval of the Difference Lower Upper Ach Equal variances assumed .182 .672 (1) (2) .128 (3) 1.134
- 22. -.531 4.054 Equal variances not assumed 1.553 39.390 .128 1.762 1.134 -.532 4.056 (B) Comparison of pre- and post-test Attitude Scores: New After-School Program Paired Samples Statistics Mean N Std. Deviation Std. Error Mean Pair 1 Atttitude Toward Learning posttest 24.3810 21 2.45919 .53664 Atttitude Toward Learning pretest 23.2857 21 2.07709
- 23. .45326 Paired Samples Test Paired Differences t df Sig. (2-tailed) Mean Std. Deviation Std. Error Mean 95% Confidence Interval of the Difference Lower Upper Pair 1 Atttitude Toward Learning posttest - Atttitude Toward Learning pretest 1.095 2.119 (4) .131 2.060 2.368
- 24. (5) .028 (C) Comparison of pre- and post-test Attitude Scores: Traditional program Paired Samples Statistics Mean N Std. Deviation Std. Error Mean Pair 1 Atttitude Toward Learning posttest 24.0952 21 2.09535 .45724 Atttitude Toward Learning pretest 23.3810 21 2.37647 .51859 Paired Samples Test Paired Differences t df
- 25. Sig. (2-tailed) Mean Std. Deviation Std. Error Mean 95% Confidence Interval of the Difference Lower Upper Pair 1 Atttitude Toward Learning posttest - Atttitude Toward Learning pretest .714 2.194 .479 -.284 1.713 1.492 .151 (a) Fill in the three values missing in Analysis (A) and the two values missing in Analysis (B). These are indicated (1) through (5) in the tables. (3 points)
- 26. (b) State the null and alternate hypotheses being tested in Analysis (A). (1 point) Ho: H1: (c) What does the F statistic in Analysis (A) refer to and what does the “Sig.” value next to it tell you? What implications does this have for interpreting the table? (1 point) (d) What conclusion would you draw about the effectiveness of the new program based on the results of Analysis (A)? Explain clearly and fully, indicating which values you used to draw your conclusion and how you interpreted them. (1 point) (c) State the null and alternate hypotheses being tested in Analysis (B). (1 point) Ho: H1: (d) What conclusions would you draw based on the results of Analyses (B) and (C)? Indicate which values you used to draw
- 27. you conclusions and how you interpreted them. (2 points) 11. In a study to determine the impact of sleep deprivation on students’ academic performance, seniors in a suburban high school were surveyed and asked how many hours nightly they sleep on average. Students who reported they slept less than five hours a night were classified as sleep-deprived; students who reported sleeping seven hours or more were classified as normal sleepers. Of this group, 36 were classified as sleep- deprived and 51 as normal sleepers. The scores of these students on the statewide achievement test were recorded. The means of the two groups are given below. Normal sleepers: Mean = 23.2, SD = 4.5, N = 51 Sleep-deprived: Mean = 20.6, SD = 4.9, N = 36 (a) Test an appropriate hypothesis using a two-tailed procedure with a significance level of .05. Carry out ALL steps in the hypothesis testing procedure and clearly state your conclusions. (4 points) (b) Do your results indicate that sleep deprivation causes lower mean achievement? Explain your answer. (1 point) (c) Construct a 90% confidence interval for the mean difference in the achievement scores of the two groups (2 points). Interpret this interval (say what the numbers mean) and state what conclusions you would draw based on the interval. (1 point) 12. A college using a new method of teaching calculus wishes to evaluate the effectiveness of the method. A class of 24 first- year college students was randomly divided into two sections, one of which was taught using the new method and the other taught using the old method. Scores on the end-of-semester exam for the two groups of students are given below.
- 28. New 91 80 85 87 74 76 83 89 87 75 79 88 Old 86 78 80 83 72 75 82 76 84 72 74 87 (a) Write down the null and alternate hypotheses of interest. (1 point). (b) Enter the data into SPSS and carry out an appropriate hypothesis test. Report the table of means and standard deviations and the table of test results. (2 points) (c) What conclusion would you draw on the basis of the test of equality of variances? Be specific about how you used the
- 29. results in the output to draw you conclusion. (1 point) (d) Interpret the “sig.value” of the test-statistic for testing the hypothesis in (a), i.e., say exactly what this value means. (1 point) (e) What would you conclude about the relative effectiveness of the two methods? Indicate clearly what evidence you used to reach this conclusion. (1 point) (f) Repeat the analysis assuming that the students were matched on prior mathematics achievement. Report the table of results (2 points), interpret the sig. value (1 point), and state your conclusions clearly and completely (1 point) (g) Interpret the confidence interval provided in the paired samples test output. Be specific about what information the interval provides. (1 point) (h) Based on the results of the paired samples t-test, do the data support the claim that the new method yields a mean increase in achievement of 7 points? Explain your answer. (1 point) 12 0 pp -¹ 50 m = 50 m ¹ 12 0 mm