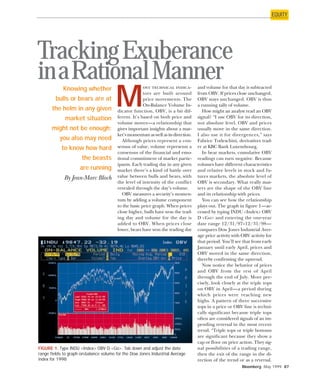
SlideShare a Scribd company logo
Bloomberg May 1999 87
EQUITY
M
ost technical indica-
tors are built around
price movements. The
On-Balance Volume In-
dicator function, OBV, is a bit dif-
ferent. It’s based on both price and
volume moves—a relationship that
gives important insights about a mar-
ket’s momentum as well as its direction.
Although prices represent a con-
sensus of value, volume represents a
consensus of the financial and emo-
tional commitment of market partic-
ipants. Each trading day in any given
market there’s a kind of battle over
value between bulls and bears, with
the level of intensity of the conflict
revealed through the day’s volume.
OBV measures a security’s momen-
tum by adding a volume component
to the basic price graph. When prices
close higher, bulls have won the trad-
ing day and volume for the day is
added to OBV. When prices close
lower, bears have won the trading day
and volume for that day is subtracted
from OBV. If prices close unchanged,
OBV stays unchanged. OBV is thus
a running tally of volume.
How might an analyst read an OBV
signal? “I use OBV for its direction,
not absolute level. OBV and prices
usually move in the same direction.
I also use it for divergences,” says
Fabrice Todeschini, derivatives trad-
er at KBC Bank Luxembourg.
In bear markets, cumulative OBV
readings can turn negative. Because
volumes have different characteristics
and relative levels in stock and fu-
tures markets, the absolute level of
OBV is secondary. What really mat-
ters are the shape of the OBV line
and its relationship with prices.
You can see how the relationship
plays out. The graph in figure 1—ac-
cessed by typing INDU <Index> OBV
D <Go> and entering the one-year
date range 12/31/97–12/31/98—
compares Dow Jones Industrial Aver-
age price activity with OBV activity for
that period. You’ll see that from early
January until early April, prices and
OBV moved in the same direction,
thereby confirming the uptrend.
Now notice the behavior of prices
and OBV from the rest of April
through the end of July. More pre-
cisely, look closely at the triple tops
on OBV in April—a period during
which prices were reaching new
highs. A pattern of three successive
tops in a price or OBV line is techni-
cally significant because triple tops
often are considered signals of an im-
pending reversal in the most recent
trend. “Triple tops or triple bottoms
are significant because they show a
cap or floor on price action. They sig-
nal possibilities of a trading range,
then the exit of the range in the di-
rection of the trend or as a reversal.
TrackingExuberance
inaRationalMannerKnowing whether
bulls or bears are at
the helm in any given
market situation
might not be enough;
you also may need
to know how hard
the beasts
are running
By Jean-Marc Bloch
FIGURE 1. Type INDU <Index> OBV D <Go>. Tab down and adjust the date
range fields to graph on-balance volume for the Dow Jones Industrial Average
index for 1998
88 May 1999 Bloomberg
In technical analysis, there have
never been four tops or bottoms in
prices. Volumes through OBV pat-
terns reflect these outcomes,” says
Michele Contarini, investment spe-
cialist and technical analyst at Ameri-
can Express Bank in Luxembourg.
That view was borne out, as shown
by the ensuing steep decline in the
OBV line.
During early May, in this example,
prices rallied strongly and the OBV
line resumed its upward move, but
OBV’s successive highs in early May
failed to break the previous highs
established in April. This was a very
strong market indication that prices
were fixed in a range.
The Dow actually reached new
record highs in May but on a much
lower level of OBV than those in
April. This was a yellow warning light.
And when a yellow light appears,
a red one usually isn’t far behind.
When the pattern of OBV diverges
from the pattern of prices, it indicates
that market financial commitments
are not in line with market
consensus on prices.
The best example on
this graph that a diver-
gence of OBV and price
signals a major market
turn can be seen later in
June and into July. The
Dow rallied then while OBV re-
mained roughly at the same level—
and at lower levels than in the April-
May period. This was both a second
strong deviation and a second warn-
ing signal from the market.
In studying this example and other
examples involving OBV, keep in
mind that the pattern of OBV tops
and bottoms is of primary impor-
tance and that absolute levels of OBV
are of secondary importance. When
OBV rises or falls together with
prices, a trend is confirmed and it’s
safer to trade in this direction. When
OBV reaches new highs, it confirms
the power of bulls and indicates that
prices might go even higher. When
OBV reaches new lows, it confirms
the power of bears, and it hints at
lower prices.
The strongest signal is given when
OBV and prices diverge. Obviously,
the longer the time frame, the
stronger the pattern and the larger
the magnitude of the ensuing move
might be.
In our example with the Dow, we
can define this type of divergence in
two sequences, each of which con-
tains two phases.
Sequence 1: April-May
• April triple tops on OBV.
• April-May shows divergence
between prices and OBV.
• Prices are ranging at about 9,000
levels—plus or minus 270 points.
• OBV fails to breaks new highs.
Sequence 2: June-July
• June prices rally on sideways
pattern of OBV; July’s decline is
confirmed by OBV’s direction.
• Prices are rising above 9,000
points, reaching new record high
above 9,300.
• OBV is lower than in April.
This decomposition exercise vali-
dates the probability of a reversal pat-
tern on the Dow. Another analysis
of that August divergence is worth
having a close look at in this regard
as well.
Figure 2—accessed by typing INDU
<Index> OBV <Go> and using date
range 07/01/98–12/31/98—shows
the bullish divergence in Septem-
ber/August through early October
followed by another spectacular re-
versal. The divergence came on Oc-
tober 8, when the index fell below its
September 10 low but OBV didn’t
follow, signaling that the low wasn’t
being made on heavy volume. You
can easily see symptoms of rational
exuberance’s getting its comeup-
pance in this pattern, and you can
draw the appropriate lessons for your
own trading. Knowing when money is
moving in and out of a market gives
you a better understanding of your
investing risk; it hints at when to take
profits; and it helps you spot poten-
tial losses before they occur.
¬Any comments? Type MAGAZINE
<Msge>.Forreprints,typeMAGZ <Go>.
Jean-Marc Bloch is on the staff of the
Bloomberg Sales department in LondonFIGURE 2. Type INDU <Index> OBV <Go>. Tab down and adjust the date range
to display OBV levels for the second half of 1998
¬To establish or reset any of the default
parameters for technical indicators on the
Bloomberg service, type TDEF <Go>.
Type TDEF <Help> for more
information on the function
Tip Box

More Related Content

What's hot

IS-LM Model 4
IS-LM Model 4IS-LM Model 4
IS-LM Model 4
Dr. SUBIR MAITRA
 
Macro Economics -II Chapter Two AGGREGATE SUPPLY
Macro Economics -II Chapter Two AGGREGATE SUPPLYMacro Economics -II Chapter Two AGGREGATE SUPPLY
Macro Economics -II Chapter Two AGGREGATE SUPPLY
Zegeye Paulos
 
Is lm
Is lmIs lm
11 1 introduction to economic fluctuations
11 1 introduction to economic fluctuations11 1 introduction to economic fluctuations
11 1 introduction to economic fluctuations
Baterdene Batchuluun
 
A Presentation on IS-LM Model
A Presentation on IS-LM ModelA Presentation on IS-LM Model
A Presentation on IS-LM Model
Dhananjay Ghei
 
Presentation On Supply
Presentation On SupplyPresentation On Supply
Presentation On Supply
Md.Tanim Hossain
 
Aggregate Demand and Aggregate Supply
Aggregate Demand and Aggregate SupplyAggregate Demand and Aggregate Supply
Aggregate Demand and Aggregate Supply
Lumen Learning
 
Applying IS-LM model in short run and long run
Applying IS-LM model in short run and long runApplying IS-LM model in short run and long run
Applying IS-LM model in short run and long run
Dr. Shweta Uppadhyay
 
MACROECONOMICS-CH11
MACROECONOMICS-CH11MACROECONOMICS-CH11
MACROECONOMICS-CH11
kkjjkevin03
 
8 2 phillips curve
8 2 phillips curve8 2 phillips curve
8 2 phillips curve
Baterdene Batchuluun
 
78648_Nnamdi_Udeh_SAMSUNG_STOCKS_1107290_299399760
78648_Nnamdi_Udeh_SAMSUNG_STOCKS_1107290_29939976078648_Nnamdi_Udeh_SAMSUNG_STOCKS_1107290_299399760
78648_Nnamdi_Udeh_SAMSUNG_STOCKS_1107290_299399760
udeh nnamdi
 
MACROECONOMICS-CH9
MACROECONOMICS-CH9MACROECONOMICS-CH9
MACROECONOMICS-CH9
kkjjkevin03
 
IS and LM model
IS and LM modelIS and LM model
IS and LM model
Dr. Shweta Uppadhyay
 
Competitive markets demand and supply
Competitive markets demand and supplyCompetitive markets demand and supply
Competitive markets demand and supply
Suresh Madhavan
 
IS LM analysis
IS LM analysis IS LM analysis
IS LM analysis
Sonam Sangwan
 

What's hot (15)

IS-LM Model 4
IS-LM Model 4IS-LM Model 4
IS-LM Model 4
 
Macro Economics -II Chapter Two AGGREGATE SUPPLY
Macro Economics -II Chapter Two AGGREGATE SUPPLYMacro Economics -II Chapter Two AGGREGATE SUPPLY
Macro Economics -II Chapter Two AGGREGATE SUPPLY
 
Is lm
Is lmIs lm
Is lm
 
11 1 introduction to economic fluctuations
11 1 introduction to economic fluctuations11 1 introduction to economic fluctuations
11 1 introduction to economic fluctuations
 
A Presentation on IS-LM Model
A Presentation on IS-LM ModelA Presentation on IS-LM Model
A Presentation on IS-LM Model
 
Presentation On Supply
Presentation On SupplyPresentation On Supply
Presentation On Supply
 
Aggregate Demand and Aggregate Supply
Aggregate Demand and Aggregate SupplyAggregate Demand and Aggregate Supply
Aggregate Demand and Aggregate Supply
 
Applying IS-LM model in short run and long run
Applying IS-LM model in short run and long runApplying IS-LM model in short run and long run
Applying IS-LM model in short run and long run
 
MACROECONOMICS-CH11
MACROECONOMICS-CH11MACROECONOMICS-CH11
MACROECONOMICS-CH11
 
8 2 phillips curve
8 2 phillips curve8 2 phillips curve
8 2 phillips curve
 
78648_Nnamdi_Udeh_SAMSUNG_STOCKS_1107290_299399760
78648_Nnamdi_Udeh_SAMSUNG_STOCKS_1107290_29939976078648_Nnamdi_Udeh_SAMSUNG_STOCKS_1107290_299399760
78648_Nnamdi_Udeh_SAMSUNG_STOCKS_1107290_299399760
 
MACROECONOMICS-CH9
MACROECONOMICS-CH9MACROECONOMICS-CH9
MACROECONOMICS-CH9
 
IS and LM model
IS and LM modelIS and LM model
IS and LM model
 
Competitive markets demand and supply
Competitive markets demand and supplyCompetitive markets demand and supply
Competitive markets demand and supply
 
IS LM analysis
IS LM analysis IS LM analysis
IS LM analysis
 

Viewers also liked

Antivirus
AntivirusAntivirus
Antivirus
AlfredoRios69
 
Naturaleza con el diseño prezi
Naturaleza con el diseño   preziNaturaleza con el diseño   prezi
Naturaleza con el diseño prezi
bpatron
 
Programación Feria del Banano
Programación Feria del BananoProgramación Feria del Banano
Programación Feria del Banano
Joel Romaña Pacheco
 
Slide5 bme adat_2015
Slide5 bme adat_2015Slide5 bme adat_2015
Slide5 bme adat_2015
János Divényi
 
Slides decathlon +plus progetto ergonomia cognitiva
Slides decathlon +plus progetto ergonomia cognitivaSlides decathlon +plus progetto ergonomia cognitiva
Slides decathlon +plus progetto ergonomia cognitiva
Riccardo Carlessi
 
Eating healthy for_kids
Eating healthy for_kidsEating healthy for_kids
Eating healthy for_kids
rohdelisa
 

Viewers also liked (6)

Antivirus
AntivirusAntivirus
Antivirus
 
Naturaleza con el diseño prezi
Naturaleza con el diseño   preziNaturaleza con el diseño   prezi
Naturaleza con el diseño prezi
 
Programación Feria del Banano
Programación Feria del BananoProgramación Feria del Banano
Programación Feria del Banano
 
Slide5 bme adat_2015
Slide5 bme adat_2015Slide5 bme adat_2015
Slide5 bme adat_2015
 
Slides decathlon +plus progetto ergonomia cognitiva
Slides decathlon +plus progetto ergonomia cognitivaSlides decathlon +plus progetto ergonomia cognitiva
Slides decathlon +plus progetto ergonomia cognitiva
 
Eating healthy for_kids
Eating healthy for_kidsEating healthy for_kids
Eating healthy for_kids
 

Similar to OBV

FI 498 J Bopp Tom Final Proj (1)
FI 498 J Bopp Tom Final Proj (1)FI 498 J Bopp Tom Final Proj (1)
FI 498 J Bopp Tom Final Proj (1)
Tom Bopp
 
Indicators tutorials
Indicators tutorialsIndicators tutorials
Indicators tutorials
sivakumar pichai
 
Technicalanalysis 111216235133-phpapp01
Technicalanalysis 111216235133-phpapp01Technicalanalysis 111216235133-phpapp01
Technicalanalysis 111216235133-phpapp01
Dharmin Desai
 
Technical Analysis
Technical AnalysisTechnical Analysis
Technical Analysis
Santosh Hanchanal
 
Technical analysis doc
Technical analysis doc Technical analysis doc
Technical analysis doc
Babasab Patil
 
AnalysisTechnical Analysis PPT @ MBABECDOMS
AnalysisTechnical Analysis PPT @ MBABECDOMSAnalysisTechnical Analysis PPT @ MBABECDOMS
AnalysisTechnical Analysis PPT @ MBABECDOMS
Babasab Patil
 
Technical analysis
Technical analysisTechnical analysis
Technical analysis
mbawbut
 
Technicalanalysisppt 120809084534-phpapp02
Technicalanalysisppt 120809084534-phpapp02Technicalanalysisppt 120809084534-phpapp02
Technicalanalysisppt 120809084534-phpapp02
Deeksha Rathee
 
011 Technical Analysis.ppt on financial accounting
011 Technical Analysis.ppt on financial accounting011 Technical Analysis.ppt on financial accounting
011 Technical Analysis.ppt on financial accounting
tadegebreyesus
 
Technical analysis
Technical analysisTechnical analysis
Technical analysis
Dr. Prabhakaran
 
Technical analysis
Technical analysisTechnical analysis
Technical analysis
Kanchan Agrawal
 
Technical
TechnicalTechnical
Technical
StudsPlanet.com
 
Technical
TechnicalTechnical
Technical
Nits Kedia
 
Technical analysis
Technical analysisTechnical analysis
Technical analysis
Rahul Mailcontractor
 
Taost 21 August 2015 Market Update
Taost 21 August 2015 Market UpdateTaost 21 August 2015 Market Update
Taost 21 August 2015 Market Update
The Art of Simple Trading
 
Investment management cws
Investment management cwsInvestment management cws
Investment management cws
2k20dmba087piyushkum
 
A fundamental study on Technical Analysis
A fundamental study on Technical AnalysisA fundamental study on Technical Analysis
A fundamental study on Technical Analysis
Jay Sadhwani
 
The composite man
The composite manThe composite man
The composite man
The Evans Group LLC
 
Technical analysis
Technical analysisTechnical analysis
Technical analysis
poojanair40
 
Technical analysis ppt
Technical analysis pptTechnical analysis ppt
Technical analysis ppt
rahul94
 

Similar to OBV (20)

FI 498 J Bopp Tom Final Proj (1)
FI 498 J Bopp Tom Final Proj (1)FI 498 J Bopp Tom Final Proj (1)
FI 498 J Bopp Tom Final Proj (1)
 
Indicators tutorials
Indicators tutorialsIndicators tutorials
Indicators tutorials
 
Technicalanalysis 111216235133-phpapp01
Technicalanalysis 111216235133-phpapp01Technicalanalysis 111216235133-phpapp01
Technicalanalysis 111216235133-phpapp01
 
Technical Analysis
Technical AnalysisTechnical Analysis
Technical Analysis
 
Technical analysis doc
Technical analysis doc Technical analysis doc
Technical analysis doc
 
AnalysisTechnical Analysis PPT @ MBABECDOMS
AnalysisTechnical Analysis PPT @ MBABECDOMSAnalysisTechnical Analysis PPT @ MBABECDOMS
AnalysisTechnical Analysis PPT @ MBABECDOMS
 
Technical analysis
Technical analysisTechnical analysis
Technical analysis
 
Technicalanalysisppt 120809084534-phpapp02
Technicalanalysisppt 120809084534-phpapp02Technicalanalysisppt 120809084534-phpapp02
Technicalanalysisppt 120809084534-phpapp02
 
011 Technical Analysis.ppt on financial accounting
011 Technical Analysis.ppt on financial accounting011 Technical Analysis.ppt on financial accounting
011 Technical Analysis.ppt on financial accounting
 
Technical analysis
Technical analysisTechnical analysis
Technical analysis
 
Technical analysis
Technical analysisTechnical analysis
Technical analysis
 
Technical
TechnicalTechnical
Technical
 
Technical
TechnicalTechnical
Technical
 
Technical analysis
Technical analysisTechnical analysis
Technical analysis
 
Taost 21 August 2015 Market Update
Taost 21 August 2015 Market UpdateTaost 21 August 2015 Market Update
Taost 21 August 2015 Market Update
 
Investment management cws
Investment management cwsInvestment management cws
Investment management cws
 
A fundamental study on Technical Analysis
A fundamental study on Technical AnalysisA fundamental study on Technical Analysis
A fundamental study on Technical Analysis
 
The composite man
The composite manThe composite man
The composite man
 
Technical analysis
Technical analysisTechnical analysis
Technical analysis
 
Technical analysis ppt
Technical analysis pptTechnical analysis ppt
Technical analysis ppt
 

More from Jean-Marc Bloch-Lambert

Presentation - Forexperf Corporation IB Eng - March
Presentation - Forexperf Corporation IB Eng - March Presentation - Forexperf Corporation IB Eng - March
Presentation - Forexperf Corporation IB Eng - March
Jean-Marc Bloch-Lambert
 
LyxorQuantum II 2011
LyxorQuantum II 2011LyxorQuantum II 2011
LyxorQuantum II 2011
Jean-Marc Bloch-Lambert
 
InvestmentCommitteeResearch_AlchemyCapital_March2008
InvestmentCommitteeResearch_AlchemyCapital_March2008InvestmentCommitteeResearch_AlchemyCapital_March2008
InvestmentCommitteeResearch_AlchemyCapital_March2008
Jean-Marc Bloch-Lambert
 
HFAArticleApril02
HFAArticleApril02HFAArticleApril02
HFAArticleApril02
Jean-Marc Bloch-Lambert
 
TrackUBS Equities Monthly BoomBust Sequence
TrackUBS Equities Monthly BoomBust SequenceTrackUBS Equities Monthly BoomBust Sequence
TrackUBS Equities Monthly BoomBust Sequence
Jean-Marc Bloch-Lambert
 
jmVaRUBS
jmVaRUBSjmVaRUBS
TechnicalTradingJMB
TechnicalTradingJMBTechnicalTradingJMB
TechnicalTradingJMB
Jean-Marc Bloch-Lambert
 
SILVER
SILVERSILVER
RSI
RSIRSI

More from Jean-Marc Bloch-Lambert (9)

Presentation - Forexperf Corporation IB Eng - March
Presentation - Forexperf Corporation IB Eng - March Presentation - Forexperf Corporation IB Eng - March
Presentation - Forexperf Corporation IB Eng - March
 
LyxorQuantum II 2011
LyxorQuantum II 2011LyxorQuantum II 2011
LyxorQuantum II 2011
 
InvestmentCommitteeResearch_AlchemyCapital_March2008
InvestmentCommitteeResearch_AlchemyCapital_March2008InvestmentCommitteeResearch_AlchemyCapital_March2008
InvestmentCommitteeResearch_AlchemyCapital_March2008
 
HFAArticleApril02
HFAArticleApril02HFAArticleApril02
HFAArticleApril02
 
TrackUBS Equities Monthly BoomBust Sequence
TrackUBS Equities Monthly BoomBust SequenceTrackUBS Equities Monthly BoomBust Sequence
TrackUBS Equities Monthly BoomBust Sequence
 
jmVaRUBS
jmVaRUBSjmVaRUBS
jmVaRUBS
 
TechnicalTradingJMB
TechnicalTradingJMBTechnicalTradingJMB
TechnicalTradingJMB
 
SILVER
SILVERSILVER
SILVER
 
RSI
RSIRSI
RSI
 

OBV

  • 1. Bloomberg May 1999 87 EQUITY M ost technical indica- tors are built around price movements. The On-Balance Volume In- dicator function, OBV, is a bit dif- ferent. It’s based on both price and volume moves—a relationship that gives important insights about a mar- ket’s momentum as well as its direction. Although prices represent a con- sensus of value, volume represents a consensus of the financial and emo- tional commitment of market partic- ipants. Each trading day in any given market there’s a kind of battle over value between bulls and bears, with the level of intensity of the conflict revealed through the day’s volume. OBV measures a security’s momen- tum by adding a volume component to the basic price graph. When prices close higher, bulls have won the trad- ing day and volume for the day is added to OBV. When prices close lower, bears have won the trading day and volume for that day is subtracted from OBV. If prices close unchanged, OBV stays unchanged. OBV is thus a running tally of volume. How might an analyst read an OBV signal? “I use OBV for its direction, not absolute level. OBV and prices usually move in the same direction. I also use it for divergences,” says Fabrice Todeschini, derivatives trad- er at KBC Bank Luxembourg. In bear markets, cumulative OBV readings can turn negative. Because volumes have different characteristics and relative levels in stock and fu- tures markets, the absolute level of OBV is secondary. What really mat- ters are the shape of the OBV line and its relationship with prices. You can see how the relationship plays out. The graph in figure 1—ac- cessed by typing INDU <Index> OBV D <Go> and entering the one-year date range 12/31/97–12/31/98— compares Dow Jones Industrial Aver- age price activity with OBV activity for that period. You’ll see that from early January until early April, prices and OBV moved in the same direction, thereby confirming the uptrend. Now notice the behavior of prices and OBV from the rest of April through the end of July. More pre- cisely, look closely at the triple tops on OBV in April—a period during which prices were reaching new highs. A pattern of three successive tops in a price or OBV line is techni- cally significant because triple tops often are considered signals of an im- pending reversal in the most recent trend. “Triple tops or triple bottoms are significant because they show a cap or floor on price action. They sig- nal possibilities of a trading range, then the exit of the range in the di- rection of the trend or as a reversal. TrackingExuberance inaRationalMannerKnowing whether bulls or bears are at the helm in any given market situation might not be enough; you also may need to know how hard the beasts are running By Jean-Marc Bloch FIGURE 1. Type INDU <Index> OBV D <Go>. Tab down and adjust the date range fields to graph on-balance volume for the Dow Jones Industrial Average index for 1998
  • 2. 88 May 1999 Bloomberg In technical analysis, there have never been four tops or bottoms in prices. Volumes through OBV pat- terns reflect these outcomes,” says Michele Contarini, investment spe- cialist and technical analyst at Ameri- can Express Bank in Luxembourg. That view was borne out, as shown by the ensuing steep decline in the OBV line. During early May, in this example, prices rallied strongly and the OBV line resumed its upward move, but OBV’s successive highs in early May failed to break the previous highs established in April. This was a very strong market indication that prices were fixed in a range. The Dow actually reached new record highs in May but on a much lower level of OBV than those in April. This was a yellow warning light. And when a yellow light appears, a red one usually isn’t far behind. When the pattern of OBV diverges from the pattern of prices, it indicates that market financial commitments are not in line with market consensus on prices. The best example on this graph that a diver- gence of OBV and price signals a major market turn can be seen later in June and into July. The Dow rallied then while OBV re- mained roughly at the same level— and at lower levels than in the April- May period. This was both a second strong deviation and a second warn- ing signal from the market. In studying this example and other examples involving OBV, keep in mind that the pattern of OBV tops and bottoms is of primary impor- tance and that absolute levels of OBV are of secondary importance. When OBV rises or falls together with prices, a trend is confirmed and it’s safer to trade in this direction. When OBV reaches new highs, it confirms the power of bulls and indicates that prices might go even higher. When OBV reaches new lows, it confirms the power of bears, and it hints at lower prices. The strongest signal is given when OBV and prices diverge. Obviously, the longer the time frame, the stronger the pattern and the larger the magnitude of the ensuing move might be. In our example with the Dow, we can define this type of divergence in two sequences, each of which con- tains two phases. Sequence 1: April-May • April triple tops on OBV. • April-May shows divergence between prices and OBV. • Prices are ranging at about 9,000 levels—plus or minus 270 points. • OBV fails to breaks new highs. Sequence 2: June-July • June prices rally on sideways pattern of OBV; July’s decline is confirmed by OBV’s direction. • Prices are rising above 9,000 points, reaching new record high above 9,300. • OBV is lower than in April. This decomposition exercise vali- dates the probability of a reversal pat- tern on the Dow. Another analysis of that August divergence is worth having a close look at in this regard as well. Figure 2—accessed by typing INDU <Index> OBV <Go> and using date range 07/01/98–12/31/98—shows the bullish divergence in Septem- ber/August through early October followed by another spectacular re- versal. The divergence came on Oc- tober 8, when the index fell below its September 10 low but OBV didn’t follow, signaling that the low wasn’t being made on heavy volume. You can easily see symptoms of rational exuberance’s getting its comeup- pance in this pattern, and you can draw the appropriate lessons for your own trading. Knowing when money is moving in and out of a market gives you a better understanding of your investing risk; it hints at when to take profits; and it helps you spot poten- tial losses before they occur. ¬Any comments? Type MAGAZINE <Msge>.Forreprints,typeMAGZ <Go>. Jean-Marc Bloch is on the staff of the Bloomberg Sales department in LondonFIGURE 2. Type INDU <Index> OBV <Go>. Tab down and adjust the date range to display OBV levels for the second half of 1998 ¬To establish or reset any of the default parameters for technical indicators on the Bloomberg service, type TDEF <Go>. Type TDEF <Help> for more information on the function Tip Box