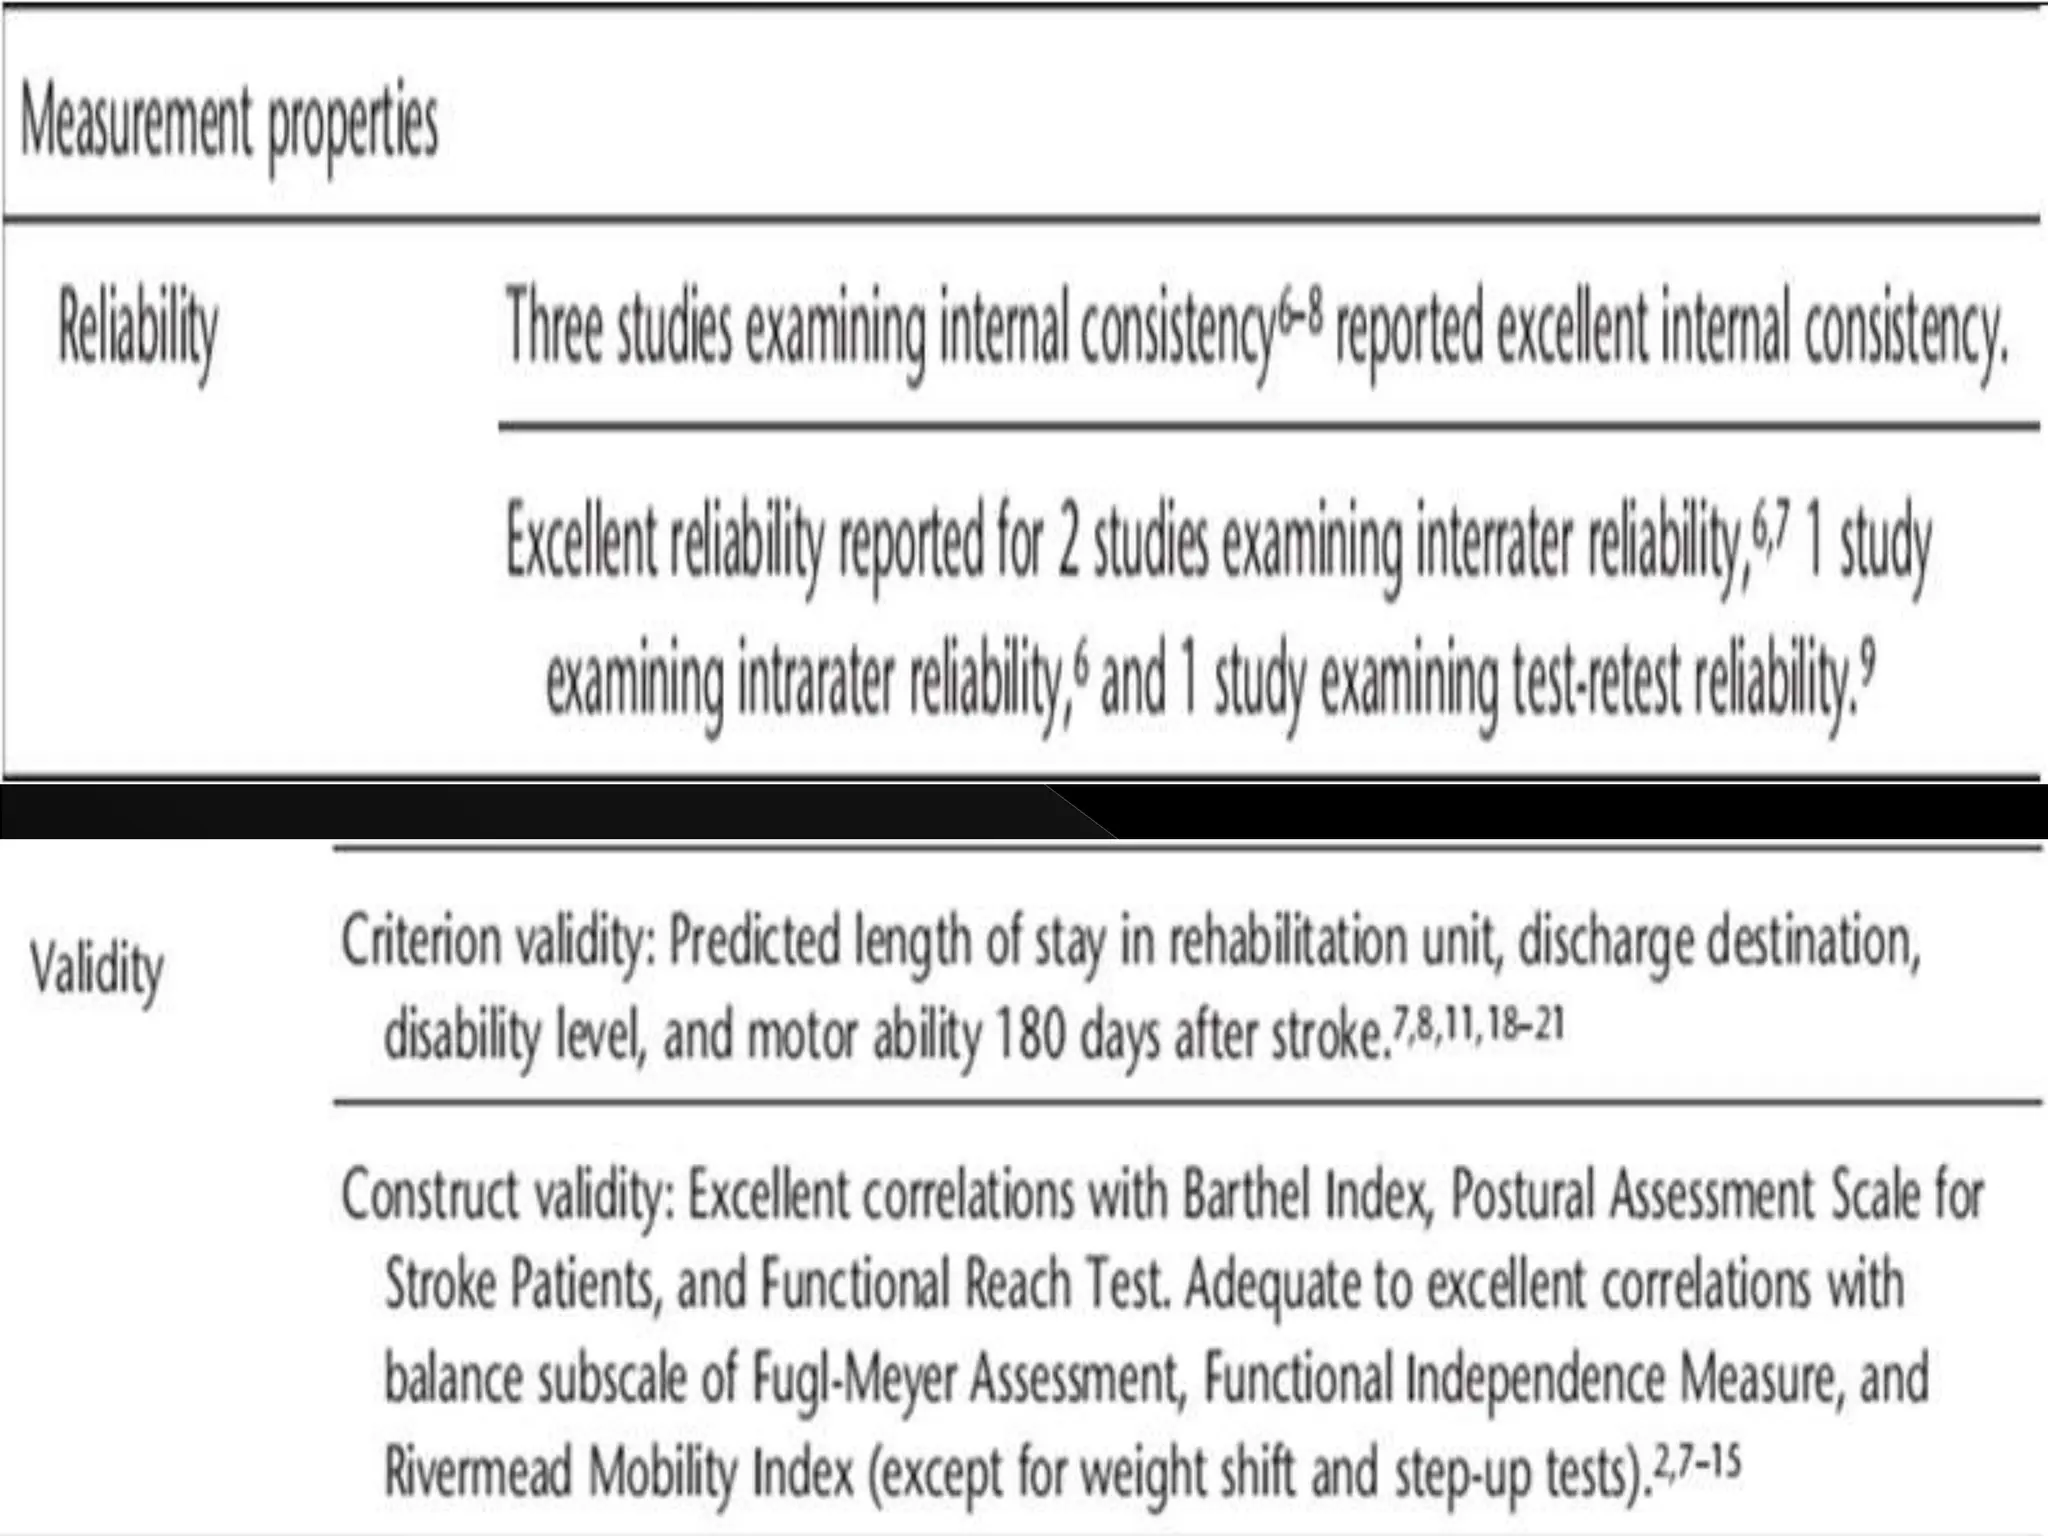
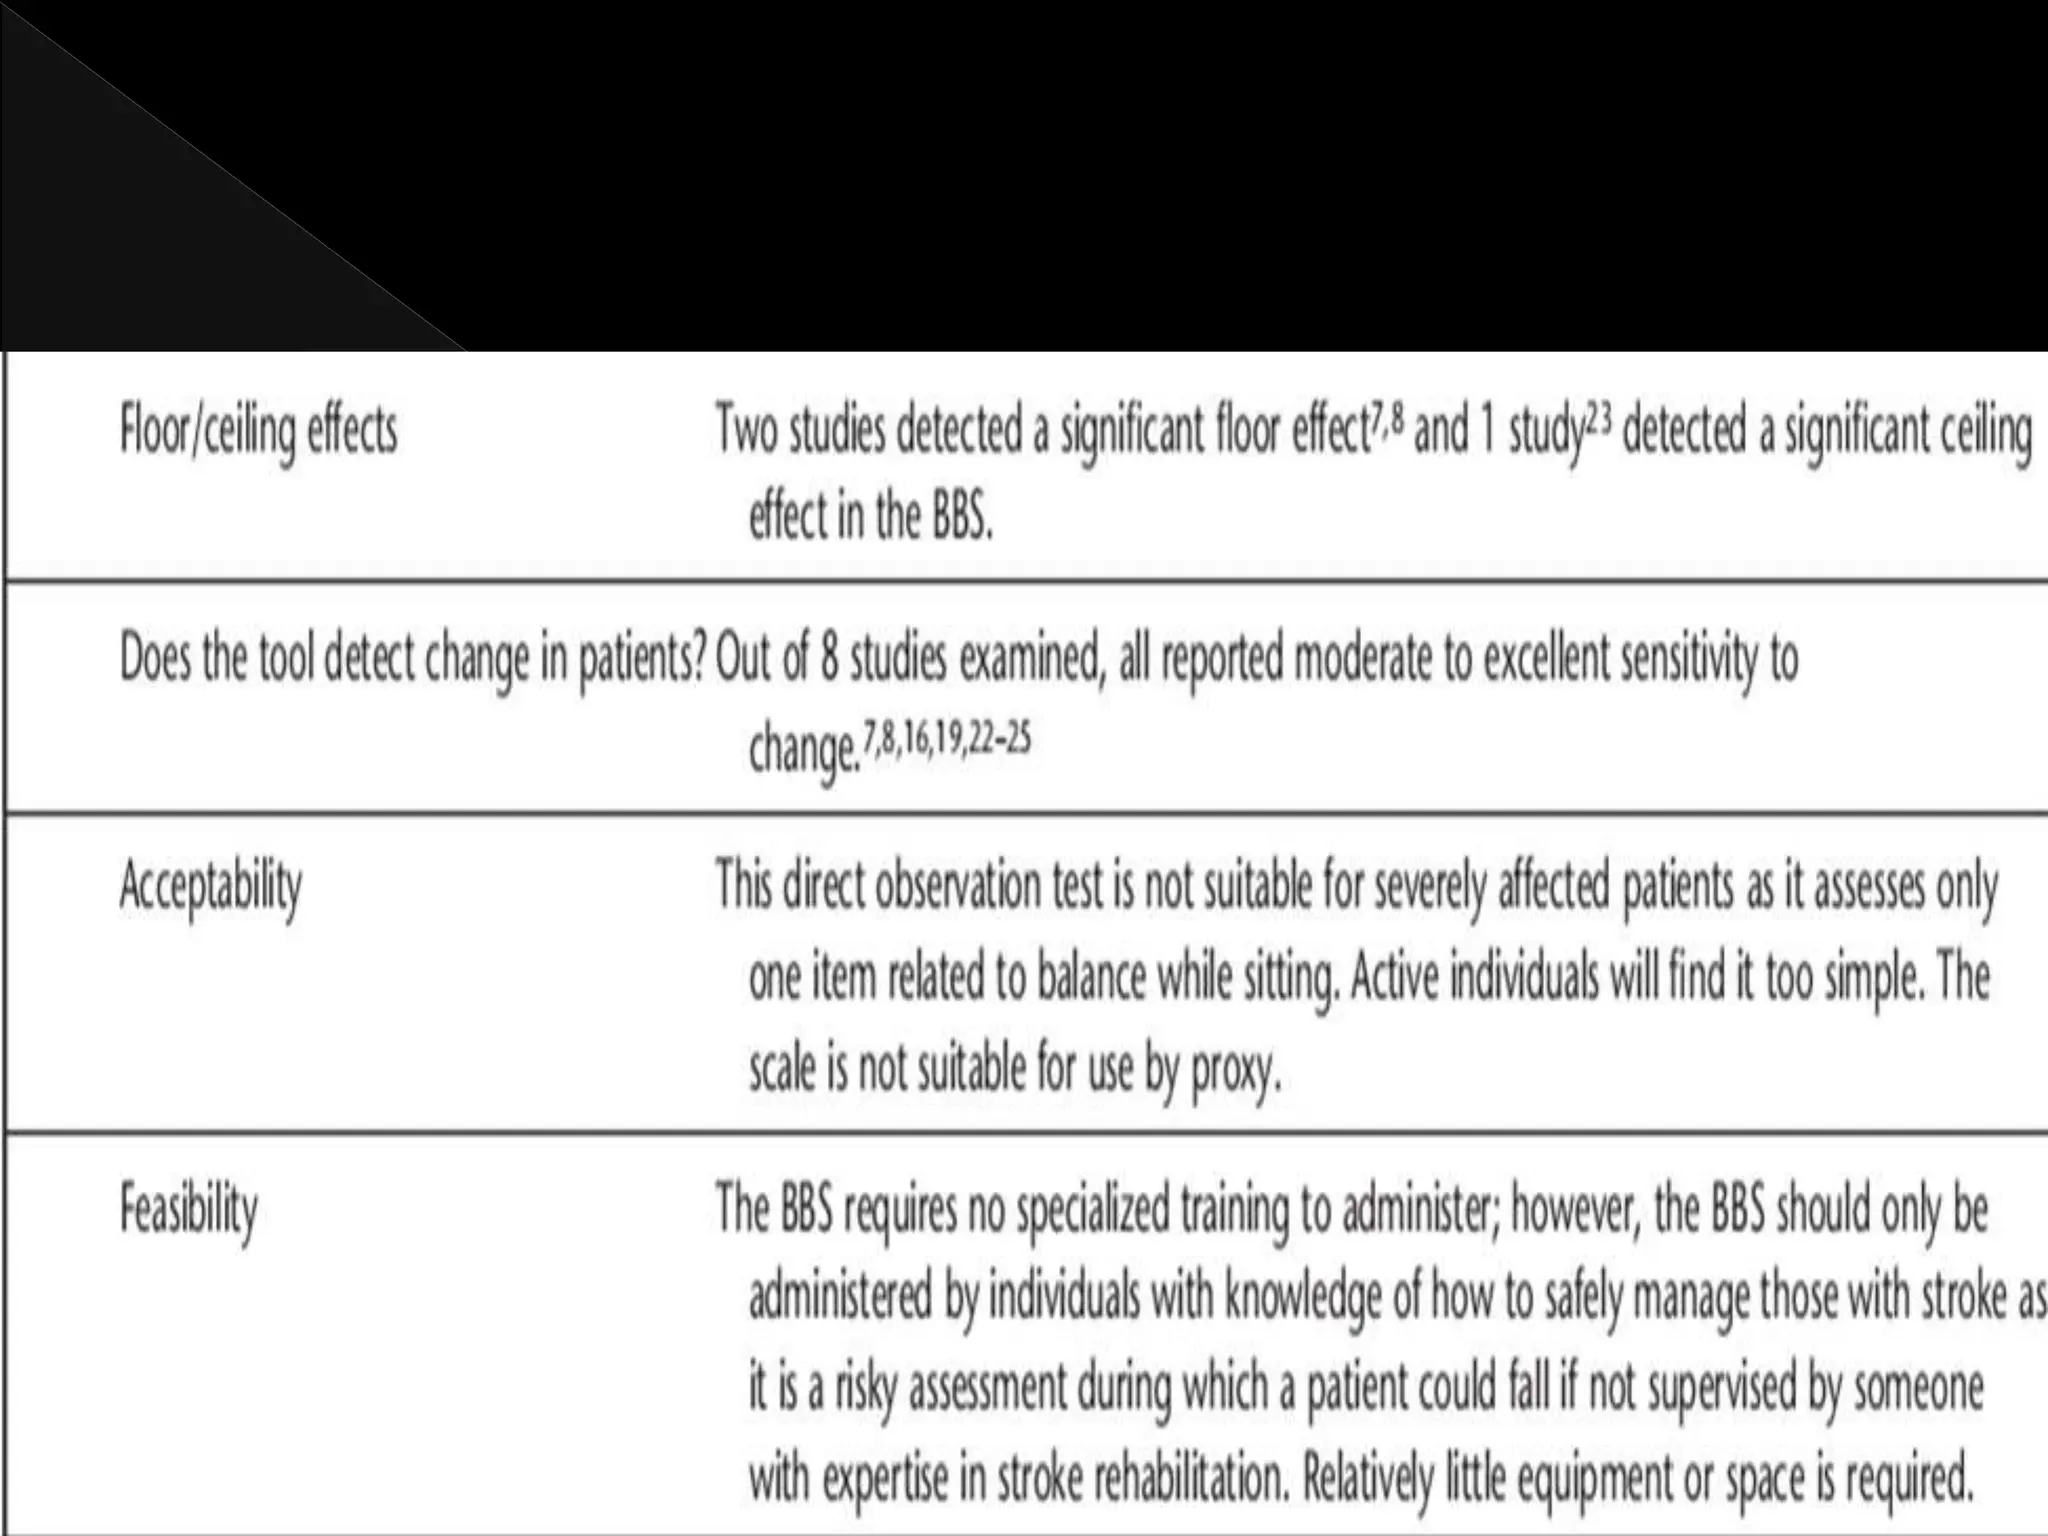
The document reviews various psychometric properties of different balance assessment scales, including the ABC scale, BBS, and modified functional reach test (MFRT), focusing on their reliability, validity, and responsiveness for stroke rehabilitation. It highlights findings from multiple studies indicating that while some scales show ceiling and flooring effects, the summary scores of certain assessments do not, allowing for meaningful evaluation of walking-related tasks. The document concludes that the BBS and MFRT are sensitive to balance declines post-stroke, with recommendations for using shorter assessments where time efficiency is critical.
![ Participants in the moderately severe to severe AD
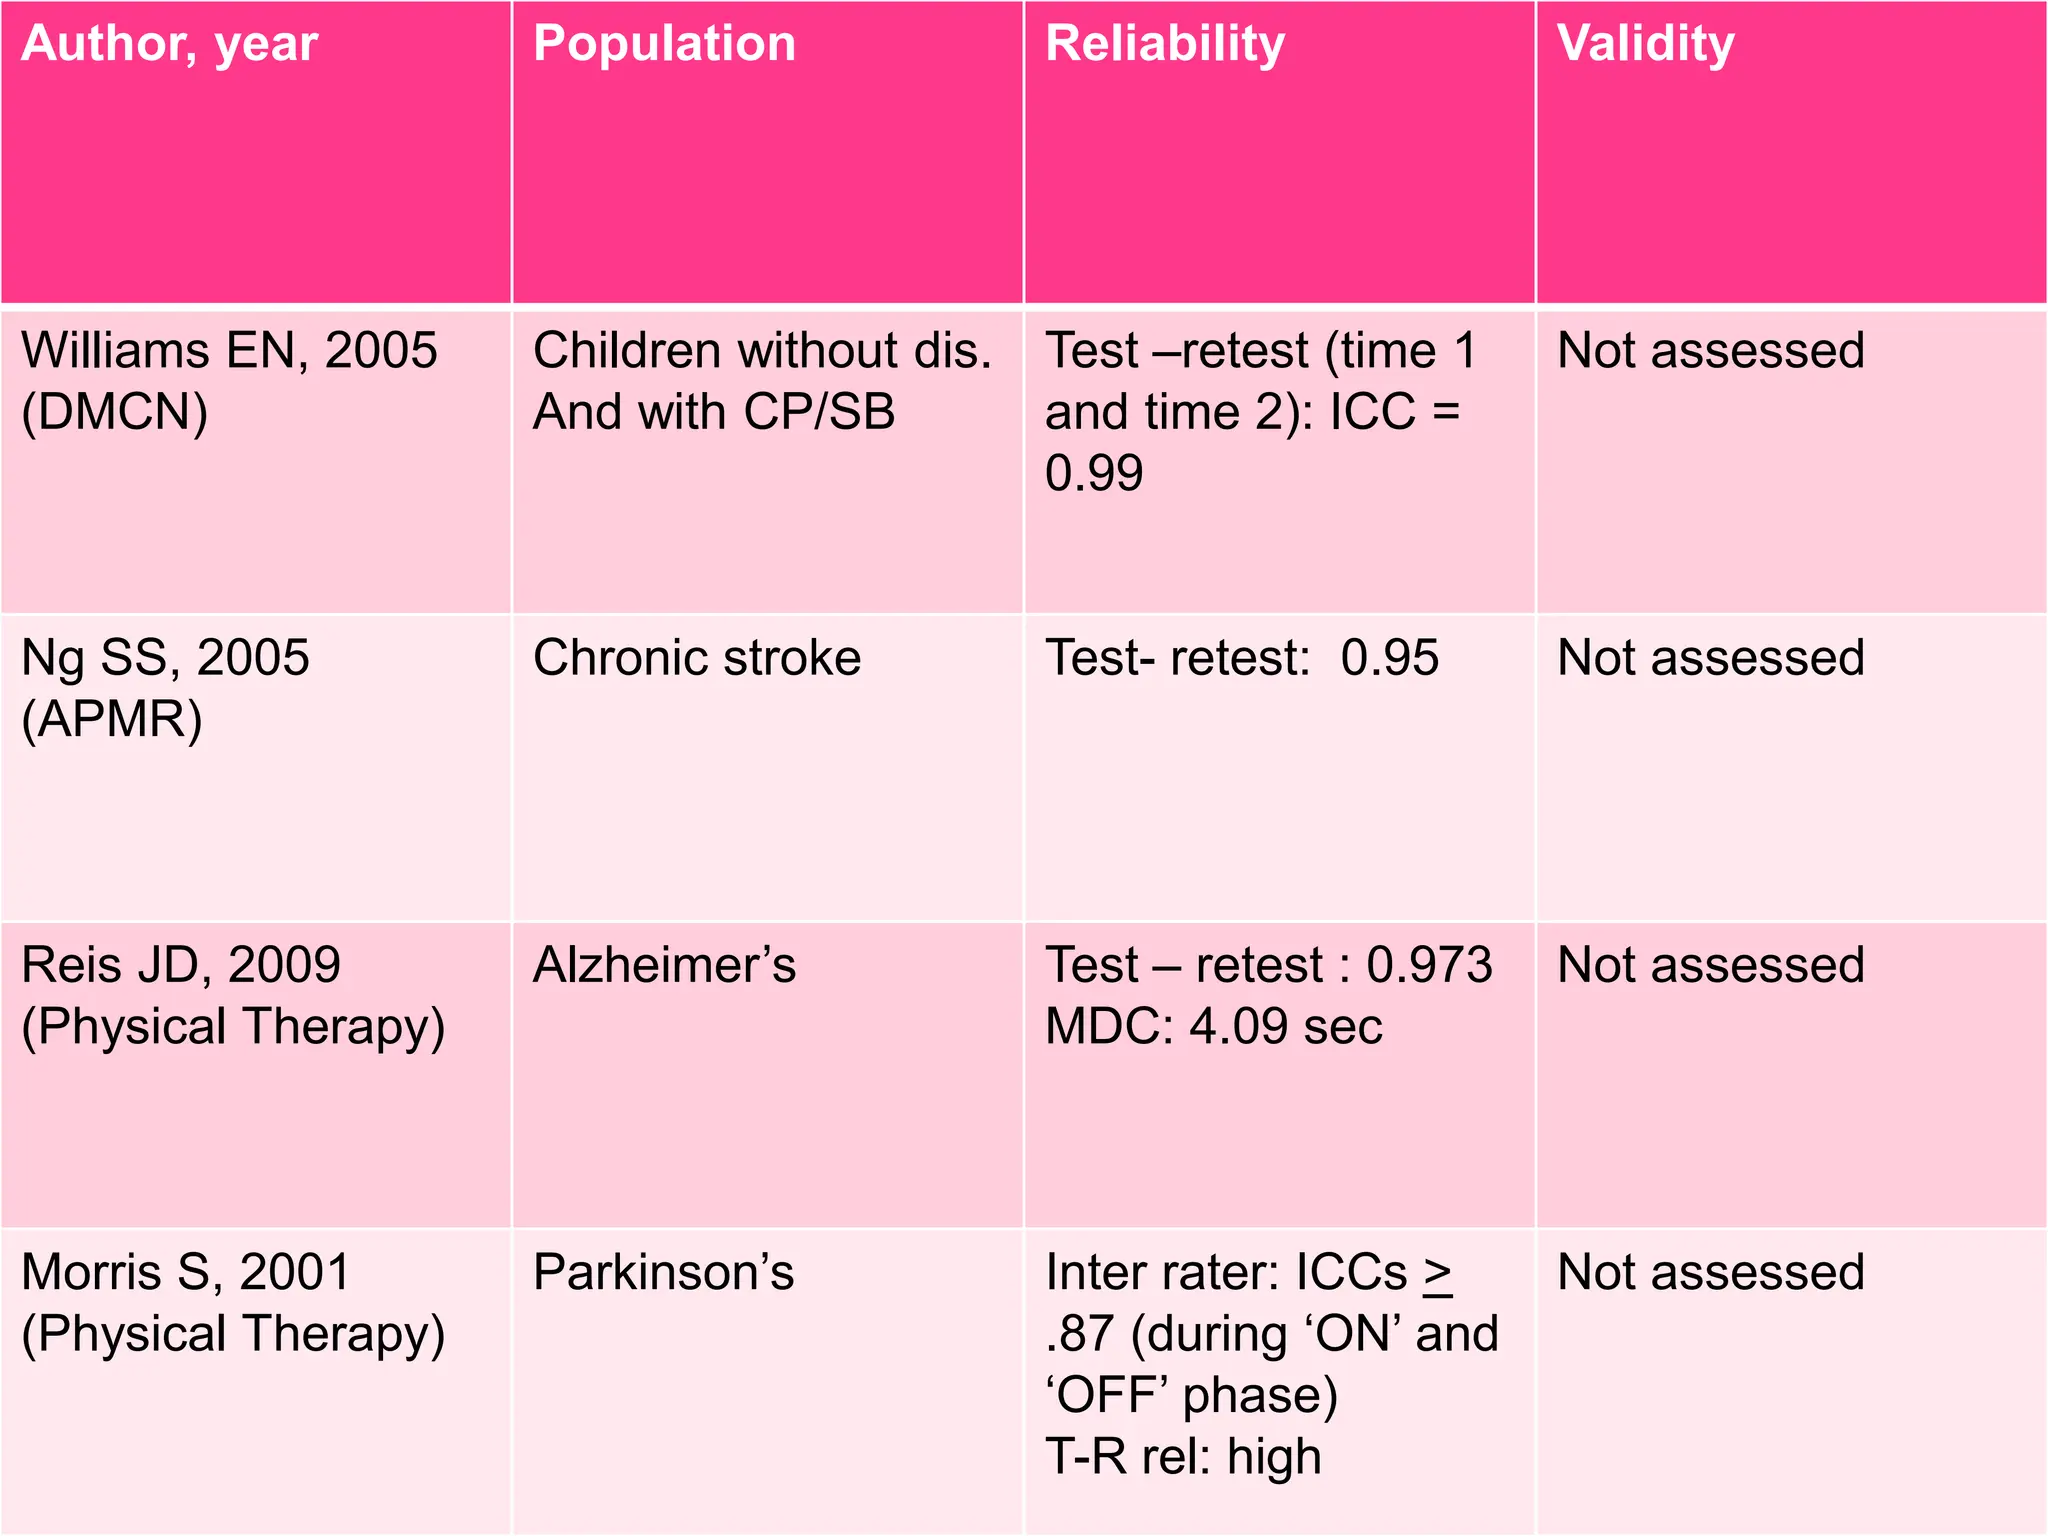
group had comparable MMSE scores (10.2 [8.8])
and were able to perform the test with excellent
relative reliability results (Reis JD)
The moderate negative correlation (rho=–0.52) of
TUG scores with the Standing and Walking
dimensions of GMFM indicates the potential for
TUG to be administered between GMFM testing
sessions to provide an indication of progress or
deterioration with regard to functional mobility.
However, a larger group of young people with
disability may provide stronger evidence of the
validity of TUG as a functional measure compared
with GMFM (Williams)](https://image.slidesharecdn.com/objectiveassessmentofposturalcontrol-240531062026-0596cb09/75/Objective-Assessment-of-Postural-Control-pptx-29-2048.jpg)

![ Winter DA, Prince F, Frank JS, Powell C, Zabjek KF.
Unified theory regarding A/P and M/L balance in quiet
stance. J Neurophysiol 1996;75:2334–43.
[33] Dickstein R, Abulaffio N. Postural sway of the
affected and non-affected pelvis and leg in stance of
hemiparetic patients. Arch Phys Med Rehabil
2000;81:364–7.
[34] Paillex R, So A. Posture debout chez sujet adultes:
spe ´cificite´sde l’he ´miple´gie. Ann Readapt Med Phys
2003;46:71–8.
[35] Karlsson A, Frykberg G. Correlations between force
plate measures for assessment of balance. Clin Biomech
2000;15:365–9.](https://image.slidesharecdn.com/objectiveassessmentofposturalcontrol-240531062026-0596cb09/75/Objective-Assessment-of-Postural-Control-pptx-39-2048.jpg)
![ 36] Niam S, Cheung W, Sullivan PE, Kent S, Gu X.
Balance and physical impairments after stroke. Arch
Phys Med Rehabil 1999; 80:1227–33.
[37] Pyoria O, Era P, Talvitie U. Relationships between
standing balance and symmetry measurements in patients
following recent strokes (3 weeks or less) or older
strokes (6 months or more). Phys Ther 2004; 84:128–36.
[38] Stevenson TJ, Garland SJ. Standing balance during
internally pro-duced perturbations in subjects with
hemiplegia: validation of the balance scale. Arch Phys
Med Rehabil 1996;77:656–62.
[39] Corriveau H, Hebert R, Raiche M, Prince F.
Evaluation of postural stability in the elderly with stroke.
Arch Phys Med Rehabil 2004;85:1095–101.](https://image.slidesharecdn.com/objectiveassessmentofposturalcontrol-240531062026-0596cb09/75/Objective-Assessment-of-Postural-Control-pptx-40-2048.jpg)


