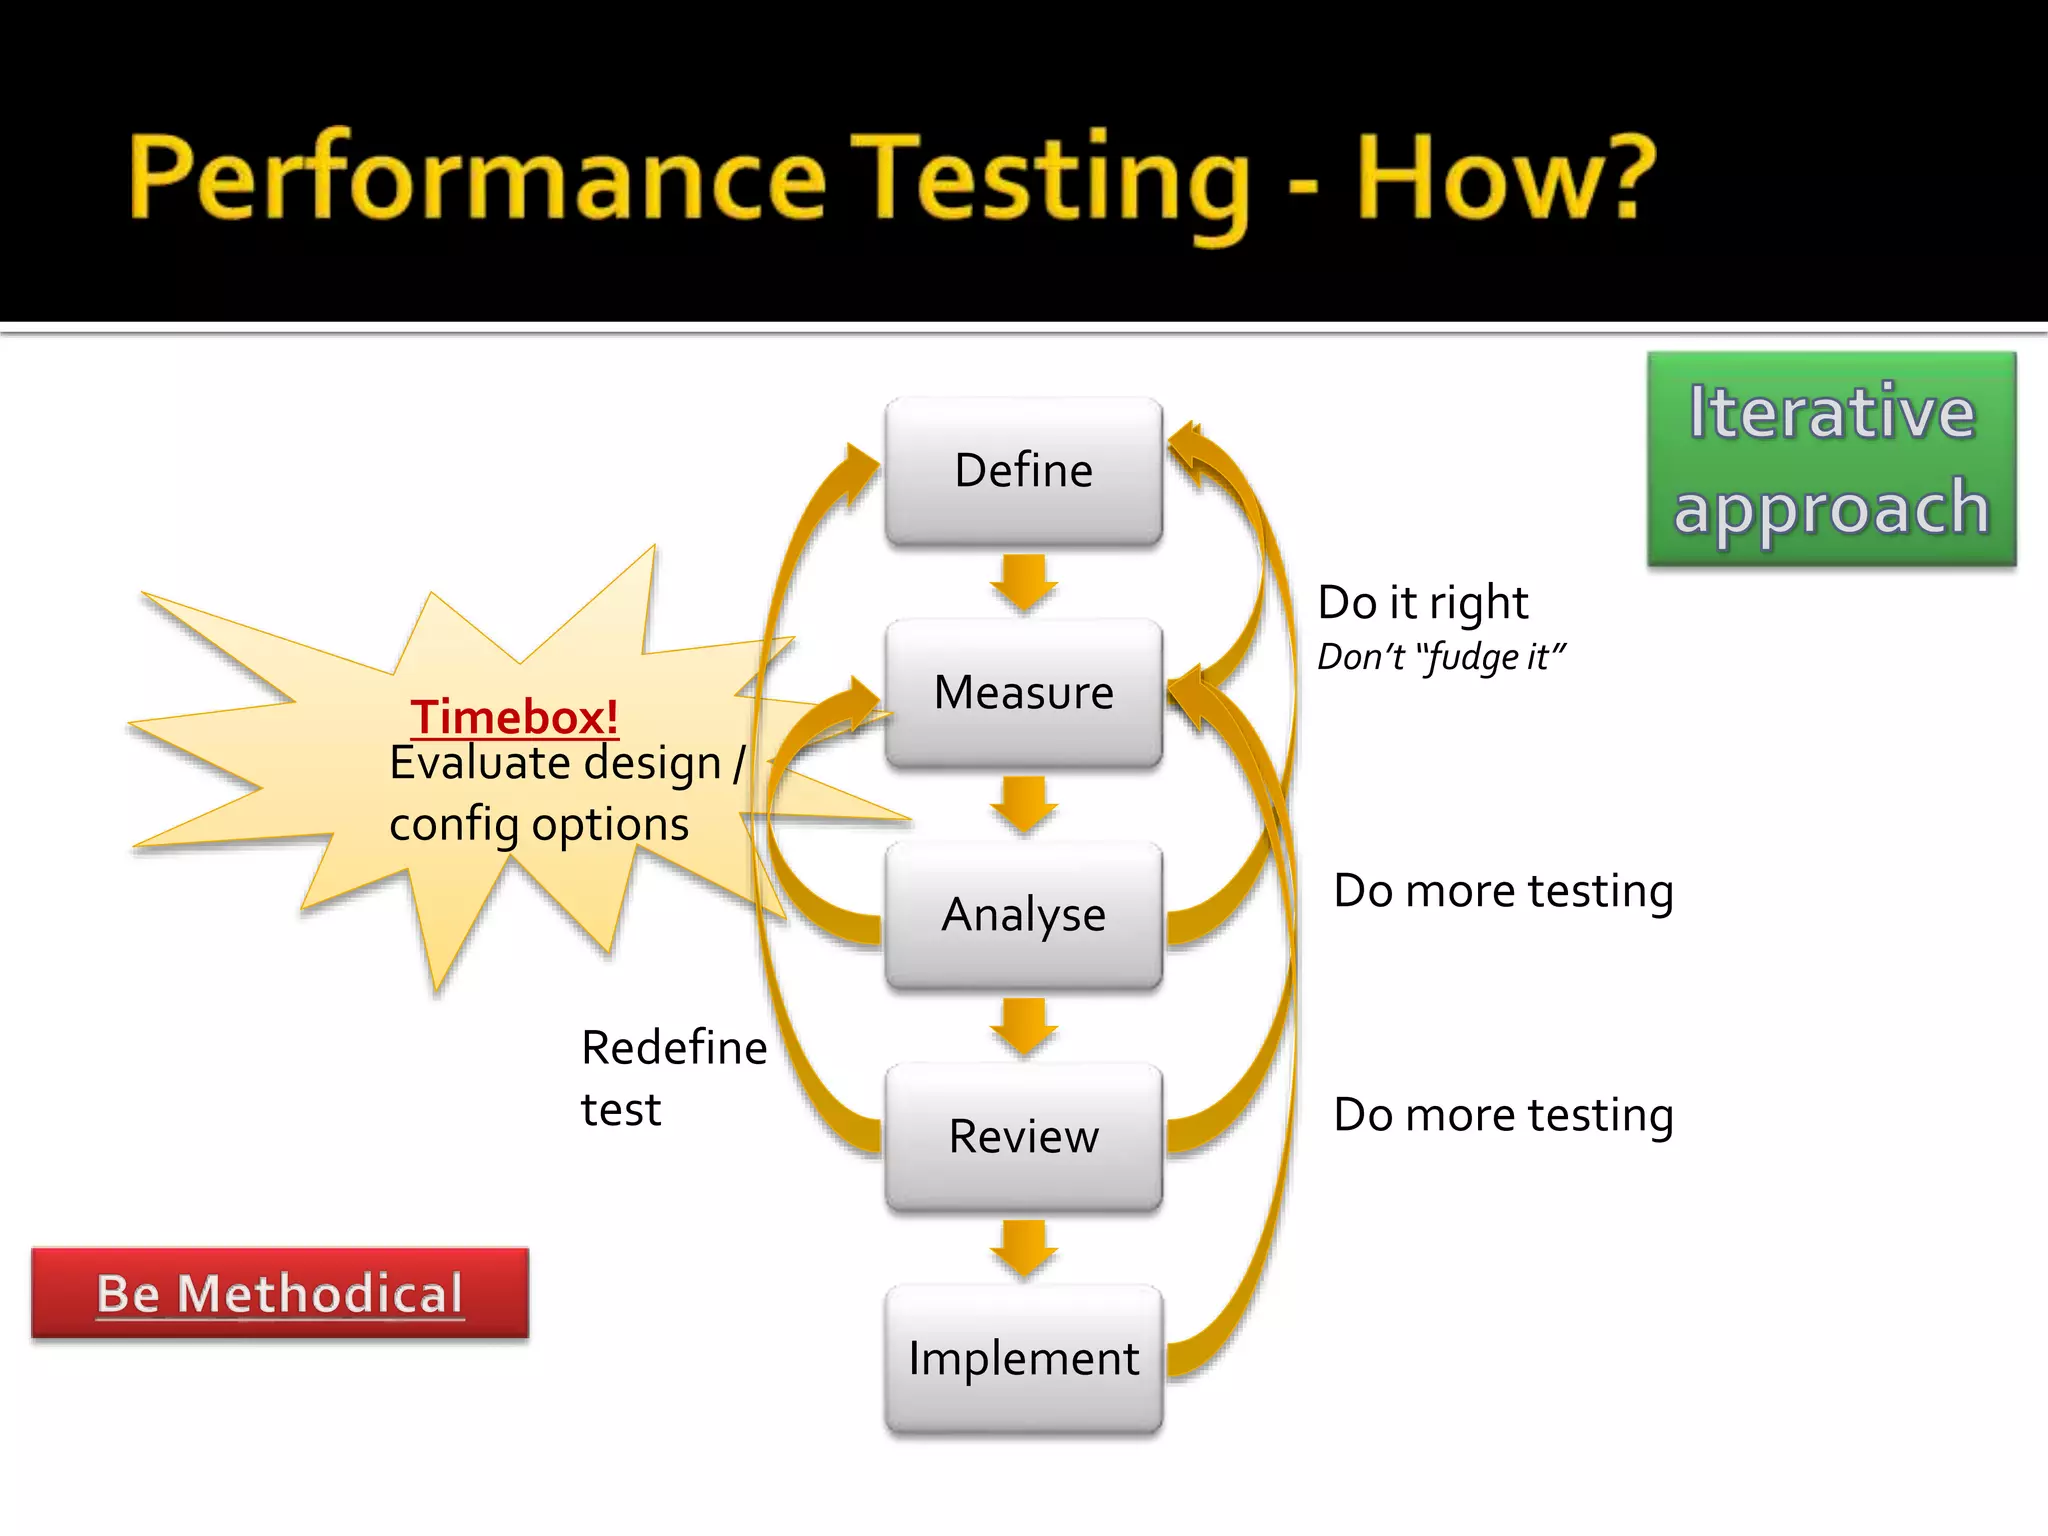
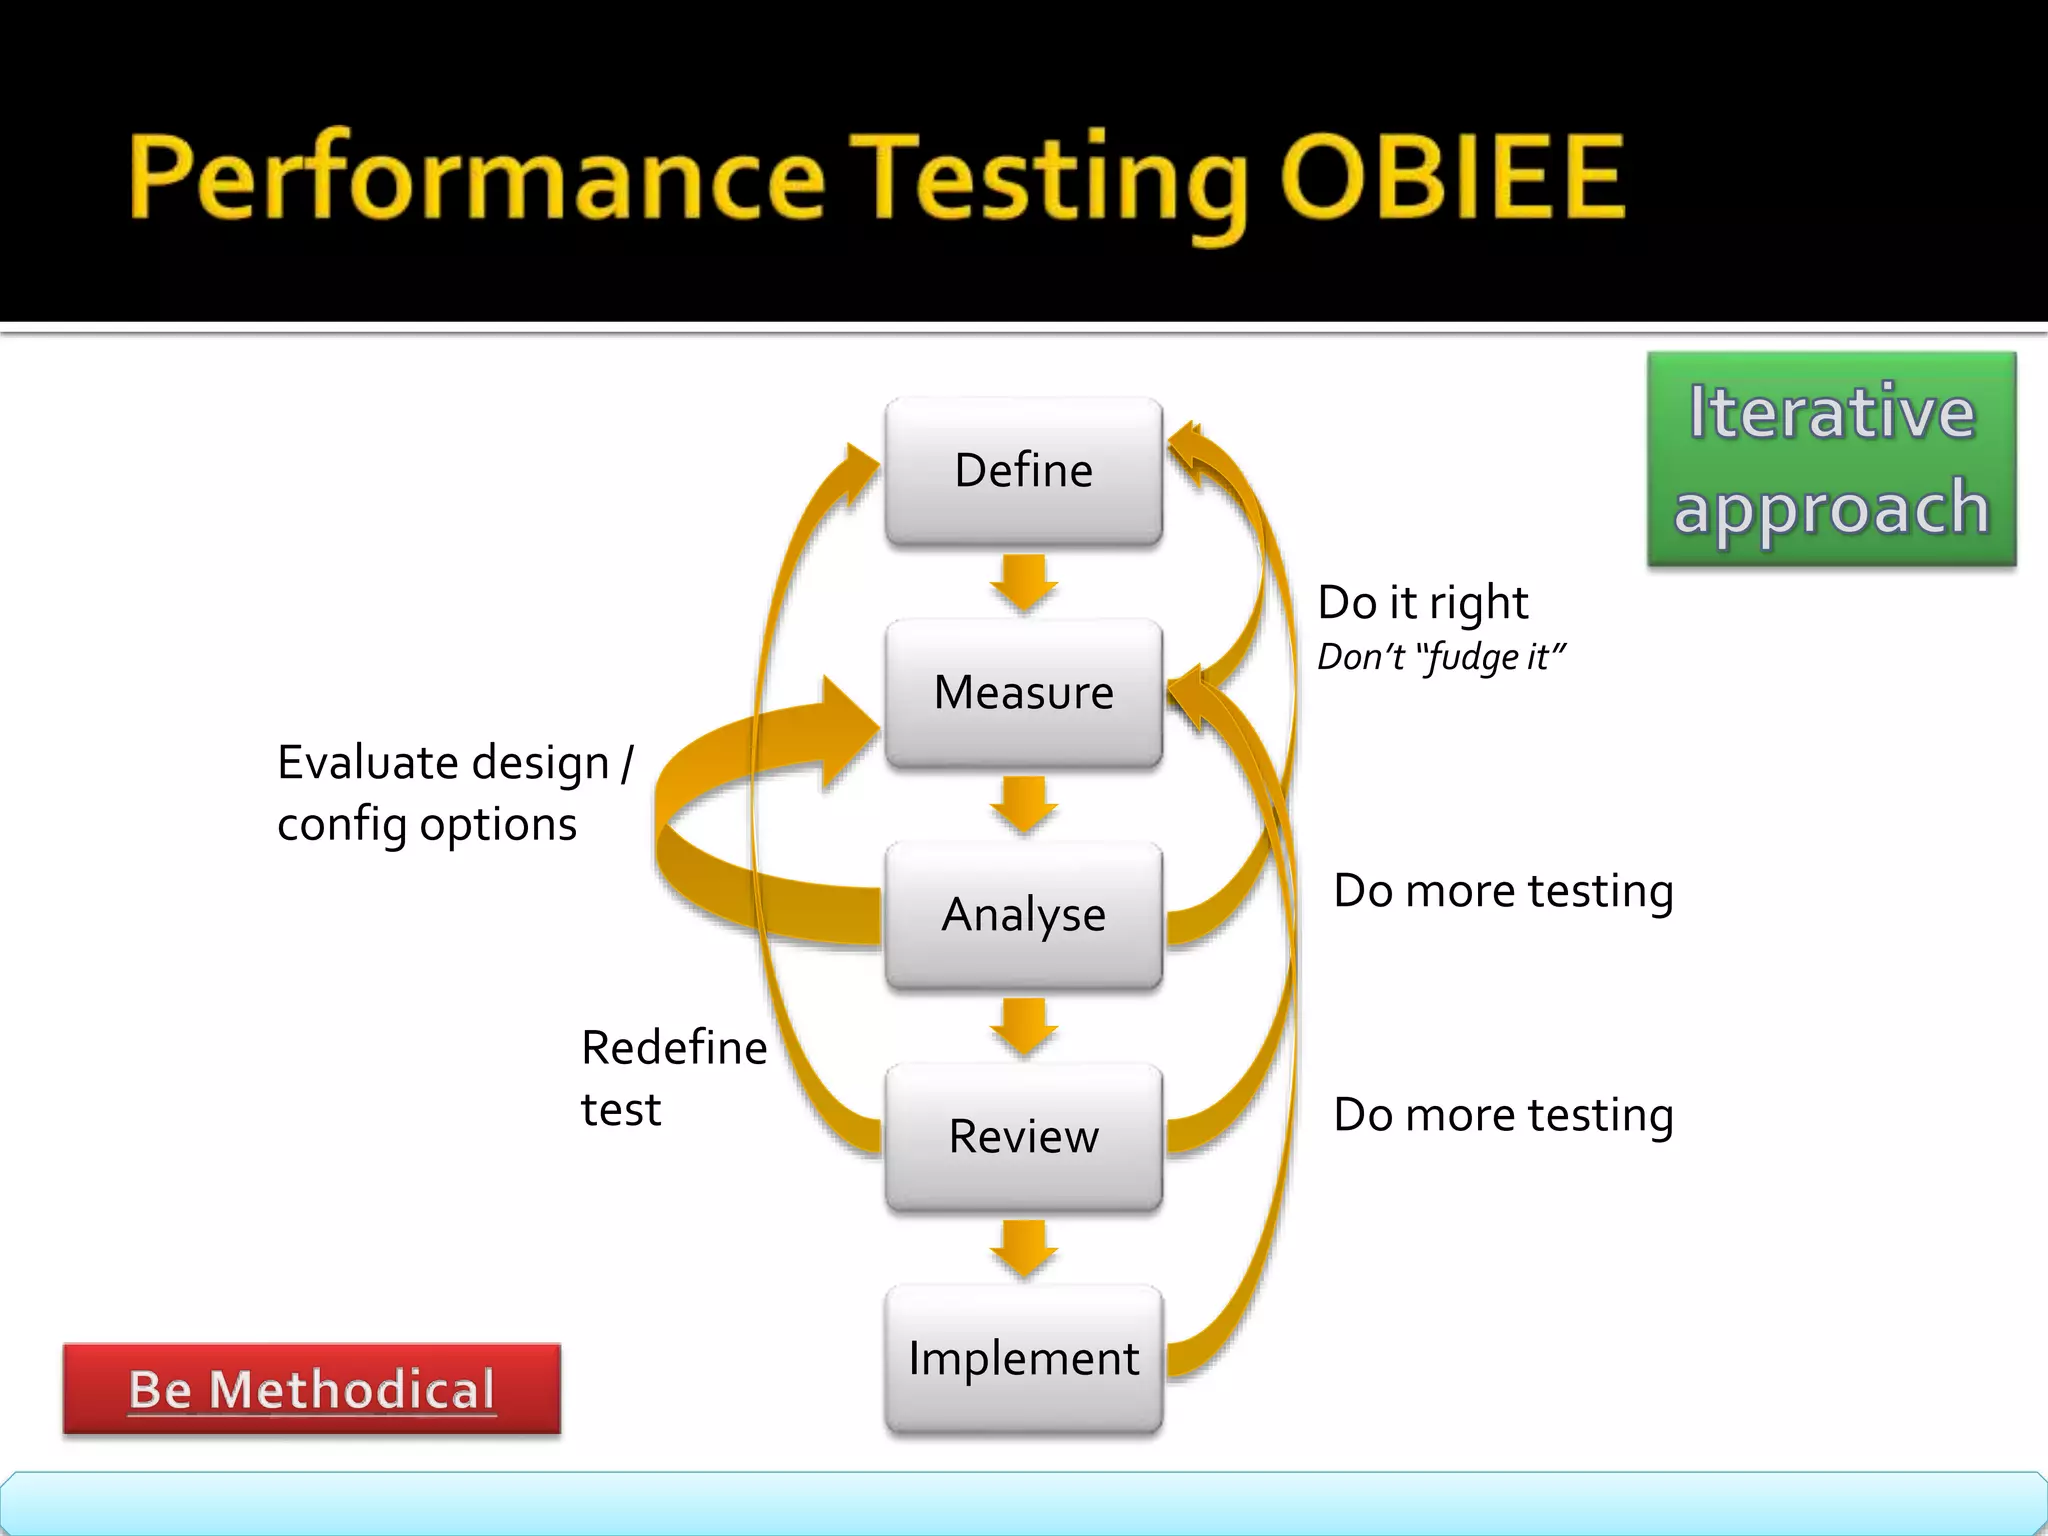
Performance Testing and OBIEE 
By 
Quontra Solutions
 Oracle BI specialist at Morrisons plc 
 Big IT development programme at its early 
stages implementing OBIEE, OBIA, ORDM, all 
on Oracle 11g & HP-UX
 A Performance Tuning Methodology 
 OBIEE techie stuff 
 Learn from my mistakes!
 Response times 
 Report 
 ETL batch 
 OLTP transaction 
 System impact 
 Resource usage 
 Scalability
 Check that your system performs 
 Are the users going to be happy? 
 Baseline 
 How fast is fast? 
▪ How slow is slow? 
 Validate system design 
 Do it right, first time 
 Capacity planning
 It’s never too late 
 “You’ll never catch all your problems in pre-production 
testing. That’s why you need a reliable 
and efficient method for solving the problems that 
leak through your pre-production testing 
processes.”
 Because it makes you better at your job 
 “At the very least, your performance test plan will 
make you a more competent diagnostician (and 
clearer thinker) when it comes time to fix the 
performance problems that will inevitably occur 
during production operation.”
 Quantifying response times 
 System impact 
 User expectations 
 Problem diagnosis 
 Design validation
Define 
Measure 
Analyse 
Review 
Implement 
Timebox! 
Evaluate design / 
config options 
Do it right 
Don’t “fudge it” 
Do more testing 
Redefine 
test Do more testing
 Define – what are you going to test 
• Aim of the test 
• Scope 
• Assumptions 
• Specifics 
• Data, environment, etc 
 Build – how are you going to test it 
 OBIEE specific 
Define 
Measure 
Analyse 
Review 
Implement 
•E.g. : 
•Check that the system performs 
•Baseline performance 
•Prove system capacity 
•Validate system design
Define 
Measure 
Analyse 
Review 
Implement 
MoFrew coemr cpoomnpeonntse n= tms =o reea csoiemr ptole mx a=n magoere = v maroiareb lperse =c ilsaer g=e mr moraer gefinfi coife nertror
Database 
Presentation 
Services 
BI Server 
Report / 
Dashboard 
Logical SQL 
Physical SQL 
statement(s) 
Data set(s) 
Data set 
Rendered 
report 
Excludes App/Web server & presentation 
services plug-in 
Define 
Measure 
Analyse 
Review 
Implement
Database 
Presentation 
Services 
nqcmd 
BI Server 
SQL Client 
Physical 
SQL 
LSQL 
Physical 
SQL 
User & 
Stopwatch 
Load Testing tool 
(eg. LoadRunner, 
OATS) 
Define 
Measure 
Analyse 
Review 
Implement
Define 
Measure 
Analyse 
Review 
Implement 
Usage Tracking 
or NQQuery.log 
Test 
script 
BI 
Server 
Data 
nqcmd 
Logical 
SQL 
Logical 
SQL Logical 
SQL
Master test script 
Define 
Measure 
Analyse 
Review 
Implement 
Test 
script 
BI 
Server 
Data 
nqcmd 
Logical 
SQL 
Test 
script 
nqcmd 
Test 
script 
nqcmd 
Test 
script 
nqcmd
 Simulates user interaction – HTTP traffic 
 Powerful, but can be difficult to set up 
 Ajax complicates things 
 Do you really need to use it? 
 Tools 
 Fiddler2 
 FireBug 
 Reference: 
 My Oracle Support – Doc ID 496417.1 
 http://rnm1978.wordpress.com/category/loadrunner 
Define 
Measure 
Analyse 
Review 
Implement
 Be very clear what the aim of your test is 
 You probably need to define multiple tests 
 Different points on the OBIEE stack to 
interface 
 Pick the most appropriate one 
 Write everything down! 
Define 
Measure 
Analyse 
Review 
Implement
Define 
Measure 
Analyse 
Review 
Implement
Define 
Measure 
Analyse 
Review 
Implement 
Database 
Presentation 
Services 
BI Server 
Apache log Web Server 
App Server 
Presentation 
Services plug-in 
OAS log 
Analytics 
log 
sawserver.log 
NQServer.log 
NQQuery.log 
systems 
management 
Enterprise 
Manager 
BI Management Pack 
Usage 
Tracking 
PerfMon 
(windows 
only) 
jConsole etc 
Presentation 
services 
Enterprise 
Manager 
ASH, AWR, 
SQL Monitor 
Server metrics 
e.g. : IO, CPU, Memory 
PerfMon 
(Windows) 
Oracle OS 
Watcher 
(unix) 
Enterprise 
Manager 
(Oracle)
Define 
Measure 
Analyse 
Review 
Implement
 Lots of different ways to measure 
 Build measurement into your test plan 
 Automate where possible 
▪ Easier 
▪ Less error 
Define 
Measure 
Analyse 
Review 
Implement
Define 
Measure 
Analyse 
Review 
Implement
Define 
Measure 
Analyse 
Review 
Implement
Define 
Measure 
Analyse 
Review 
Implement
Response time 
1 
1 
9 
3 
2 
10 
2 
1 
2 
3 
1 
1 
1 
2 
2 
2 
3 
3 
9 
10 
Average 
(mean) 
3.4 
50th percentile 
(Median) 
2 
90th percentile 
9.1 
Define 
Measure 
Analyse 
Review 
Implement
Define 
Measure 
Analyse 
Review 
Implement 
Dashboard 
Requests 
Logical SQL • ORA_HASH(QUERY_TEXT) 
Physical SQL • SQL IDs 
Execution plan • Execution plan hash id
S_NQ_ACCT 
START_TS 
ROW_COUNT 
TOTAL_TIME_SEC 
NUM_DB_QUERY 
QUERY_TEXT 
QUERY_SRC_CD 
SAW_SRC_PATH 
SAW_DASHBOARD 
OBIEE_REPLAY_STATEMENTS 
qt_ora_hash 
query_text 
saw_path 
dashboard 
OBIEE_REPLAY_STATS 
testid 
testenv 
qt_ora_hash 
start_ts 
response_time 
row_count 
db_query_cnt 
Define 
Measure 
Analyse 
Review 
Implement
Define 
Measure 
Analyse 
Review 
Implement 
Evaluate design / 
config options 
Do it right 
Don’t “fudge it” 
Timebox!
Define 
Measure 
Analyse 
Review 
Implement 
Redefine 
test 
Continue 
testing 
Implement
Define 
Measure 
Analyse 
Review 
Implement
Define 
Measure 
Analyse 
Review 
Implement
 You won’t get your testing right first time 
 There’s no shame in that 
 Don’t cook the books 
▪ Better to redefine your test than invalidate its results 
 Stick to the methodology 
 Don’t move the goalposts 
 Very tempting to pick off the “low-hanging fruit” 
▪ If you do, make sure you don’t get indigestion… 
 Timebox 
 Test your implementation!
Define 
Measure 
Analyse 
Review 
Implement 
Evaluate design / 
config options 
Do it right 
Don’t “fudge it” 
Do more testing 
Redefine 
test Do more testing
Performance Testing and OBIEE by QuontraSolutions

Performance Testing and OBIEE by QuontraSolutions

  • 1.
    Performance Testing andOBIEE By Quontra Solutions
  • 2.
     Oracle BIspecialist at Morrisons plc  Big IT development programme at its early stages implementing OBIEE, OBIA, ORDM, all on Oracle 11g & HP-UX
  • 3.
     A PerformanceTuning Methodology  OBIEE techie stuff  Learn from my mistakes!
  • 4.
     Response times  Report  ETL batch  OLTP transaction  System impact  Resource usage  Scalability
  • 5.
     Check thatyour system performs  Are the users going to be happy?  Baseline  How fast is fast? ▪ How slow is slow?  Validate system design  Do it right, first time  Capacity planning
  • 6.
     It’s nevertoo late  “You’ll never catch all your problems in pre-production testing. That’s why you need a reliable and efficient method for solving the problems that leak through your pre-production testing processes.”
  • 7.
     Because itmakes you better at your job  “At the very least, your performance test plan will make you a more competent diagnostician (and clearer thinker) when it comes time to fix the performance problems that will inevitably occur during production operation.”
  • 8.
     Quantifying responsetimes  System impact  User expectations  Problem diagnosis  Design validation
  • 9.
    Define Measure Analyse Review Implement Timebox! Evaluate design / config options Do it right Don’t “fudge it” Do more testing Redefine test Do more testing
  • 10.
     Define –what are you going to test • Aim of the test • Scope • Assumptions • Specifics • Data, environment, etc  Build – how are you going to test it  OBIEE specific Define Measure Analyse Review Implement •E.g. : •Check that the system performs •Baseline performance •Prove system capacity •Validate system design
  • 11.
    Define Measure Analyse Review Implement MoFrew coemr cpoomnpeonntse n= tms =o reea csoiemr ptole mx a=n magoere = v maroiareb lperse =c ilsaer g=e mr moraer gefinfi coife nertror
  • 12.
    Database Presentation Services BI Server Report / Dashboard Logical SQL Physical SQL statement(s) Data set(s) Data set Rendered report Excludes App/Web server & presentation services plug-in Define Measure Analyse Review Implement
  • 13.
    Database Presentation Services nqcmd BI Server SQL Client Physical SQL LSQL Physical SQL User & Stopwatch Load Testing tool (eg. LoadRunner, OATS) Define Measure Analyse Review Implement
  • 14.
    Define Measure Analyse Review Implement Usage Tracking or NQQuery.log Test script BI Server Data nqcmd Logical SQL Logical SQL Logical SQL
  • 15.
    Master test script Define Measure Analyse Review Implement Test script BI Server Data nqcmd Logical SQL Test script nqcmd Test script nqcmd Test script nqcmd
  • 16.
     Simulates userinteraction – HTTP traffic  Powerful, but can be difficult to set up  Ajax complicates things  Do you really need to use it?  Tools  Fiddler2  FireBug  Reference:  My Oracle Support – Doc ID 496417.1  http://rnm1978.wordpress.com/category/loadrunner Define Measure Analyse Review Implement
  • 17.
     Be veryclear what the aim of your test is  You probably need to define multiple tests  Different points on the OBIEE stack to interface  Pick the most appropriate one  Write everything down! Define Measure Analyse Review Implement
  • 18.
    Define Measure Analyse Review Implement
  • 19.
    Define Measure Analyse Review Implement Database Presentation Services BI Server Apache log Web Server App Server Presentation Services plug-in OAS log Analytics log sawserver.log NQServer.log NQQuery.log systems management Enterprise Manager BI Management Pack Usage Tracking PerfMon (windows only) jConsole etc Presentation services Enterprise Manager ASH, AWR, SQL Monitor Server metrics e.g. : IO, CPU, Memory PerfMon (Windows) Oracle OS Watcher (unix) Enterprise Manager (Oracle)
  • 20.
    Define Measure Analyse Review Implement
  • 21.
     Lots ofdifferent ways to measure  Build measurement into your test plan  Automate where possible ▪ Easier ▪ Less error Define Measure Analyse Review Implement
  • 22.
    Define Measure Analyse Review Implement
  • 23.
    Define Measure Analyse Review Implement
  • 27.
    Define Measure Analyse Review Implement
  • 28.
    Response time 1 1 9 3 2 10 2 1 2 3 1 1 1 2 2 2 3 3 9 10 Average (mean) 3.4 50th percentile (Median) 2 90th percentile 9.1 Define Measure Analyse Review Implement
  • 29.
    Define Measure Analyse Review Implement Dashboard Requests Logical SQL • ORA_HASH(QUERY_TEXT) Physical SQL • SQL IDs Execution plan • Execution plan hash id
  • 30.
    S_NQ_ACCT START_TS ROW_COUNT TOTAL_TIME_SEC NUM_DB_QUERY QUERY_TEXT QUERY_SRC_CD SAW_SRC_PATH SAW_DASHBOARD OBIEE_REPLAY_STATEMENTS qt_ora_hash query_text saw_path dashboard OBIEE_REPLAY_STATS testid testenv qt_ora_hash start_ts response_time row_count db_query_cnt Define Measure Analyse Review Implement
  • 31.
    Define Measure Analyse Review Implement Evaluate design / config options Do it right Don’t “fudge it” Timebox!
  • 32.
    Define Measure Analyse Review Implement Redefine test Continue testing Implement
  • 33.
    Define Measure Analyse Review Implement
  • 34.
    Define Measure Analyse Review Implement
  • 35.
     You won’tget your testing right first time  There’s no shame in that  Don’t cook the books ▪ Better to redefine your test than invalidate its results  Stick to the methodology  Don’t move the goalposts  Very tempting to pick off the “low-hanging fruit” ▪ If you do, make sure you don’t get indigestion…  Timebox  Test your implementation!
  • 36.
    Define Measure Analyse Review Implement Evaluate design / config options Do it right Don’t “fudge it” Do more testing Redefine test Do more testing

Editor's Notes

  • #2 Watch Water
  • #3 At Morrisons we’re on the latest (current) version of OBIEE 10g, and use Oracle 11g on HP. We’re using OBIA, ORDM, and we’ve built our own ODS using Oracle Data Integrator The performance work that I’ve done so far has been with OBIA, but what I’ll be talking about today should be applicable to any OBIEE installation. I’m interested to hear other people’s experience with OBIA and performance. Come and speak to me afterwards! We did Performance work for Existing prob with OBIA Methodology – future projects
  • #4 Three things to take away Questions – quick as we go / Q&A discussion at end NB – testing, not //tuning//
  • #5 Quantified & Empirical So– what is performance testing? I want to go through this pretty briefly, as it’s a huge area of theory that I can’t do proper justice to. I’ll try and cover off what I see as some of the basics It’s important to really understand this when you’re doing it, otherwise you’re not going to get valid test results and you’ll probably end up wasting a lot of time. For a proper understanding of it I’d really recommend reading papers written by Cary Millsap. Performance testing is a term used to cover quite a few different things. The way I define it – and this may or may not be industry standard, so apologies – is this: Performance testing itself is this [click] – Does it go fast enough? Does my report run in a time that meets user specification, or expectation? (This is within the context of OBIEE – for ETL we’d be talking about job runtimes and batch windows) The next stage after performance testing is generally load testing [click] This is to answer the question Will it still go fast enough, once everyone’s using it? The other big consideration with load testing is -- Will it break my server? Or to be a bit more precise, what kind of impact is a new system going to have on an existing one? When you put your new reporting system live what will happen to the existing one that’s been running happily for a year? A logical extension of load testing is stress testing - how far can it scale? This applies to both the reporting system you’re putting in, and the servers themselves (which therefore feeds into capacity planning). I’ve heard these terms used interchangeably, and there’s quite a difference between them in my mind. Why does it matter? Well it dictates how you design and execute your testing. When you move from performance testing to load testing you generally take a step back in terms of level of detail. My definition: Load Testing is not Performance Testing. It may be an area within it, but it is most definitely not one and the same thing. This presentation is not about performance TUNING Of course, testing feeds into tuning which in turn feeds into testing, so the two are inextricably linked. But to try and keep things focussed - I will try to avoid discussing tuning specifics otherwise we’ll be here all day…. Performance testing is the repeatable running of a request to obtain metrics (primarily response time), to determine whether its performance is acceptable or not Acceptable is a subjective term, but would typically be driven by user requirements In the context of OBIEE then we’re basically talking about does an Answers report or dashboard run fast enough to keep the users happy? Load Testing is about quantifying the effect an application is going to have on a system whether the application is going to perform acceptably on the system when its under load One report run on its own might be fine, but what happens on a Monday morning when a thousand users all log on at the same time and all run the report?
  • #6 This may be stating the obviously, but there are some pretty hefty reasons why you should incorporate multiple iterations of performance testing in any new development. - To test if the new system performs well Is it going to return the data to the users in the time that they’re expecting? If you don’t test for this reason alone then you’re either brave, or foolhardy! What are BI systems about, if not providing the best experience to the end user - To provide baselines How do you know if a system is performing worse if you don't know how it performed before How often have you had the problem reported to you “my report’s running slow”? Well what’s slow? 9 minutes? If it took 10 seconds to run when you put the system live, then you’ve got a problem. If it took 9 minutes to run when you put the system live then you’ve possibly just got an impatient user with unrealistic expectations. When you do get a performance problem, assuming you did your performance test packs beforehand you’ll be all set to diagnose where the problem lies By their definition, performance tests generate a lot of lovely metrics Once you think you’ve fixed the performance problem, you need to validate two things Have you fixed it? Have you broken anything else? Your performance test packs will give you the basis on which to prove it - To validate the way you are building the system For example, partitioning or indexing methods How often have you heard “It Depends” from a DBA? Optimal Parallelism setting or Partitioning strategy this time round may be different from what was optimal on the last project you did An index may help one report, how do you know it doesn’t hinder another? Unless you have a pack of repeatable tests with timings then you can’t quickly tell what the impact is In effect, you do your performance tuning up-front, as part of the build, rather than with a thousand angry users furious that their reports have stopped working
  • #7 It’s not too late to put in place a solid performance test methodology around an existing system. If you set up your performance tests now you will have a set of baselines and a full picture of how your system behaves normally Then when it breaks or someone complains you’re already set to deal with it If you don’t, then when you do have problems you have to start from scratch, finding your way through the process. Which is better – at your leisure, or with the proverbial gun of unhappy users held to your head? Performance testing isn’t optional. It’s mandatory. It’s just up to you when you do it. Even if you’re running Exadata or similar and a so confident that you don’t have performance problems and never will – how are you going to capacity plan? Do you know how your system currently behaves in terms of CPU , IO, etc? How many more users can you run? Which is easier, simulate and calculate up front, or wait until it starts creaking?
  • #8 Performance Testing requires an extremely thorough understanding of the system. If you do it properly there is no doubt you will come out of it better equipped to support and develop the system further
  • #9 Any questions so far?
  • #10 This is the methodology we’ve developed It’s a high level view – subsequent slides will give detail
  • #11 Make sure you have a specific aim Easier to have two clear tests than try to cover everything in one Loose analogy - 10,000 ft view vs low-level flyby Don’t forget predicates – One report may have many filters and behave a lot differently depending on how they’re set WRITE IT ALL DOWN Think of breadth of test (# of reports) vs depth (# of metrics) If your test aim doesn’t define clearly enough how you’re going to run it, consider these two options: Option 1: Top down / Start big, see what breaks, follow standard troubleshooting of trying to isolate the problem Shortest time to get initial results Difficult to isolate any problems though Better for firefighting an existing problem where time is limited or there are obvious quick-wins imprecise For example – look in usage tracking for all reports that run > 5 minutes. Test only those reports. Option 2: Bottom up / Start small - define each test component, record behaviour for each test run, combine test components into bigger test runs, scale up to load testing Ultimately more precise More metrics = more precision = quicker to identify issues and resolutions But it’s boring ! Where’s my gigs of throughput bragging rights, or smoking server groaning under the load? What’s the point running a ten thousand users through your system just to prove it goes bang (or doesn’t)? Longer process, needs more accuracy For example, report response time requirements from users, representative workloads your testing may give rise to some tuning, your tests must be isolatable and repeatable, otherwise how do you validate that what you’ve changed has fixed the problem and not made it worse? Repeatable – what’s the complete set of things you’d need to run the same test somewhere else? Eg: Schema definition, DB config parameters, OBIEE NQSConfig, OBIEE RPD, OBIEE reports , [plus presentation services config & web cat] Isolatable – Do you have a dedicated performance environment?, What else is running at the same time?
  • #12 Reduce complexity intelligently Don’t cut corners, but distil the problem to its essence Pick the closest point up stream from the bottleneck. More components = greater margin of error! So you’ve seen the different places in which you can test OBIEE. But how do you choose the one most applicable to the testing you’re doing? Should you just run everything against the database directly? Basically, it’s about keeping it simple, and avoiding unnecessary complexity. Say someone gives you a Ducati engine to fix. [click] You’ve already identified the area of the problem. Would you still spend all your time looking at the whole engine, or isolate where you know the problem lies and work on it from there? [click] Now clearly this isn’t an absolute, because there could be more than one problem with the engine, and so on – but the principle is sound. Reduce the complexity, intelligently. The same principle applies to testing OBIEE. Depending on the kind of reports, your RPD, and your data model and database, your performance bottlenecks will be somewhere across all of the stack. You shouldn’t be looking to cut corners, but look at it as distilling down what you’re testing to its essence and nothing more. Hopefully this is pretty obvious, as it’s going to be a more efficient use of your time, but here’s the two reasons why: 1) Your tests show a slow response time and you need to track down and diagnose this. Would you rather be considering three elements or three hundred? When I was working on some performance testing, it was clear that very little time was spent after the BI Server passes data back up to the Presentation Services. So what I did was cut out presentation services entirely, because the aim of my testing was to resolve reports that were taking 5, 10 minutes to run, and these 5/10 minutes were always down-wind of presentation services Bear in mind where your dependencies lie, where the stack is coupled. The time itself was always in the database, but you can’t just edit the SQL, because that comes from the BI server. So you intelligently pick the closest point up stream from the bottleneck. 2) The other reason why you should reduce complexity is the impact that a change will have on your test plans. If you decide you want to implement a change, maybe based on the results of your testing. How many stages in the test would you like to have to go and change and re-configure your monitoring for – two or twenty?
  • #13  Hopefully everyone’s familiar with this picture. Here’s a quick refresher A rather grumpy looking user runs a Request in answers PS sends LSQL to BI Server BI server sends SQL to DB server DB server returns results to BI Server BI Server processes data (aggregates, stitches, etc) BI Server returns data to PS server PS Server renders and returns through web/app server to the user, who’s hopefully now happy …
  • #14 So, how can we do our testing? I’m going to cover first all the options, and then discuss why you’d choose one rather than the other The whole point of testing is that it is repeatable, which will normally mean automated. From the top down, here are the ways of doing it [click] - To simulate the complete end-to-end system, you’ve two ways: A user and a stop watch :-) A web-capable testing tool such as LoadRunner or Oracle Application Testing Suite, which simulates a user interacting with OBIEE dashboards or answers Maybe something clever with web services too? [click] - If you want to test from the BI Server onwards only, then you have these options: A utility that comes with OBIEE is called nqcmd. It interfaces with the BI Server using ODBC. I’m going to spend a lot of this presentation talking about it, and will come back to it shortly. You could use another ODBC-capable tool to generate the workload. [click] - Finally, you could run the SQL on the database only. This isn’t as simple as it sounds, because remember that BI Server generates the SQL. How often have you seen the SQL being run on the database and winced or had a DBA shout at you for it? BI Server is a black box when it comes to generating the SQL, all you can do is encourage it through good data modelling both in the database schema and the RPD However, if the focus of your performance testing (remember I talked about defining why you’re doing it) is more to the load testing side of things and you are you happy that there’s no big wins to be had from the BI Server but from tuning the database itself, then you could consider running the SQL directly against it. If all that will change is the execution plan then you can save yourself a lot of time by effectively cutting out OBIEE entirely and treating it purely as a database tuning exercise. Candidates for this approach would be if you were doing things like evaluating new indexes, or parallelism or compression settings. If you’re just interested in the database then its database vendor specific. For Oracle I’d consider: SQL file run through SQL*Plus from the command line (lends itself to scripting) SQL Tuning Sets, which you can feed into SQL Performance Analyzer to run on another database Oracle RAT - real application testing (which is made up of Database Replay and SQL Performance Analyser)
  • #15 nqcmd is part of the OBIEE installation on both unix and windows You can use nqcmd interactively, or from a script
  • #16 Interactively, you can use it to query the logical data model that the RPD exposes NB When you use nqcmd on unix you need to make sure you’ve set the environment variables for OBIEE first, by dot-sourcing sa-init.sh
  • #17 Using nqcmd to execute a given logical sql script is where the real power in it is Here we take a simple logical sql statement in the file test01.lsql It’s run as an input parameter to nqcmd using the s flag
  • #18  Very versatile, here’s how you can use it Unix shell scripting, or powershell on Windows Generate a set of Logical SQL files Run them sequentially (twice)
  • #19 Aim – script that encompasses the whole test – press a button, does it all Less interaction = less effort, less error Script – simulate user sleep, randomness - Automation of metric collection Run nqcmd in parallel it’s just a script, invoke it twice, three times, four times Write “user” scripts, that include random report choice and “sleeping” Script include: Random report choice Sleeping Logging to file SQL interaction, eg triggering SQL Tuning Set collection Target is - Press a button to run script and get response time numbers out
  • #21 Any questions?
  • #22 Once you’ve defined your test you need to execute it – and measure the results Here’s the ways you should consider measuring the different parts of the stack
  • #23 Once you’ve decided how much of the stack you’re going to test, you need to set about designing the test and how you’re going to capture your metrics Performance tests are all about collecting metrics that allow you to make statistically valid and quantifiable conclusions about your system. The primary metric of interest is time. What’s the end-to-end response time, from request to answer, and where’s the time in between spent? If a user complains that a report take five minutes to run but the DBA says they don’t see the query hit the database for the first two, and then it executes in 30 seconds, what’s happened to the other two and a half minutes? Other metrics of interest are the environmental statistics like CPU, memory, and IO, and diagnostic statistics such as the execution plan on the database and lower-level information like buffer gets etc. So – from the top down: [click] Web server, eg. Apache log – first log of the user request coming in App server, eg. OAS Presentation Serivces plugin, Analytics – (this is where you see the error logs when you get 500 Internal Server Error from analytics) [click] sawserver.log - by default this doesn’t record that much, but by changing the logconfig.xml file you can enable extremely detailed logging. This is useful for diagnosing lots of problems, but also if you’re looking to do an accurate profile of where the time in an Answers request is spent. You can see when it receives the user request, when it sends on the logical SQL to the bI Server, and when it receives the data back See http://rnm1978.wordpress.com/category/log/ for details [click] BI Server – spoilt for choice here. For a production environment I strongly recommend enabling Usage Tracking. For performance work you should also be using NQQuery.log where the variable levels of logging show you logical and physical SQL, BI Server execution plans, response times for each database query run, etc. [click] As well as these two features there is the systemsmanagement functionality which exposes some very detailed counters through windows PerfMon or the BI Management Pack for OEM. You can also use the jmx protocol to access the data through clients like Jconsole or jManage [click] For the database all the standard monitoring practices apply, depending on what your database is. For Oracle you should be using OEM, ASH, SQL Monitor, etc. [click] And finally, for getting a complete picture of the stack’s performance -- Speak to your users! Maybe not as empirically valid as the other components, but just as important.
  • #24 Useful when prob is suspected on DB, only place that individual physical SQL query response times are kept Database query times & row counts
  • #25 EM is good For pure testing – need to capture data : SQL Tuning Sets Good for capturing behaviour of a set of SQL over time – longest running, most IO, etc Less good for focussing on individual queries because stats are aggregated SQL Monitor – export from EM (next slide) +++++++++++++++++++++++++++++++++++ SQL Server DMVs, SQL Profiler, PerfMon counters, etc Other RDBMS – pass 
  • #26 Got to mention this – from EM you can export a standalone HTML file that renders like this brilliant
  • #27 Lots of different ways to measure decide what metrics are relevant to your testing Load testing – system metrics v. Important Perf testing indiv report – maybe just response time Plan your measurements as part of the test Trigger collection scripts automagically Include manual collection in test instructions
  • #28 Analysis step is : Collate data store in sensible way - Raw data - label your tests better to use a non-meaningful label analyse it - visualisation - analysis will depend on aim of test - eg loadtesting – identify bottlenecks
  • #29 [click] raw data, [click] compared to a previous baseline – illustrate varience [click] host metrics - IO graph [click] response time, over time
  • #33 Illustrating the data – colours! [click] Use Excel, conditional formatting is great
  • #34 Think about the data statistically, what do the number represent? Average / mean – often used, but ignores variance Percentile – more representative Standard Deviation – indication of the variance Sample quantity – statistically valid Good site: http://www.robertniles.com/stats/
  • #35 As well as metrics – record data about your tests What are you recording “Response Time” against – report? Physical SQL? etc [click] Ways to capture them For each test execution aim to record how each level relates to the next Eg lsql -> SQL IDs SQL IDs -> exec plan id Might seem constant, but could change between tests: - changing the RPD could change logical SQL – and therefore physical SQL, SQL ID, exec plan - new index wouldn’t change physical SQL or SQL ID, but exec plan might Helps with retrospective analysis Be aware how each element links to the next Useful when analysing test results, to be able to identify a SQL ID in Oracle AWR etc
  • #36 Follows on from how to capture data Something i put together to help with analysing statement performance across systems Ora_hash(query_text) common link Database tables obvious place to store raw perf test data Keeping track of logical SQL statements, often 2-3k in size, difficult Used ORA_HASH to encode Built new lookup table and new fact table Running queries on diff systems, could compare equal statements this way
  • #37 At end of analyse - options Most likely – change something and re-measure (partitioning, system config, etc) Choose what to do More tests? Indexes Config settings Etc is the test wrong? - redefine completed all tests, or reached end of timebox - review
  • #38 Summarise analysis Compare to the test aim Implementation options effort vs benefit Branch – both implement and continue testing What did tests show – summarise Have you proved anything Have you disproved anything Do you need to test some more Have you got time to test more Do you need to define a new set of tests What’s practical to implement? Return vs effort.
  • #39 Example from one of the review stages Evaluate IO profile from four different iterations Default parallelism – bottleneck at 800MB/s Output: - implement: reduce DOP - branch : look at auto-DOP in 11gR2
  • #40 Don’t forget to validate your implementation Use your perf test scripts Implement the chosen option BASELINE & test it using your perf tests Branch the code line and do more testing if you want eg us and parallelism, compression When you hit perf problems in Prod, you can use your pre-defined perf tests to assess the scope and nature of the problem
  • #41 Testing – understand more about system as you go – prob want to redefine test – that’s part of the process! Performance Testing is an iterative process. I can’t stress this enough. You will not get it right the first time you do it Whatever you do, you’ll probably miss something or invalidate your tests. Remember that an iterative approach is entirely valid, don’t feel you “got it wrong” and have to fudge the results to cover your mistake. Better to abandon a test and learn from the mistake than produce a “perfect” test that’s complete rubbish. Stick to method Benefit of also enforces justification for changes, avoid “we’ve always done it that way” don’t move the goalposts. You might find some horrible queries as you dig into them you notice some obvious “quick wins” If you rush the fix in without completing your first round of testing, you risk invalidating it BE METHODICAL!!!! Timebox the execute/measure/analyse iterations -don’t get lost in diminishing returns It’s a good idea to timebox your work, and have regular review points Test your implementation! parallel config, not tested properly after implement in test env, nearly got to prod without realising Don’t get so bogged down in the detail that you miss the wood for the trees You can end up focussing on perfecting one element of the system at the expense of all the others.
  • #42 This presentation has shown you how to run big workloads against your OBIEE system But, resist the temptation to dash off and see what happens when you run a thousand users against your system at once. It’ll be fun, but ultimately a waste of time. You have to define what you’re going to do. You need to define what the ultimate aim is. Are you proving a system performs to specific user requirements? In which case your test definition is almost written for you, you just have to fill in the gaps If you’re building a performance test for best-practice and all the good reasons I spoke about before then you need to think carefully about what you’ll test. What’s a representative sample of the system’s workload? For example: - Analyse existing usage, pick the most frequently run reports SPEAK TO YOUR USERS! Which reports do they care about? Be wary of only analysing the reports that users complain about though – you want to be colleting lots and lots of good metrics. What happens when you fix the slow reports – the old “fast” reports will now appear slow in comparison, so you want to have some baselines for them too I can’t stress this strongly enough. Cary Millsap writes excellently on the whole subject of performance. I can’t recommend highly enough his paper “Thinking Clearly About Performance”, as well as many of the articles on his blog. http://carymillsap.blogspot.com/2010/02/thinking-clearly-about-performance.html There are books and books written on how you should approach performance testing and tuning, people like Mr Millsap have built their whole careers around it. It’s way outside the scope of this, but I believe it’s essential to understand the approach to follow, otherwise all your testing can be in vain. It’s not the same as dashing off an OBIEE report that you can bin and recreate next week. Imagine designing your DW schema without good modelling knowledge – or think of ones that you’ve worked with where the person who created it didn’t understand what they were doing. The wasted time and misleading results can be potentially disastrous if you don’t get it right up front. Take my word for it – time invested up front reading and understanding will repay itself ten-fold. Preaching over.
  • #43 Questions & Discussion