Download to read offline


![OBESITY
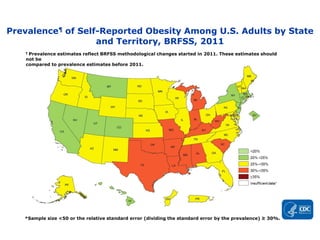
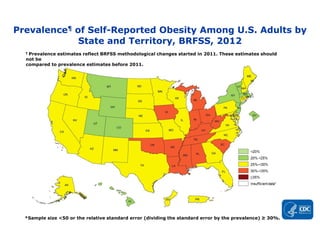
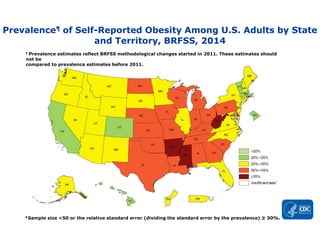
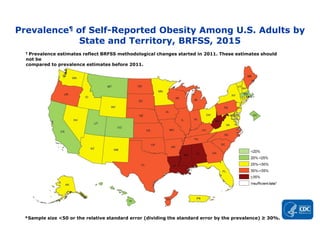
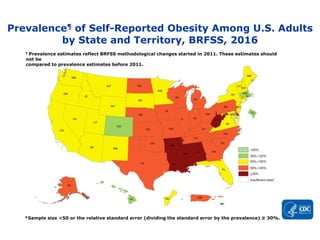
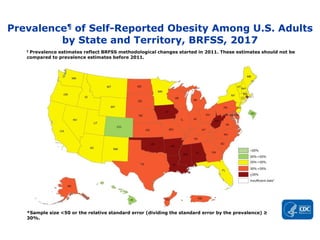
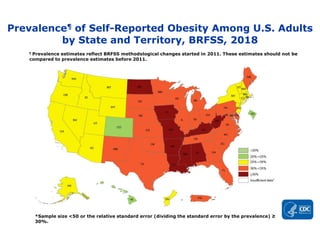
OBESITY PREVALENCE MAPS
▸Adult obesity prevalence by state and territory using self-reported information from the Behavioral
Risk Factor Surveillance System.
▸Obesity is common, serious, and costly
▸The prevalence of obesity was 39.8% and affected about 93.3 million of US adults in 2015~2016.
▸Obesity-related conditions include heart disease, stroke, type 2 diabetes and certain types of
cancer that are some of the leading causes of preventable, premature death. [Read
guidelinesExternal
]
▸The estimated annual medical cost of obesity in the United States was $147 billion in 2008 US
dollars; the medical cost for people who have obesity was $1,429 higher than those of normal
weight
CDC National Center for Health Statistics (NCHS) data briefCdc-pdf
PDF-603KB](https://image.slidesharecdn.com/mansilla-obesidad-191017185601/85/Obesity-6-320.jpg)


![TEXT
BEHAVIOR THERAPY
▸Cognitive restructuring: cognitive behavioral therapy],
motivational interviewing](https://image.slidesharecdn.com/mansilla-obesidad-191017185601/85/Obesity-40-320.jpg)


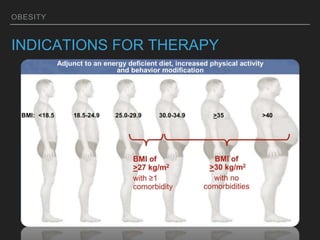


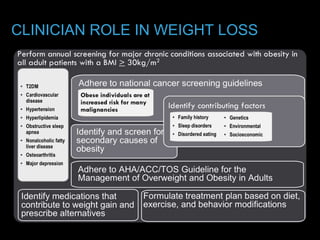
This document discusses obesity, including its definitions, classifications, prevalence, physiology, and management. It provides guidelines for clinicians on their role in weight loss, including counseling strategies to promote behavior change. New guidelines for obesity management are presented, along with selecting appropriate medications based on a patient's comorbidities. Surgical and non-surgical procedures for obesity are outlined, along with expected weight loss and vitamin deficiencies. The role of nutrition, physical activity, behavior therapy, and medical therapy in obesity treatment is also examined.