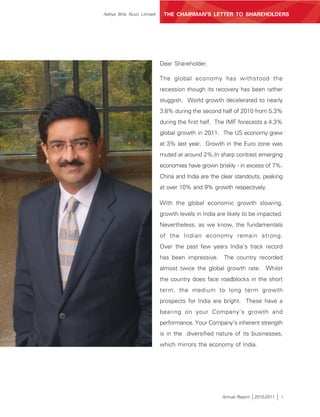
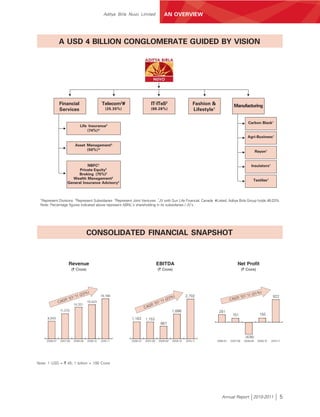
Your Company achieved its highest ever revenue of US $4 billion, EBITDA of US $600 million, and net profit of US $183 million led by strong performance across all businesses; the outlook remains positive given the Company's strong fundamentals and leadership position in key sectors which will enable it to leverage its conglomerate structure and scale to the next level of growth.


![MANAGEMENT’S DISCUSSION AND ANALYSIS
MANAGEMENT DISCUSSION AND ANALYSIS Aditya Birla Nuvo Limited
Aditya Birla Financial Services is well the capping of difference between gross yield
MANAGEMENT DISCUSSION AND ANALYSIS
positioned to tap the immense growth opportunity and net yield, capping of surrender charges,
offered by the Indian financial services sector. increasing minimum lock in period and minimum
premium payment term from three years to five
Life Insurance (Birla Sun Life Insurance years, even distribution of charges over lock-in
Company Limited) period, etc. IRDA also issued distribution related
Industry Overview regulations through tightening of licensing norms
The Indian Life Insurance industry currently for corporate agency and prescribing minimum
comprises 22 private life insurers and one public persistency requirements for individual life
sector insurer – Life Insurance Corporation of India insurance agents.
("LIC"). Indian life insurance industry garnered new While the life insurance industry experienced
business premium1 of ` 69,819 Crore (about USD strong growth before new guidelines became
15.5 billion) during 2010-11. LIC contributed to 59% effective, it witnessed a sharp reduction in new
of industry's new business while private business premium post September 2010. This was
life insurers contributed remaining 41% primarily on account of:
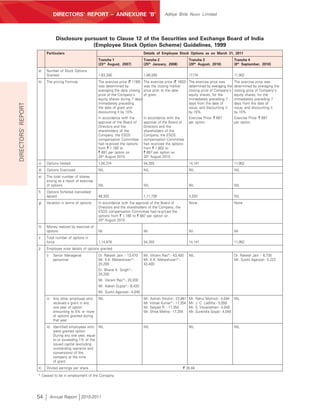
[Source: IRDA, www.irda.gov.in]. Top 7 out of 22
private players contributed about 75% of the • Withdrawal of all previous ULIPs by life
insurers to comply with the new regulatory
private sector’s new business and 31% of
framework and transitioning to new ULIPs.
industry’s new business. The top 7 private life Notably, the guidelines were not only
insurers and LIC combined together, accounted unprecedented but were implemented in a
for 90% of industry’s new business. short time frame.
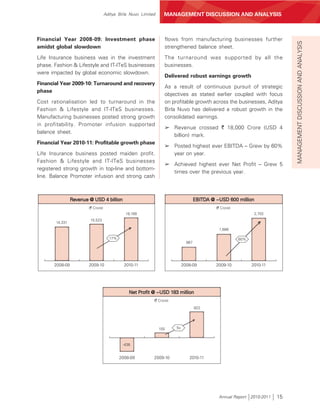
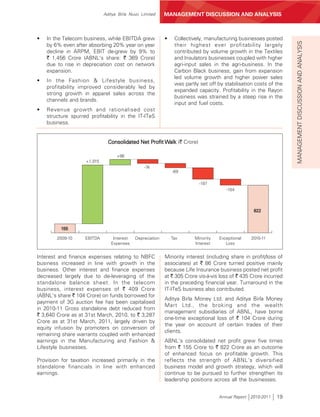
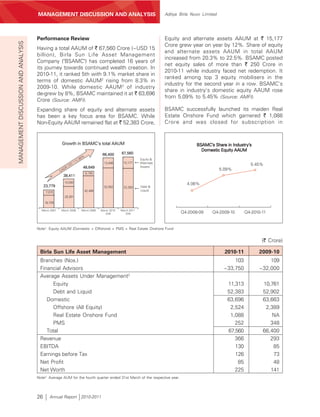
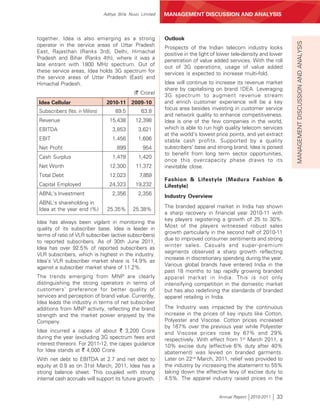
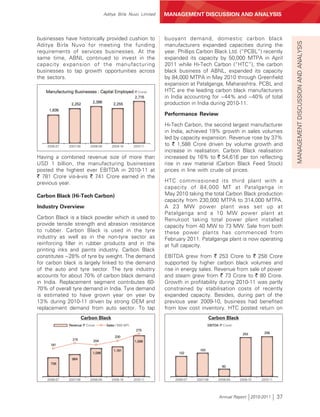
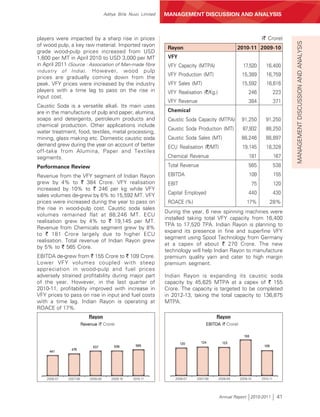
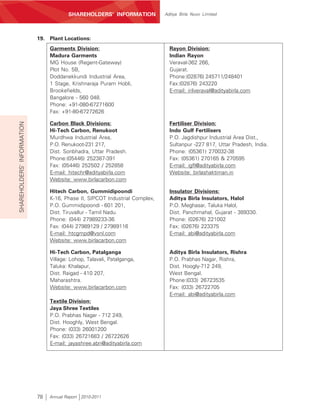
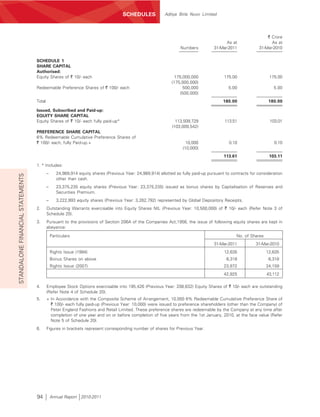
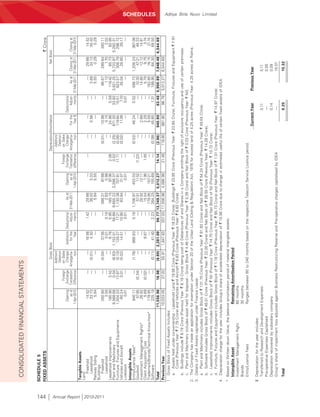
Private life insurers market share in terms of new business1 • Rationalisation of distributors’ compensation
in line with ULIP guidelines.
Others ICICI Prudential
24.6% 20.5% • Sales mix of several players shifting in the
favour of Non-ULIPs.
SBI Life
13.2%
• Several players shifting towards single
Max
premium. Hence, the industry had reported
New York relatively higher de-growth on the basis of
6.2%
weighted new business premium.
Birla Sun Life
HDFC Standard
7.0% Reliance Life Bajaj Allianz 11.9% The new ULIP regulations brought a paradigm
8.2% 8.4%
shift across the life insurance sector. Industry is
moving towards a more balanced product mix
Having more than 11,500 branches and thereby increasing share of traditional plans. Other
approximately 2.7 million agents, the life insurance shifts include increased focus on cost
industry witnessed major regulatory changes rationalisation, productivity metrics and
during 2010-11. The Insurance Regulatory and profitability. Several of the top private life insurers
Development Authority ("IRDA") issued new have reported statutory profits in 2010-11. Rising
guidelines for Unit Linked Insurance Products in-force business, better expense efficiency and
(ULIP) effective from 1st September 2010. The a better product mix has led to profits.
major provisions in the new guidelines included
Indian Life Insurance Industry: Growth in New business1
(` Crore)
April 2010 to y-o-y September 2010 y-o-y April 2010 to y-o-y
August 2010 growth (%) to March 2011 growth (%) March 2011 growth (%)
Private Life Insurers 11,369 21% 17,464 -32% 28,832 -17%
LIC 18,566 19% 22,420 -29% 40,986 -13%
Life Insurance Industry 29,935 20% 39,884 -30% 69,819 -15%
Note1: Weighted new business premium = 100% of regular first year premium + 10% of single premium. [Source: IRDA, www.irda.gov.in].
22 Annual Report 2010-2011](https://image.slidesharecdn.com/nuvoannualreport2010-11-120524060613-phpapp02/85/Nuvo-annual-report_2010-11-40-320.jpg)
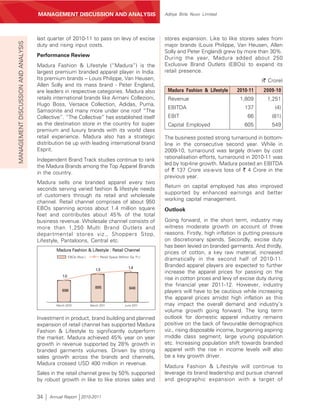
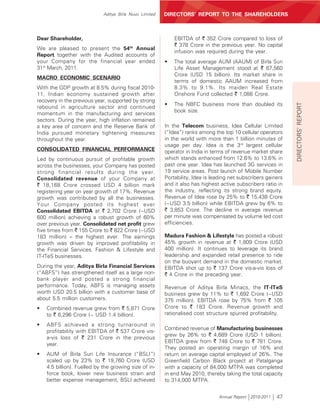
![Aditya Birla Nuvo Limited MANAGEMENT DISCUSSION AND ANALYSIS
Though ULIP sales were affected across the Driven by strong persistency, the renewal
MANAGEMENT DISCUSSION AND ANALYSIS
industry post new guidelines, these changes are premium of BSLI surged by 41% to ` 3,597 Crore.
expected to have a positive impact on the industry The total premium income grew by 3% to ` 5,677
in the long run, in terms of quality of business, Crore. AUM rose by 23% to ` 19,760 Crore (about
long-term orientation, efficiencies in distribution, USD 4.4 billion). As a life insurer with a long-
operations and customer service, etc. established track record, a significant portion of
BSLI's business (about 95%) is on regular
Performance Review
premium basis, which drives a regular stream of
Birla Sun Life Insurance ("BSLI") completed its renewal premiums. The 13th month persistency
11th year of successful operations amidst at 83% signifies customer stickiness and is one
challenging environment. BSLI ranked among top of the best in the industry.
6 private life insurers in India during 2010-11 with
a market share of 7% in terms of new business Various cost rationalisation initiatives were
[Source: IRDA, www.irda.gov.in]. BSLI covers about undertaken during the year. As a result, BSLI
2.4 million lives and sell about 2 policies every achieved savings of more than ` 120 Crore in
minute, through a strong nationwide distribution operating expenses. The operating expenses to
reach of 600 branches, about 150,000 direct gross premium ratio improved from 24.1% in
selling agents, 5 bancassurance partners and more 2009-10 to 21.2% in 2010-11. Commission ratio
than 225 corporate agents and brokers. reduced from 9.4% in 2009-10 to 6.7% in 2010-11.
In 2010-11, new business premium income of BSLI Driven by growing in-force book, balanced product
at ` 2,080 Crore de-grew year on year by 30%. mix, lower new business strain and better
ULIP sales were impacted across the industry expense management, BSLI posted its maiden
post-new guidelines, which became effective from profit in 2010-11. It posted earnings before tax at
1st September, 2010. However, non-ULIP sales ` 304 Crore vis-à-vis loss of ` 435 Crore in the
gained traction. For BSLI, non-ULIPs contributed preceding year. No capital infusion was required
25% of its individual new business vis-à-vis 1% during 2010-11.
in the previous year.
(` Crore)
Birla Sun Life Insurance 2010-11 2009-10
Branches (Nos.) 600 632
Direct Selling Agents ~150,000 ~170,000
Assets Under Management ("AUM") 19,760 16,130
Individual First Year Premium 1,644 2,288
Group First Year Premium 436 672
First Year Premium 2,080 2,960
Renewal Premium 3,597 2,546
Premium Income (Gross) 5,677 5,506
Less: Reinsurance Ceded and Service Tax (166) (213)
Premium Income (Net) 5,511 5,293
Other Operating Income 23 16
Revenue 5,534 5,309
EBITDA 352 (378)
Earnings before Tax 304 (435)
Net Profit/(Loss) 305 (435)
Capital 2,450 2,450
ABNL's Investment 1,814 1,814
Annual Report 2010-2011 23](https://image.slidesharecdn.com/nuvoannualreport2010-11-120524060613-phpapp02/85/Nuvo-annual-report_2010-11-41-320.jpg)
![Aditya Birla Nuvo Limited MANAGEMENT DISCUSSION AND ANALYSIS
distinction of attaining 'zero per cent' claims about ` 700,500 Crore (~USD 156 billion) in
MANAGEMENT DISCUSSION AND ANALYSIS
outstanding ratio for the second year, meaning, 2010-11. Liquidity pressure led to decline in liquid
100% of all the claims intimated during the year assets across the industry. After facing net
have been processed. This is a live example of its redemption in liquid schemes during the first nine
'Customer First' approach and clearly speaks of months, industry witnessed inflows during the
the strong system and processes it has set in. fourth quarter.
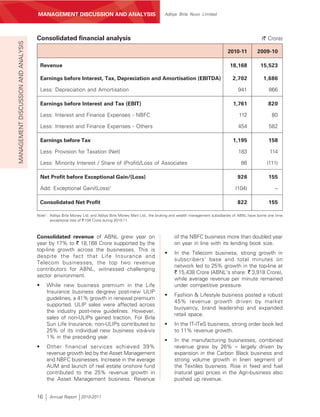
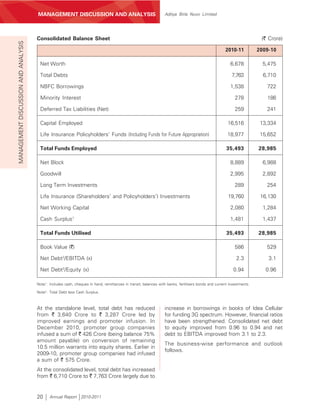
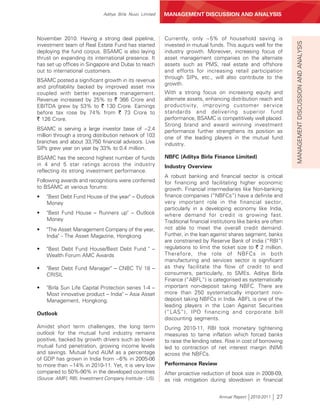
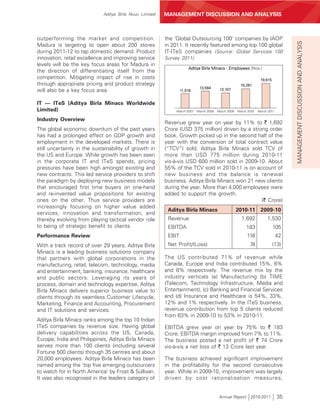
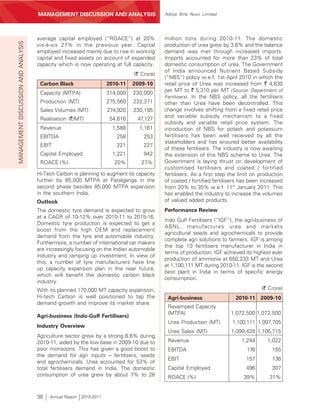
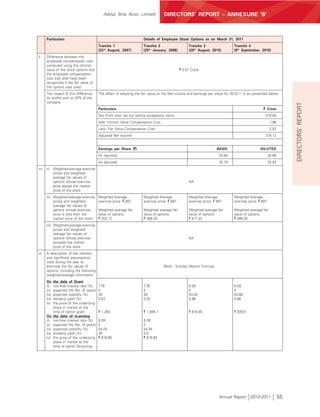
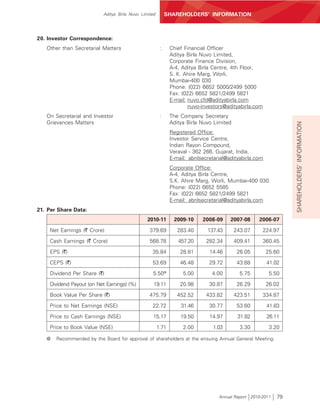
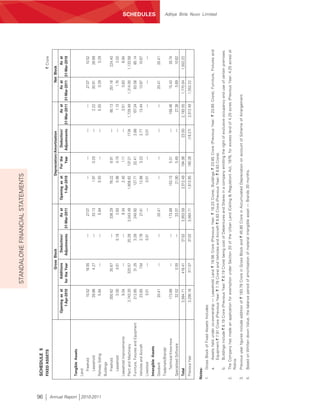
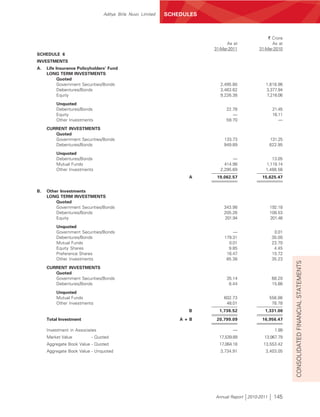
Outlook Top 5 of 43 assets management companies
The financial year 2010-11 was challenging for the contribute to 56% of industry’s AAUM.
life insurance industry. However, the long term
growth potential of the life insurance sector Market Share in terms of quarterly average AUM
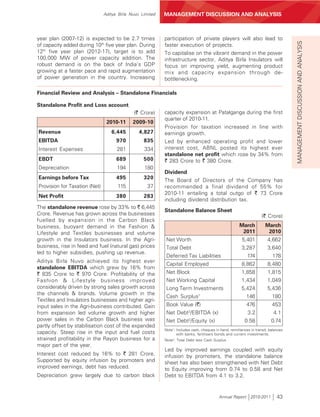
(Q4FY11)
remains strong on the back of favorable Reliance
demographics such as high economic growth, 14.5%
rising income levels and domestic savings, HDFC
12.3%
increasing mind-share of life insurance within the
Others
financial savings component, etc. The total 44.0%
penetration of insurance (denoted by premium as
percentage of GDP) has increased from 2.3% in ICICI
2001 to 4.4% in 2010. The level of penetration, UTI
10.5%
particularly in life insurance, tends to rise as the Birla Sun Life 9.6%
9.1%
income levels increase. Rising awareness towards
the need of life insurance is also a key enabler. In
addition to this, the recent regulatory changes, Industry's equity AAUM1 almost remained flat at
viz., capping of charges, etc., have only made about ` 207,800 Crore (~USD 46 billion). During
ULIPs more cost competitive for the customers. the first half of 2010-11, profit booking led to net
Tightening of regulations has forced and will redemption in equity funds to the tune of about
continue to drive life insurers towards better ` 15,250 Crore. However, during the second half
expense management, writing long term quality year, Industry witnessed net inflows in equity
business, enhancing standards of customer schemes. Share of equity AAUM in total industry
retention and service. AAUM increased from 28% to 30%. Debt and
liquid assets continue to contribute majority
With a strong focus on improving persistency, proportion of total industry's AAUM dominated
expanding in-force book, driving cost efficiencies, by treasury investments of banks and corporates.
superior investment performance and customer Share of retail assets in total industry's AAUM
service, BSLI is well positioned to meet the increased from ~38% to ~44% supported by
challenges and also tap into the opportunities of market action in equity assets and outflow of
the life insurance industry. It is expected to liquid assets in institutional segment. [Source:
emerge stronger on the back of its wide Association of Mutual Funds in India ("AMFI"),
distribution franchisee, a successful multi-channel www.amfiindia.com]. Meanwhile, the Reserve Bank
strategy, experienced team, a proven track record of India ("RBI") has instructed banks to limit their
in product innovation, superior investment investments in liquid mutual fund schemes up to
performance and a strong brand name. 10% of their net worth as on 31st March of the
previous year. This may put pressure on funds in
Asset Management (Birla Sun Life Asset the liquid category. In the direction of reducing
Management Company Limited) dependence on inflows from foreign institutional
investors ("FIIs"), Finance Ministry has recently
Industry Overview
allowed foreign individuals to invest up to USD
The Indian mutual fund industry currently 10 billion in domestic mutual funds. The Securities
comprises 43 asset management companies. and Exchange Board of India ("SEBI") has notified
After continuous growth for the last few years, the rules vide Circular CIR/IMD/DF/14/2011dated
the industry registered a marginal decline in the 9th August 2011. At present, besides resident
average AUM ("AAUM") during 2010-11. The Indians, only FIIs, sub-accounts registered with
AAUM1 of the industry de-grew by 8% from about SEBI and non-resident Indians, can invest in
` 763,200 Crore (~USD 170 billion) in 2009-10 to mutual funds in India.
Note1: Average AUM for the fourth quarter ended 31st March of the respective year.
Annual Report 2010-2011 25](https://image.slidesharecdn.com/nuvoannualreport2010-11-120524060613-phpapp02/85/Nuvo-annual-report_2010-11-43-320.jpg)
![Aditya Birla Nuvo Limited MANAGEMENT DISCUSSION AND ANALYSIS
c) Credit Analysis & Research Ltd. – a leading a compounded annual growth rate of ~16% over
MANAGEMENT DISCUSSION AND ANALYSIS
credit rating agency, and a period of past five years (2005-06 to 2010-11).
Indian cash market and derivatives market have
d) GEI Industrial Systems - a leader in heat grown at a CAGR of ~14% and ~43% in the past
transfer technology for more than 40 years. five years. Commodity volumes have surged at a
CAGR of ~41% during-past five years. [Source:
The fund has a strong pipeline of deals to deploy Bombay Stock Exchange Ltd. (“BSE”), National Stock
the balance of the fund corpus. Exchange of India Ltd. (“NSE”), Multi Commodity
Exchange of India Ltd. (“MCX”), National Commodity
ABPE has recently launched its second domestic & Derivatives Exchange Ltd. (“NCDEX”)]. However,
fund called “Sunrise Fund”. The fund aims at during 2010-11, Indian equity markets witnessed
investing in companies engaged in emerging a volatile equity markets.
sectors, viz., Lifestyle, Lifeskills and Education,
Lifecare and Applied Technologies. ABPE is Sensex, the benchmark index of BSE and S&P
targeting the Sunrise fund’s first closing for CNX Nifty, the benchmark index of NSE, both
subscription in August 2011. rose by 11% during 2010-11 after witnessing more
than 70% rise in 2009-10. During the year, the
Aditya Birla Capital Advisors Private Limited cash segment volumes of BSE de-grew by 20%
(“ABCAP”) provides the investment management to ~USD 245 billion. The cash segment volumes
and advisory services to Aditya Birla Private Equity of NSE de-grew by 14% to ~USD 795 billion;
Trust, a venture capital fund registered with SEBI. however, Futures & Options volumes grew by
During 2010-11, ABCAP posted revenue of ` 18 66% to ~USD 6.5 trillion marking a significant
Crore and net profit of ` 4 Crore. shift towards Futures & Options (“F&O”)
segment. F&O segment accounted for 86% of
Outlook total equity volumes at NSE and BSE combined
vis-à-vis 76% in 2009-10. Due to increasing
There is a huge opportunity in the private equity contribution of lower margin F&O segment in total
space in India driven by long term growth potential pie, earnings of retail brokerage houses have
of Indian industry, rising disposable income and impacted during the year. The combined
growing participation of high net-worth individuals commodities volumes at MCX and NCDEX rose
(“HNIs”), mature and liquid financial markets by 54% to ~USD 2.5 trillion.
coupled with conducive government policies for
private investment. Private equity investments in Performance Review
India has already touched a whopping USD 6
Aditya Birla Money (“ABML”) witnessed growth
billion in the first six months of the calendar year
in commodity volumes while cash market volumes
2011.
were affected across the Industry. Cash market
Aditya Birla Private Equity is well positioned to volumes of ABML de-grew by 34% while
tap this opportunity backed by strong investment commodity volumes rose by 82%. F&O volumes
management team and salient parentage brand of ABML soared by 96%. F&O volumes
of Aditya Birla Group. accounted for 86% of total equity volumes of
ABML.
Broking (Aditya Birla Money Limited) During the first half of 2010-11, ABML’s revenue
posted 23% year on year growth. Revenue
Industry Overview
growth was impacted in the second half of the
The Indian retail broking industry is highly financial year due to discontinuance of a product.
competitive and fragmented comprising of several On a full year basis, revenue remained flat at
broking players with the top ten players ` 114 Crore vis-à-vis ` 113 Crore earned in
contributing to only ~25% of equity broking 2009-10. EBITDA de-grew from ` 27 Crore to ` 5
market size. The number of demat accounts in Crore due to investment in people and
the country shows the depth of equity infrastructure for supporting the future growth.
penetration. Central Depository Services Ltd. and ABML borne one-time exceptional loss of ` 8
National Securities Depository Ltd. together have Crore during the second quarter of 2010-11 on
about 19 million active demat accounts, registering account of certain trades of its clients. ABML
Annual Report 2010-2011 29](https://image.slidesharecdn.com/nuvoannualreport2010-11-120524060613-phpapp02/85/Nuvo-annual-report_2010-11-47-320.jpg)
![MANAGEMENT’S DISCUSSION AND ANALYSIS
MANAGEMENT DISCUSSION AND ANALYSIS Aditya Birla Nuvo Limited
posted a net loss of ` 0.3 Crore (before one-time capped the charges w.e.f. 1st September, 2010
MANAGEMENT DISCUSSION AND ANALYSIS
exceptional loss) compared to net profit of ` 13 to rationalise the ULIPs cost structure. To comply
Crore attained in the preceding year. with the guidelines, life insurance companies
issued new products with reduced first year
During the year, the number of customers commission paid to corporate agents and brokers
increased by 13% to about 260,000. ABML
on sale of ULIPs. As a result, ULIP sales were
expanded its reach to 219 branches and more impacted across the industry. During 2010-11, non-
than 750 franchisees. It has set up a dedicated equity gross sales of mutual fund industry de-
research team to help its clients in making well
grew by 12% while equity gross sales grew by
informed decisions. 7%. Equity cash broking volumes also de-grew
Outlook during the year. The margins of the mutual fund
and life insurance distribution players have
Currently, only ~2% of Indian population holds remained under severe pressure since past two
demat accounts. Share of equity in household years. Distribution players are revamping their
financial savings in India at 9% is much lower business model by shifting from transaction-based
compared to more than 30% in countries like business model to advisory-based business
China, Korea, US and UK. This, under penetration, model. They are also focusing on expanding the
offers a huge growth opportunity for the retail basket of services by adding new offerings, viz.,
broking sector in India, given the fundamentally structured products, private equity, real estate,
strong growth prospects of Indian equity markets. etc.
However, equity markets may remain volatile in
short term, due to high inflationary pressure and Performance Review
likely further increase in interest rates.
To mitigate the impact of these regulatory changes
Going forward, ABML will focus on filling gaps in on earnings and to increase its customer base,
its geographical presence by expanding its ABMM diversified its offerings and product
franchisee network, mainly in the northern and, portfolio. The new product offerings include
the western regions. Its emphasis will be on investment solutions such as private equity funds,
expanding its business through a cost-effective Gold SIP, alternative investments, structured
business partner-based model. It will lay thrust products, real estate services, etc.
on increasing its client base with a focus on
This has helped ABMM to enhance its revenue
customer segmentation. Cost rationalisation will
from ` 63 Crore to ` 73 Crore amidst de-growth
also be a key focus area for ABML.
in industry volumes across mutual fund, life
insurance as well as equity broking sectors.
Wealth Management and Distribution (Aditya
However, bottom-line was strained due to
Birla Money Mart Limited)
business building costs, viz., investment in the
Industry Overview people, process and technology – related
infrastructure. Besides, reduction in commission
While there are a few large wealth management post-new ULIP guidelines also impacted. ABMM
players in India; mutual fund distribution market borne one-time exceptional loss of ` 96 Crore
is very fragmented with top 40 distributors during the second quarter of 2010-11 on account
contributing to only ~35% of the industry AUM. of certain trades of its clients. ABMM posted a
Aditya Birla Money Mart (“ABMM”) is the third net loss of ` 19 Crore (before one-time exceptional
largest corporate distributor of mutual funds in loss) compared to the net loss of ` 12 Crore
India in terms of Assets under Advisory at incurred in the preceding year.
~ ` 139 billion as on 31st March, 2011 [Source:
Karvy and Computer Age Management Services ABMM is playing an important role in distribution
(“CAMS”)]. ABMM is also a significant player in of financial products of Aditya Birla financial
the wealth management space. services businesses. ABMM is the largest
corporate agent for Birla Sun Life Insurance, the
During the previous financial year 2009-10, SEBI largest mutual fund distributor for Birla Sun Life
abolished payment of entry load on all mutual Asset Management, largest distributor of Aditya
fund schemes w.e.f. 1st August, 2009. Further in Birla Private Equity and the largest sourcing agent
2010-11, IRDA through new ULIP guidelines for capital market lending of Aditya Birla Finance.
30 Annual Report 2010-2011](https://image.slidesharecdn.com/nuvoannualreport2010-11-120524060613-phpapp02/85/Nuvo-annual-report_2010-11-48-320.jpg)
![Aditya Birla Nuvo Limited MANAGEMENT DISCUSSION AND ANALYSIS
ABMM has a strong nation-wide distribution this segment while competing with banks and
MANAGEMENT DISCUSSION AND ANALYSIS
presence through 37 branches and ~14,500 other corporate agents. ABIBL will focus on
channel partners serving about 290,000 reaching a larger customer base in a cost effective
customers. way to grow the business.
Outlook Telecom (Idea Cellular Limited)
High savings growth in India implies a huge Industry Overview
opportunity for financial intermediation services.
The long term fundamental growth for the During the past two years, the number of cellular
manufacturing and distribution of life insurance, operators in India has increased to 15. The
mutual funds and equity broking products and consequent over-capacity and hyper-competition
services remains strong. Besides, increasing led to tariff war amongst the operators to grab
preference towards investment with the help of market share. Increasing multi-SIM phenomenon
professional advisors portrays a positive outlook and reduction in tariff slowed down the revenue
for the wealth management sector in the longer growth of the Indian telecom wireless sector
run. while registering a strong growth in subscribers’
additions. Wireless subscribers’ base grew year
ABMM’s thrust will be to provide quality wealth on year by 49% to reach 584 million as on 31st
management solutions to its client through March, 2010 and by 39% to reach 812 million as
product innovation and technology support. It will on 31st March, 2011. On the other hand, gross
also focus on diversification of its product portfolio revenue of Indian wireless sector grew by 5% to
besides deriving synergies with other Aditya Birla reach USD 23.8 billion in 2009-10 and by 12% to
Financial Services verticals. ABMM is ideally reach USD 26.6 billion in 2010-11. [Source: Telecom
equipped to progress in the challenging business Regulatory Authority of India (“TRAI”), www.trai.gov.in]
environment as a multi-product and multi-channel
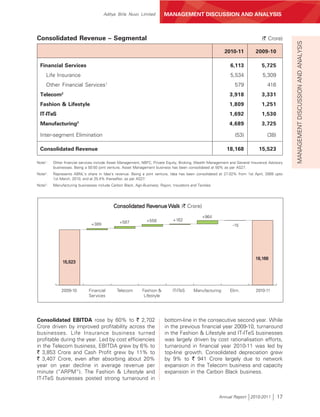
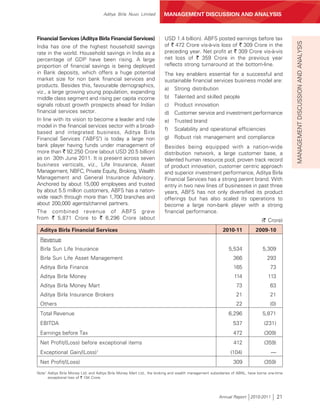
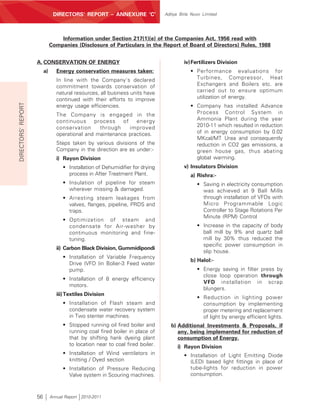
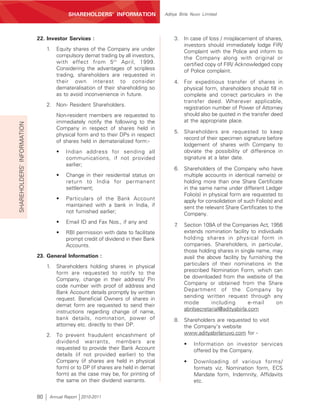
distributor with a realigned business model. Top 3 cellular operators contribute to ~65% of
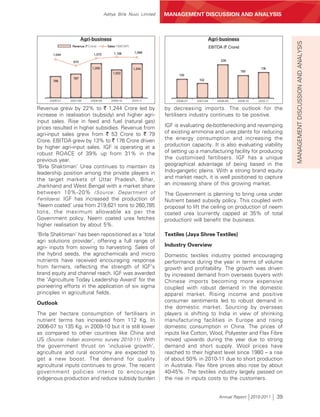
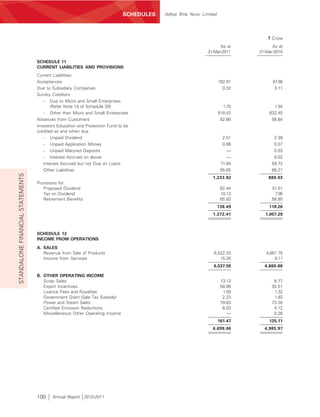
total gross revenue of Indian wireless sector.
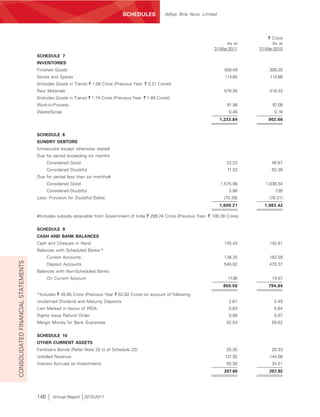
General Insurance Advisory (Aditya Birla
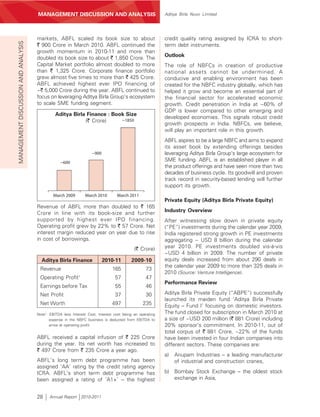
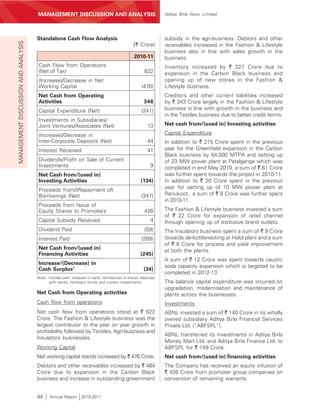
Insurance Brokers Limited) Indian Wireless Sector: Revenue Market Share1
Industry Overview
BSNL Aircel Others
(incl. MTNL) 4.6% 3.4% Airtel
The general insurance industry grew year on year 8.5% 30.1%
by 22% to USD 9.5 billion in terms of premium Tata
8.6%
underwritten. Aditya Birla Insurance Brokers Ltd.
(ABIBL), erstwhile Birla Insurance Advisory and
Broking Services Ltd., is one of the leading general Reliance
9.8%
insurance brokers in India.
Idea Vodafone
Performance Review 13.6% 21.4%
The premium placement by ABIBL marginally
de-grew from ` 214 Crore to ` 205 Crore. Revenue The financial year 2010-11 was very eventful for
remained flat at ` 21 Crore. Net Profit de-grew Indian telecom industry. In April 2010, auctions
from ` 4 Crore to ` 2 Crore due to increase in for third generation (3G) spectrum commenced
manpower and other operating costs. and ended in May 2010 after 34 days of intense
bidding. Against reserve price of
Outlook ` 3,500 Crore for pan India 3G license, winning
price was ` 16,751 Crore. Metro cities like
Lower general insurance penetration in India is Mumbai and Delhi witnessed most aggressive
likely to boost growth of general insurance bidding. Broadband Wireless Access (“BWA”)
industry. Lower share of brokers in the auctions were also concluded in June 2010.
mobilisation provides an opportunity to grow in Mobile Number Portability (“MNP”) was initiated
Note1: Based on gross revenue for UAS & Mobile licences only, for March 2011 quarter as released by TRAI.
Annual Report 2010-2011 31](https://image.slidesharecdn.com/nuvoannualreport2010-11-120524060613-phpapp02/85/Nuvo-annual-report_2010-11-49-320.jpg)
![MANAGEMENT’S DISCUSSION AND ANALYSIS
MANAGEMENT DISCUSSION AND ANALYSIS Aditya Birla Nuvo Limited
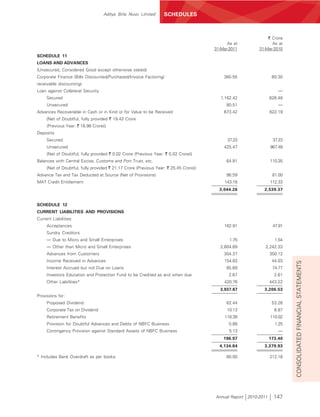
Outlook largest manufacturer of insulators. Aditya Birla
MANAGEMENT DISCUSSION AND ANALYSIS
Insulators achieved its highest ever volumes led
Outlook for VFY business seems to remain stable
by capacity expansion in the second quarter of
with demand growth expected to be moderate.
the previous financial year and improved yield.
Demand for caustic soda is expected to grow
Sales volume grew by 20% to 44,281 MT.
with expansion planned in user segments.
Domestic sales volume grew by 21% while
With the planned VFY capacity expansion, Indian exports grew by 10%. Realisation in the
Rayon is focusing on technology up-gradation to substation segment remained under pressure due
improve product quality and enhance product to overcapacity while realisation in transmission
range. This will help to cater to premium segment increased in line with rise in input and
segments and to improve realisation. Enhanced fuel costs. Revenue grew year on year by 21%
product range and improvement in quality will to ` 518 Crore.
also help to broaden customer’s base. With the
(` Crore)
planned caustic soda capacity expansion, Indian
Rayon is well positioned to tap growth in caustic Insulators 2010-11 2009-10
soda demand.
Capacity (MTPA) 45,260 45,260
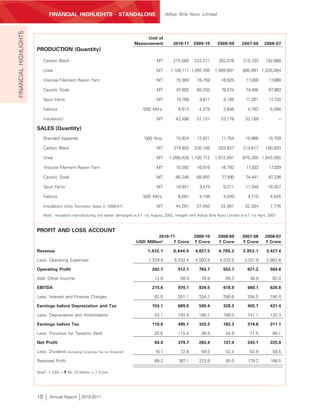
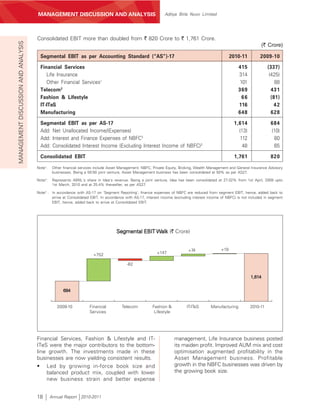
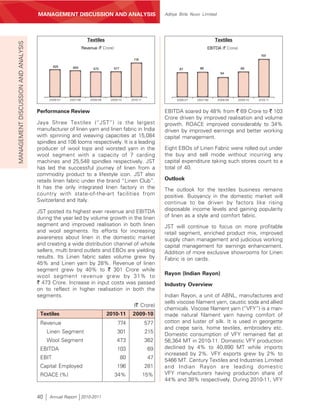
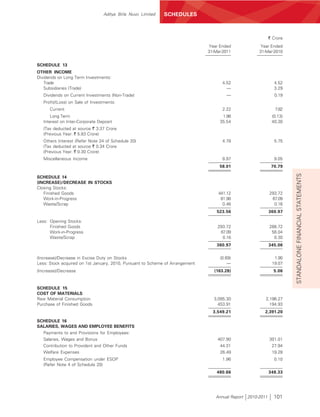
Insulators (Aditya Birla Insulators) Production (MT) 43,498 37,151
Industry Overview Sales Volumes (MT) 44,281 37,050
Insulators are used in power generation, Revenue 518 428
transmission and distribution and by original EBITDA 135 116
equipment manufacturers. The growth of
EBIT 114 98
insulators industry is linked to the growth of the
power sector. The power sector added about Capital Employed 363 294
12,000 MW of generation capacity in 2010-11. ROACE (%) 35% 35%
This is 56% of the targeted capacity addition in
2010-11 and 27% higher than capacity added in EBITDA rose by 17% from ` 116 Crore to ` 135
the previous year. The power sector also added Crore. Higher volumes and improved yield was
about 15,000 circuit kms of transmission line. partly set off by increase in input and fuel costs.
This is 82% of the targeted addition and more Aditya Birla Insulators is operating at a robust
than three times of lines added in the previous ROACE of 35%.
year [Source: Central Electricity Authority (“CEA”),
www.cea.nic.in] . Domestic insulators Industry Aditya Birla Insulators is planning to expand
faced pressure on realisation particularly in the its capacity by 2,000 MW through
substation segment due to increased de-bottlenecking at a cost of ` 19 Crore at
competition. Industry also witnessed delay in Halol Plant.
execution of projects. Outlook
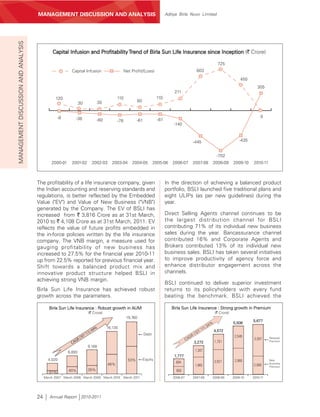
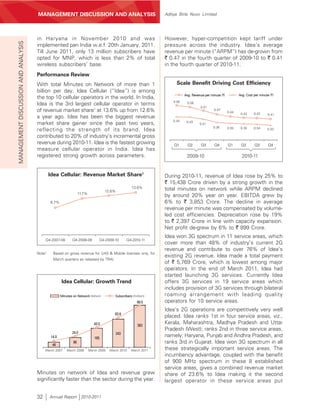
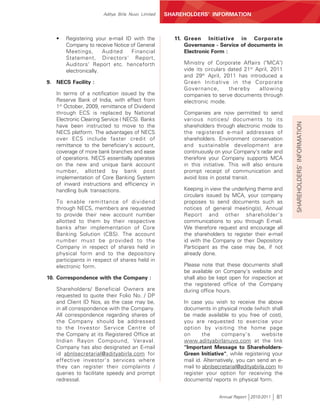
Performance Review
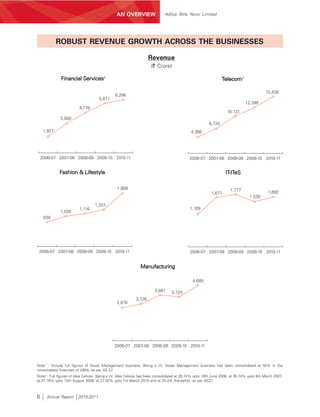
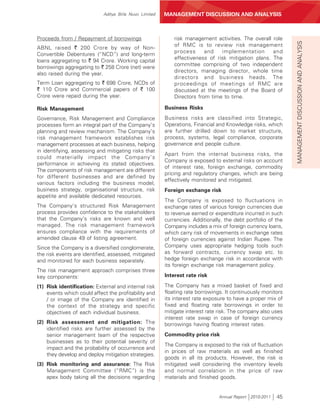
Per capita consumption of electricity is 700 Kwh
Aditya Birla Insulators, the insulators business of which is about one-fourth of the global average.
the Company, is India’s largest and world’s fourth Power generation capacity addition in 11th five
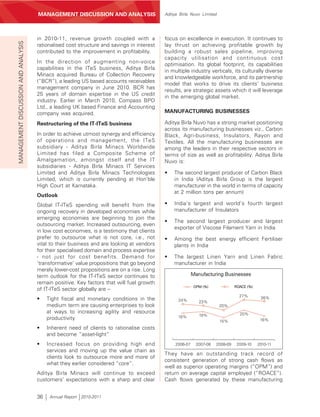
Insulators Insulators
Revenue (` Crore) Sales Volumes (MT)
EBITDA (` Crore)
44,281
37,050
32,304 32,561
518 136 135
123
425 428 116
22,967
399
54
241
2006-07 2007-08 2008-09 2009-10 2010-11 2006-07 2007-08 2008-09 2009-10 2010-11
42 Annual Report 2010-2011](https://image.slidesharecdn.com/nuvoannualreport2010-11-120524060613-phpapp02/85/Nuvo-annual-report_2010-11-60-320.jpg)
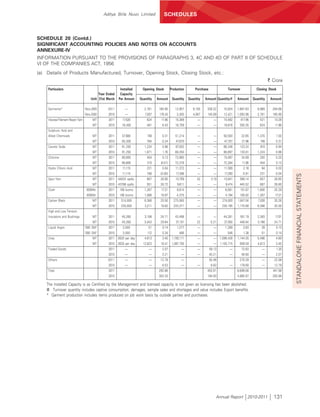
![Aditya Birla Nuvo Limited SCHEDULES
` Crore
SCHEDULE 2
RESERVES AND SURPLUS
Opening as at Deductions/ Balance as at
1-Apr-2010 Additions Adjustments 31-Mar-2011
Capital Reserve 262.69 3.93 — 266.62
Capital Redemption Reserve 8.46 — 8.46
Debenture Redemption Reserve 69.47 46.11 — 115.58
Securities Premium Account 1,928.14 557.75 — 2,485.89
General Reserve 2,108.31 250.00 — 2,358.31
Investment Reserve 19.95 — — 19.95
Surplus as per Profit and Loss Account 17.18 11.01 — 28.19
4,414.20 868.80 — 5,283.00
Previous Year + 3,647.22 1,026.32 259.34 4,414.20
+ Deduction/Adjustment for previous year includes ` 259.33 Crore due to Scheme of Arrangement.
` Crore
STANDALONE FINANCIAL STATEMENTS
As at As at
31-Mar-2011 31-Mar-2010
SCHEDULE 3
SECURED LOANS
Non-Convertible Debentures — 110.00
Loans from Banks 1,048.71 1,606.52
Other Loans:
Deferred Sales Tax Loan 70.71 78.99
Others 261.19 279.34
Refer Note 6 of Schedule 20 1,380.61 2,074.85
SCHEDULE 4
UNSECURED LOANS
Fixed Deposits — 0.82
Short Term Loans From: *
Banks 851.85 657.18
Commercial Paper — 96.90
[Maximum balance outstanding during the year ` 385.00 Crore
(Previous Year: ` 1,000.00 Crore)]
Other Loans From:
Banks 264.74 220.27
Non-Convertible Debentures* 790.00 590.00
Refer Note 6 of Schedule 20 1,906.59 1,565.17
* Includes amounts repayable within one year 1,241.85 804.89
Annual Report 2010-2011 95](https://image.slidesharecdn.com/nuvoannualreport2010-11-120524060613-phpapp02/85/Nuvo-annual-report_2010-11-113-320.jpg)
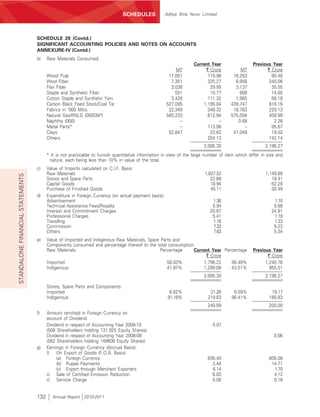
![Aditya Birla Nuvo Limited SCHEDULES
` Crore
As at As at
Face Value Number 31-Mar-2011 Number 31-Mar-2010
SCHEDULE 6
INVESTMENTS
LONG TERM INVESTMENTS
Government Securities
National Saving Certificates (Unquoted) — ß — ß
Trade Investments
QUOTED
Equity Shares:
Hindalco Industries Limited 1 33,506,337 201.48 33,506,337 201.48
IDEA Cellular Limited 10 837,526,221 2,355.81 837,526,221 2,355.81
UNQUOTED
Equity Shares:
Birla Securities Limited 10 495,800 ß 495,800 ß
[Net of provision in diminution in value of
` 2.52 Crore (Previous Year: ` 2.52 Crore)]
Aditya Birla Science & Technology Limited 10 2,400,000 2.40 2,400,000 2.40
STANDALONE FINANCIAL STATEMENTS
Birla Management Centre Services Limited 10 7,000 ß 7,000 ß
Aditya Birla Port Limited 10 100,000 0.10
Preference Shares:
3.50% Cumulative Redeemable Preference
Shares of Aditya Birla Health Services Limited # 100 1,500,000 15.00 1,500,000 15.00
8.0% Preference Shares of Birla Management
Centre Services Limited 10 200 ß 200 ß
Investment in Subsidiary Companies:
UNQUOTED
Equity Shares:
Aditya Vikram Global Trading House Limited,
Mauritius US$ 1 150,000 0.65 850,000 3.70
Aditya Birla Minacs Worldwide Limited 1 20,738,378 218.78 20,738,378 218.78
Aditya Birla Financial Services Private Limited 10 110,000,000 110.00 110,000,000 110.00
Aditya Birla Money Mart Limited 10 — — 20,000,000 24.08
Aditya Birla Finance Limited 10 — — 75,000,000 75.00
Birla Sun Life Insurance Company Limited 10 1,457,430,000 1,814.13 1,457,430,000 1,814.13
ABNL Investment Limited 10 21,000,000 21.00 21,000,000 21.00
Madura Garments Lifestyle Retail
Company Limited 10 10,000,000 10.00 10,000,000 10.00
Peter England Fashions and Retail Limited 10 500,000 0.50 500,000 0.50
Aditya Birla Minacs IT Services Limited 10 6,461,402 107.65 6,261,035 106.44
Indigold Trade and Services Limited
(Indigold) (formerly known as Madura
Garments International Brand Company
Limited) (Subsidiary w.e.f. 30th June, 2010) 10 999,997 1.00 999,997 1.00
LIL Investment Limited (Subsidiary of
Indigold w.e.f. 30th June, 2010) 10 389,500 0.39 1,024,997 1.03
Shaktiman Mega Food Park Private Limited 10 9,400 0.01 — —
Annual Report 2010-2011 97](https://image.slidesharecdn.com/nuvoannualreport2010-11-120524060613-phpapp02/85/Nuvo-annual-report_2010-11-115-320.jpg)
![SCHEDULES Aditya Birla Nuvo Limited
` Crore
As at As at
Face Value Number 31-Mar-2011 Number 31-Mar-2010
Preference Shares:
Aditya Birla Minacs IT Services Limited
7% Cumulative, Redeemable Preference Shares 100 1,500,000 15.00 1,500,000 15.00
Aditya Birla Finance Limited
7.00% Compulsory Convertible
Cumulative Preference Shares 10 — — 25,000,000 25.00
7.50% Compulsory Convertible
Cumulative Preference Shares 10 — — 25,000,000 25.00
Madura Garments Lifestyle
Retail Company Limited
8% Cumulative Redeemable
Preference Shares 10 10,000,000 10.00 10,000,000 10.00
Peter England Fashions and Retail Limited
8% Cumulative Redeemable
Preference Shares 10 500,000 0.50 500,000 0.50
Aditya Birla Financial Services Private Limited
0.01% Compulsory Convertible
Preference Shares 10 540,000,000 540.00 400,000,000 400.00
Total Long Term Investments 5,424.40 5,435.85
STANDALONE FINANCIAL STATEMENTS
CURRENT INVESTMENTS
Unquoted, Non-Trade and Fully Paid-Up:
Units of Mutual Funds 10.00 53.00 —
Total Current Investments 53.00 —
GRAND TOTAL 5,477.40 5,435.85
Aggregate Book Value - Quoted 2,557.29 2,557.29
- Unquoted 2,920.11 2,878.56
Aggregate Market Value - Quoted 6,352.51 6,093.10
Number Number
Units of various Mutual Funds schemes
purchased and redeemed during the year: 4,256,784,590 7,236,492,901
# Each Preference Share is optionally convertible into
10 Equity Shares of ` 10/- each fully paid-up on the
expiry of a period of 15 years from the date of allotment.
- All Shares are fully paid-up, unless otherwise stated.
- Refer Note 8 of Schedule 20.
` Crore
As at As at
31-Mar-2011 31-Mar-2010
SCHEDULE 7
INVENTORIES
Finished Goods 441.12 293.72
Stores and Spares 101.42 99.04
[Includes Goods in Transit ` 1.08 Crore
(Previous Year: ` 0.31 Crore)]
Raw Materials 578.26 416.33
[Includes Goods in Transit ` 1.74 Crore
(Previous Year: ` 1.89 Crore)]
Work in Progress 81.98 67.09
Waste/Scrap 0.46 0.16
1,203.24 876.34
98 Annual Report 2010-2011](https://image.slidesharecdn.com/nuvoannualreport2010-11-120524060613-phpapp02/85/Nuvo-annual-report_2010-11-116-320.jpg)
![Aditya Birla Nuvo Limited SCHEDULES
` Crore
As at As at
31-Mar-2011 31-Mar-2010
SCHEDULE 8
SUNDRY DEBTORS*
(Unsecured except otherwise stated)
Due for period exceeding six months
Considered Good 23.72 36.21
Considered Doubtful 6.31 15.14
Due for less than six months#
Considered Good 1,132.53 657.12
Considered Doubtful — 0.02
Less: Provision for Doubtful Debts (6.31) (15.16)
1,156.25 693.33
* Includes amount in respect of which the Company holds deposits 103.93 55.89
and Letters of Credit/Guarantees from Banks.
# Includes subsidy receivable from Government of India ` 289.24 Crore (Previous Year: ` 108.28 Crore).
SCHEDULE 9
CASH AND BANK BALANCES
Cash in Hand 1.39 0.91
Cheques in Hand 8.57 1.65
STANDALONE FINANCIAL STATEMENTS
Balances with Scheduled Banks:*
Current Accounts 10.79 10.56
Deposit Accounts 0.53 1.13
Balances with Non-Scheduled Bank:
On Current Account — (HSBC Bank, UK)# 0.03 0.06
21.31 14.31
* Includes balance pertaining to Right Issue Refund Order 0.06 0.07
* Includes balance pertaining to Unclaimed Dividend 2.51 2.39
# Maximum amount due at any time during the year (HSBC Bank, UK) 3.44 1.92
SCHEDULE 10
LOANS AND ADVANCES
(Unsecured, Considered Good, except otherwise stated)
From Subsidiary Companies 62.76 199.48
Advances recoverable in cash or in kind 220.27 155.13
or for value to be received+
[Net of Doubtful, fully provided ` 2.10 Crore
(Previous Year: ` 1.88 Crore)]
Deposits+ 154.54 129.59
[Net of Doubtful, fully provided ` 1.35 Crore
(Previous Year: ` 2.31 Crore)]
Balances with Central Excise, Customs and Port Trust, etc. 58.96 106.35
[Net of Doubtful, fully provided ` 3.04 Crore
(Previous Year: ` 3.04 Crore)]
Advance Tax and Tax Deducted at Source 0.94 17.21
[Net of Provision for Taxation ` 314.17 Crore (Previous Year: ` 353.47 Crore)]
MAT Credit Entitlement — 15.09
(Refer Note 9 of Schedule 20) 497.47 622.85
+ includes:
(1) Amount Due from Officers 0.07 —
(2) Maximum Amount Due from Officers at any time during the year 0.08 0.03
Annual Report 2010-2011 99](https://image.slidesharecdn.com/nuvoannualreport2010-11-120524060613-phpapp02/85/Nuvo-annual-report_2010-11-117-320.jpg)

![Aditya Birla Nuvo Limited SCHEDULES
SCHEDULE 20 (Contd.)
SIGNIFICANT ACCOUNTING POLICIES AND NOTES ON ACCOUNTS
Country of Proportion of
Incorporation Ownership Interest
As at As at
31-Mar-2011 31-Mar-2010
Name of the Ventures:
2. Birla Sun Life Asset Management Company
Limited [JV of Subsidiary Company (ABFSPL)] India 49.99% 49.99%
The aggregate of Company’s share in the above venture is:
` Crore
Current Year Previous Year
Net Fixed Assets 18.53 24.24
Investments 62.60 33.84
Net Current Assets 30.81 30.16
Loans — 17.50
Deferred Tax (Liabilities)/Assets 0.59 (0.48)
STANDALONE FINANCIAL STATEMENTS
Income 192.58 153.90
Expenses (Including Depreciation and Taxation) 150.31 129.68
Contingent Liabilities 2.94 2.30
Capital Commitments 0.18 0.16
3. Birla Sun Life Trustee Company Private Limited
[JV of Subsidiary Company (ABFSPL)] India 49.85% 49.85%
Net Fixed Assets — —
Investments 0.12 0.10
Net Current Assets 0.02 0.00
Income 0.04 0.03
Expenses (Including Depreciation and Taxation) 0.01 0.01
Contingent Liabilities
Capital Commitments — —
21. Disclosure in respect of Related Parties pursuant to Accounting Standard 18 – refer Annexure II.
22. For Derivative Information — refer Annexure III.
23. The Company has fertilisers bonds of ` 65.5 Crore received from the Ministry of Fertilisers, the Government
of India against the outstanding amount of subsidy receivable, out of which bonds amounting to ` 20.30
Crore (Previous Year: ` 29.33 Crore) are outstanding at the year end. The market value of above bonds are
lower than book value, therefore the diminution in the value of above bonds amounting to ` 0.47 Crore
(Previous Year: ` 0.46 Crore) has been accounted under Miscellaneous Expenses. The aforesaid bonds
have been classified as “Other Current Assets” in the financial statements.
24. Other Interest include Interest on Income Tax Refund of ` 0.92 Crore (Previous Year: ` 2.34 Crore).
25. In September 2005, the Company had purchased 37.18 Crore equity shares of IDEA Cellular Ltd. (IDEA)
from M/s. AT&T Cellular Pvt. Ltd., Mauritius, and paid consideration of US$ 150 Million without deduction
of tax at source after obtaining an order under Section 195(2) of the Income Tax Act from the Income Tax
Department. The Deputy Director of Income Tax (International Taxation), (DDIT), Mumbai, has issued
Annual Report 2010-2011 119](https://image.slidesharecdn.com/nuvoannualreport2010-11-120524060613-phpapp02/85/Nuvo-annual-report_2010-11-137-320.jpg)


![Aditya Birla Nuvo Limited SCHEDULES
SCHEDULE 22 (Contd.)
SIGNIFICANT ACCOUNTING POLICIES AND NOTES ON ACCOUNTS
` Crore
Transaction/Nature of Relationship Associates Key Relatives Grand
Management of Key Total
Personnel Management
Personnel
Fresh Equity Investment made
ITSL — — — —
(1.00) — — (1.00)
LIL — — — —
(1.03) — — (1.03)
TOTAL — — — —
(2.03) — — (2.03)
Loans Granted (including Inter
Corporate Deposits)]
ITSL — — — —
(1.03) — — (1.03)
LIL — — — —
(0.10) — — (0.10)
TOTAL — — — —
(1.13) — — (1.13)
Loans Granted received back (including Inter
Corporate Deposits)
Shri Adesh Gupta — — — —
— (E) — (E)
TOTAL — — — —
— (E) — (E)
CONSOLIDATED FINANCIAL STATEMENTS
Outstanding Balances as on 31.03.2011
Loan Granted — — — —
(1.13) — — (1.13)
Interest Accrued on Loans Granted — — — —
(0.04) — — (0.04)
Amount Payable — 0.12 — 0.12
(0.02) — — (0.02)
Amount Receivable — — — —
— — (2.00) (2.00)
Investments Outstanding 0.01 — — 0.01
(2.03) — — (2.03)
- Figures in brackets represent corresponding amount of Previous Year.
- No amount in respect of the related parties have been written off/back are provided for during the year.
- Related party relationship have been identified by the management and relied upon by the auditors.
Annual Report 2010-2011 171](https://image.slidesharecdn.com/nuvoannualreport2010-11-120524060613-phpapp02/85/Nuvo-annual-report_2010-11-189-320.jpg)

![ADITYA BIRLA NUVO, ITS SUBSIDIARIES & JOINT VENTURES*
ADITYA BIRLA NUVO LTD. : Fashion & Lifestyle, Carbon Black, Agri-
business, Rayon Yarn (Incl. Caustic Soda & allied
chemicals), Insulators, Textiles (Spun Yarn &
Fabrics)
I) ADITYA BIRLA FINANCIAL SERVICES
Subsidiaries
ƒ Birla Sun Life Insurance Company Ltd.
[JV with Sun Life Financial Inc of Canada] : Life Insurance
ƒ Aditya Birla Financial Services Pvt. Ltd. (“ABFSPL”) : Investment
• Aditya Birla Money Ltd. : Equity Broking
ƒ Aditya Birla Commodities Broking Ltd. : Commodities Broking
• Aditya Birla Capital Advisors Pvt. Ltd. Private Equity Investment, Advisory &
Management Services
• Aditya Birla Trustee Company Pvt. Ltd. : Trustee of Private Equity Fund
• Aditya Birla Customer Services Pvt. Ltd : General Services
• Aditya Birla Financial Shared Services Ltd. : Financial & IT enabled services
• Aditya Birla Insurance Brokers Ltd. : Non-life Insurance Advisory and Broking
• Aditya Birla Finance Ltd. : NBFC / Fund Based Lending
ƒ Aditya Birla Securities Private Ltd.
• Aditya Birla Money Mart Ltd. : Wealth Management & Distribution
ƒ Aditya Birla Money Insurance Advisory Services Ltd. : Life Insurance Advisory
ƒ ABNL Investment Ltd. : Investment
ƒ LIL Investment Ltd. : Investment
Joint Ventures (through ABFSPL)
ƒ Birla Sun Life Asset Management Company Ltd. : Asset Management
ƒ Birla Sun Life Trustee Company Pvt. Ltd. : Trustee of Birla Sun Life Mutual Fund
II) IT-ITeS SUBSIDIARIES
ƒ Aditya Birla Minacs Worldwide Ltd. & its subsidiaries : Information Technology enabled Services
• Transworks Inc. USA
• Aditya Birla Minacs Philippines Inc, Philippines
• AV Transworks Ltd., Canada
• Aditya Birla Minacs Worldwide Inc.,Canada & its subsidiaries
ƒ The Minacs Group, (USA) Inc.
• Bureau of Collection Recovery, LLC
ƒ Minacs Worldwide S.A. de C.V., Mexico
ƒ Minacs Ltd, UK
ƒ Minacs Worldwide GmbH, Germany
ƒ Minacs Kft., Hungary
ƒ Bureau of Collection Recovery (BCR) Inc.
ƒ Aditya Birla Minacs BPO Ltd. UK
• Aditya Birla Minacs BPO Pvt. Ltd., India
• Compass BPO Inc., USA
ƒ Aditya Minacs IT Services Ltd. & its subsidiary : Information Technology services
• Aditya Birla Minacs Technologies Ltd.
III) GARMENTS & OTHERS SUBSIDIARIES](https://image.slidesharecdn.com/nuvoannualreport2010-11-120524060613-phpapp02/85/Nuvo-annual-report_2010-11-205-320.jpg)