This document discusses using data from Webcourses to better understand student learning and make informed decisions. It outlines the following:
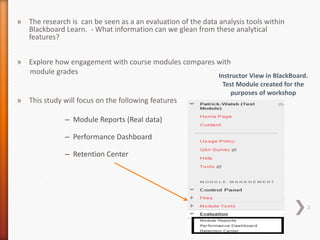
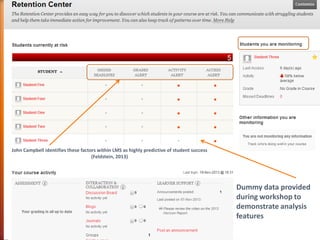
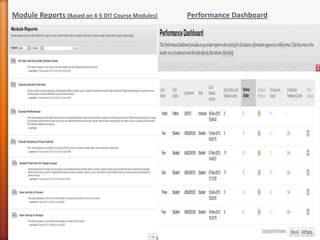
1) Exploring how student engagement with course modules compares to module grades using the Module Reports, Performance Dashboard, and Retention Center features.
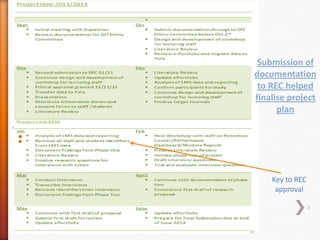
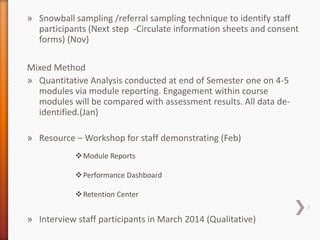
2) Conducting a mixed-methods study involving quantitative analysis of module report data from 4-5 courses followed by qualitative interviews with staff participants.
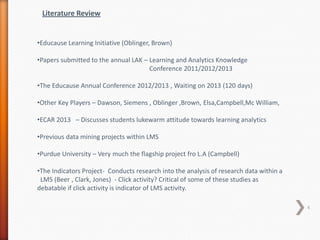
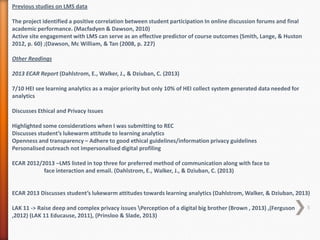
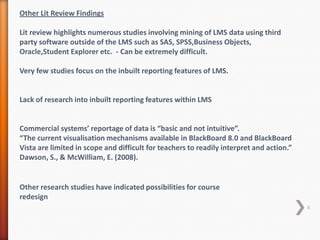
3) Highlighting literature identifying links between LMS data like participation and academic performance, as well as privacy and ethical issues around learning analytics.
Educational Data Mining in Program Evaluation: Lessons LearnedKerry Rice
AET 2016 Researchers present findings from a series of data mining studies, primarily examining data mining as part of an innovative triangulated approach in program evaluation. Findings suggest that is it possible to apply EDM techniques in online and blended learning classrooms to identify key variables important to the success of learners. Lessons learned will be shared as well as areas for improving data collection in learning management systems for meaningful analysis and visualization.
A case of Mbeya University of Science and Technology(MUST)
By;
Dr. Joel S. Mtebe
Director of;
Center for Virtual Learning
University of Dar es Salaam
Tanzania
http://works.bepress.com/mtebe
Advances in Learning Analytics and Educational Data Mining MehrnooshV
This presentation is about the state-of-the-art of Learning Analytics and Edicational Data Mining. It is presented by Mehrnoosh Vahdat as the introductory tutorial of Special Session 'Advances in Learning Analytics and Educational Data Mining' at ESANN 2015 conference.
Educational Data Mining/Learning Analytics issue brief overviewMarie Bienkowski
An overview of the Draft Issue Brief prepared by SRI International for the US Department of Education on Educational Data Mining and Learning Analytics
Speakers:
David Lewis, senior analytics consultant, Jisc
Martin Lynch, learning systems manager, University of South Wales
An opportunity to find out about how an institution has been implementing learning analytics to support the student journey with and opportunity to discuss issues and possibilities that the use of learning analytics may create.
DATA MINING IN EDUCATION : A REVIEW ON THE KNOWLEDGE DISCOVERY PERSPECTIVEIJDKP
Knowledge Discovery in Databases is the process of finding knowledge in massive amount of data where
data mining is the core of this process. Data mining can be used to mine understandable meaningful patterns from large databases and these patterns may then be converted into knowledge.Data mining is the process of extracting the information and patterns derived by the KDD process which helps in crucial decision-making.Data mining works with data warehouse and the whole process is divded into action plan to be performed on data: Selection, transformation, mining and results interpretation. In this paper, we have reviewed Knowledge Discovery perspective in Data Mining and consolidated different areas of data
mining, its techniques and methods in it.
The efficiency examination of teaching of different normalization methodsijdms
Normalization is an important database design method, in the course of the teaching of data modeling the
understanding and applying of this method cause problems for students the most. For improving the efficiency
of learning normalization we looked for alternative normalization methods and introduced them into
education. We made a survey among engineer students how efficient could they execute the normalization
with different methods. We executed statistical and data mining examinations to decide whether any of the
methods resulted significantly better solutions.
Online assessment and data analytics - Peter Tan - Institute of Technical Edu...Blackboard APAC
Are you spending lots of time conducting and marking formative assessments, tracking the learning progress of your students, and providing early intervention so as to help them learn and achieve better grades? If so, using a Learning Management System (LMS) together with a data analytics tool may help to increase your productivity. In this session, we will cover how Blackboard tools can help you conduct assessments in a paperless manner and automate the marking. You will also learn how data analytics can help you turn raw assessment data into meaningful information which will help you identify the 'at-risk' students that need your extra help, the better ones that need more challenging tasks, and the chapters that may need to be delivered with a different pedagogical approach. Hence, with a robust LMS and a data analytics tool, your quality of teaching and students' learning will help to bring about a higher student success rate.
Supporting understanding of students’ learning viavisual self-assessmentVille Kivimäki
Aalto University School of Engineering pilot project (Dynamic Course and Programme Level Feedback System) presentation at EUNIS 2018 – Coming of Age in the Digital World, Paris, France.
Blackboard Analytics for Learn: A recipe for successRichard Stals
So much of the current discussion around Learning Analytics seems to be caught up in the realm of Big Data that informs the top executives and decision makers who are shaping institution-wide strategies. While these kinds of topics need to be explored, truly significant and transformative uses of learning analytics can be had at the grassroots level of the teacher and student.
This session will look at how Edith Cowan University is using Blackboard Analytics for Learn to empower staff and students with their own data, allowing them to make informed and timely decisions in their own teaching and learning journeys.
We will explore how learning analytics data enables staff to do things like identify and support students at risk of disengaging from the course early, monitor how students are actually engaging in their course and collect real evidence on student interactions that informs a continual process of improvement in learning design and resources.
Australian university teacher’s engagement with learning analytics: Still ea...Blackboard APAC
This session reports the results of a recent OLT-funded national exploratory study addressing the relevant factors and their impact when implementing learning analytics for student retention purposes. The project utilised a mixed-method research design and yielded a series of outputs, including the development of a non-technical overview of learning analytics, focusing on linking the fields of student retention and learning analytics resulting in an institution level survey focusing on sector readiness and decision making relating to utilising learning analytics for retention purposes. An academic level survey was administered to academic staff exploring their progress, aspirations and support needs relating to learning analytics. Follow-up interviews expanded on their experiences with learning analytics to date. An evidence-based framework was developed, mapping important factors affecting learning analytics decision making and implementation. This was illustrated by a suite of five case studies developed by each of the research partner institutions detailing their experiences with learning analytics and demonstrating why elements in the framework are important. These findings were shared and tested at a National Forum in April 2015.
Delivered at Innovate and Educate: Teaching and Learning Conference by Blackboard. 24 -27 August 2015 in Adelaide, Australia.
Promoting Data Literacy at the Grassroots (ACRL 2015, Portland, OR)Adam Beauchamp
Presentation given at ACRL 2015, with Christine Murray, on teaching undergraduate students to discover and evaluate datasets for secondary data analysis.
Moving Forward on Learning Analytics - A/Professor Deborah West, Charles Darw...Blackboard APAC
Learning analytics is a 'hot topic' in education with many institutions seeking to make better use of the data available via various systems. One of the key challenges in this process is to understand the business questions that people working in various roles in institutions would like to be able to answer. However, it is also important that these questions are appropriately structured and specific in order to gather the relevant data. This session builds on the workshop run at last year's Blackboard Learning and Teaching conference where participants explored business questions and use cases for learning analytics from a range of perspectives.
Delivered at Innovate and Educate: Teaching and Learning Conference by Blackboard. 24 -27 August 2015 in Adelaide, Australia.
Learning Design and ResearchMethods/StatisticsJames Dalziel
A presentation about the use of Learning Design in the teaching of Research Methods, especially related to Statistics. Part of the ALTC National Teaching Fellowship on Learning Design.
Toward an automated student feedback system for text based assignments - Pete...Blackboard APAC
As the use of blended learning environments and digital technologies become integrated into the higher education sector, rich technologies such as analytics have the ability to assist teaching staff identify students at risk, learning material that is not proving effective and learning site designs that aid and facilitate improved learning. More recently consideration has been given to automated essay scoring. Such systems can be used in a formative way, such as providing feedback on initial assignment drafts or summatively through the analysis of final assignment submissions. Further, providing students with quick feedback on written assignments opens the opportunity through formative feedback to improved learning outcomes.
This presentation details a current project developing a system to analyse text-based assignments. The project is being developed for broad application, but the findings focus on an undergraduate pilot subject: ‘Ideas that Shook the World’ (a compulsory first year Bachelor of Arts subject taught on 5 campuses to more than 1000 students by 15 staff). Preliminary results of a fist scan of assignments are presented and the issues raised in developing the system presented together with an outline of additional work planned for the project. It is believed the work will have wide application where text-based assignments are utilised for assessment.
This presentation to the MoodleMoot UK/I 2017 provides an overview of Learning Analytics for VLE/LMS data and lessons learned in practice from using this data to model student risk and other characteristics. The findings come from fundamental research and application of Blackboard's X-Ray Learning Analytics application.
This mixed methods study explored racial or ethnic minority students who were enrolled in an online course to determine if there was a relationship between their online learning readiness characteristics and their outcomes across institutions. Also, minority student perceptions of what skills and experiences lead to success and how they can be better supported for online online learning is reported. Student surveys were administered using Likert and open-ended items to gather quantitative and qualitative data. Readiness characteristics included student reporting of their technology access, beliefs, and skills (technology access, online work skills, social technology skills, online efficacy), their self-efficacy (self-directedness and organization, achievement mindset, and growth mindset), and their communication (need for socialization, general communication competence, communication with instructor, and communication with peers), and student outcomes gathered included student perceptions of learning, self-reported satisfaction, and academic performance (course grade, instructor reported). Significant findings were discovered from multiple regression analyses indicating that several of these measures of readiness (online work skills, online efficacy, self-directedness and organization, communication with instructor, communication with classmates) positively influence student outcomes (learning, satisfaction, and academic performance). Qualitative findings indicate that minority students report time management, previous online course experience, and online work skills as the most prevalent themes of skills and experiences that positively influence their success. Moreover, they recommend that instructors and institutions provide them additional resources prior to the class to better prepare them to be successful, and that they receive support during the class by instructors and academic support staff. Recommendations are shared.
Simplifying Database Normalization within a Visual Interactive Simulation Modelijdms
Although many researchers focused on investigating the challenges of database normalization, and suggested recommendations on easing these challenges, this process remained an area of concern to database designers, developers, and learners. This paper investigated these challenges and involved Higher Education in Computer Science students learning database normalization, as they could well
represent beginning database designers/developers, who would struggle in effectively normalize their database design due to the complexity of this theoretical process, which has no similar real-life representation. The paper focused on the advantages of interactive visualization techniques to simplify database normalization, and recommended virtual world technologies, such as ‘Second Life’, as an effective platform to achieve this visualization via a simulated model of a relational database system. The simulation technique presented in this paper is novel, and is supported by extensive evidence on its
advantages to achieve an illustration of the ‘Normal Forms’ and the need for them.
This is a proposal of Research Topic ( Student performance prediction) . DUET CSE 15 Batch.
http://www.duet.ac.bd/department/department-of-computer-science-engineering/
Slides from Keynote presentation at the University of Southern California's 2015 Teaching with Technology annual conference.
"9:15 am – ANN Auditorium
Key Note: What Do We Mean by Learning Analytics?
Leah Macfadyen, Director for Evaluation and Learning Analytics, University of British Columbia
Executive Board, SoLAR (Society for Learning Analytics Research)
Leah Macfadyen will define and explore the emerging and interdisciplinary field of learning analytics in the context of quantified and personalized learning. Leah will use actual examples and case studies to illustrate the range of stakeholders learning analytics may serve, the diverse array of questions they may be used to address, and the potential impact of learning analytics in higher education."
[Extended] Bottom-up growth of learning analytics at two Australian universit...Danny Liu
Presented at the University of New South Wales Learning Analytics and Educational Data Science research group meeting, April 2016.
This presentation will outline two approaches to learning analytics at the University of Sydney and Macquarie University, where staff are closely involved in the coevolution and development of two bespoke learning analytics tools to personalise student-staff interactions at scale. The University of Sydney system, called the Student Relationship Engagement System (SRES), is a highly-customisable web-based tool that supports the efficient capture and collation of student datasets. A companion mobile app helps staff quickly collect and access student data. Through an embedded messaging system, teaching staff can set up fully customisable rules to contact students via personalised emails and text messages. A nascent feature allows staff to leverage machine learning to uncover hidden patterns and relationships within and between datasets. The Macquarie University system is an enhancement of an existing Moodle plug-in, the Moodle Engagement Analytics Plugin (MEAP). MEAP can readily access data on student assessments, completions, login activity, forum activity, and the gradebook, amongst others, which are customisably represented as ‘risk indicators’. MEAP allows flexible and customisable interrogation of these data, and provides staff the ability to send personalised emails to students based on these risk indicators. At both institutions, these learning analytics approaches have grown from the grassroots to address pressing staff needs, highlighting the importance of this bespoke coevolution process of design, development, and implementation. The systems have enjoyed substantial organic adoption and are associated with positive student outcomes. As open source developments, we are very interested in working together to open up accessible learning analytics to teachers and students.
Learning analytics and Moodle: So much we could measure, but what do we want to measure? A presentation to the USQ Math and Sciences Community of Practice May 2013
Predicting instructor performance using data mining techniques in higher educ...redpel dot com
Predicting instructor performance using data mining techniques in higher education
for more ieee paper / full abstract / implementation , just visit www.redpel.com
WCOL2019: Learning analytics for learning design or learning design for learn...Marko Teräs
Presentation at the 28th ICDE World Conference on Online Learning on the relationship between learning design and learning analytics. Part of a national-level learning analytics research and development project funded by the Finnish Ministry of Education and Culture.
Course revision is a reality of daily life in higher education. Each semester, faculty review their courses to ensure that they are presenting current concepts and providing proper methods of assessment and interaction for their students. Unfortunately, most review and revision is done during periods of frantic activity just before or during the beginning of the semester. This methodology does not allow for deep consideration of issues and can negatively affect learning for students.
Focused revision is a methodology of review that tasks faculty to review a course over a longer period of time and focus on one pedagogical aspect, such as interaction, content presentation, rubric development, etc. Focusing on a specific aspect of a course, to the exclusion of others, increases the efficacy of that aspect of the course while maintaining the current level of quality on the other aspects. This methodology also changes course revision from a summative process to a formative process and allows for the effective inclusion of student feedback into course design. The process also allows faculty to create efficiencies in their process to maximize time and minimize work. Multiple focused revisions may build on each other to create a synergy between course components, thus creating a more effective learning environment in both the physical and the digital classrooms, leading to increased student engagement and learning.
Similar to M Sc Applied eLearning - WIP Presentation (20)
We all have good and bad thoughts from time to time and situation to situation. We are bombarded daily with spiraling thoughts(both negative and positive) creating all-consuming feel , making us difficult to manage with associated suffering. Good thoughts are like our Mob Signal (Positive thought) amidst noise(negative thought) in the atmosphere. Negative thoughts like noise outweigh positive thoughts. These thoughts often create unwanted confusion, trouble, stress and frustration in our mind as well as chaos in our physical world. Negative thoughts are also known as “distorted thinking”.
Read| The latest issue of The Challenger is here! We are thrilled to announce that our school paper has qualified for the NATIONAL SCHOOLS PRESS CONFERENCE (NSPC) 2024. Thank you for your unwavering support and trust. Dive into the stories that made us stand out!
This is a presentation by Dada Robert in a Your Skill Boost masterclass organised by the Excellence Foundation for South Sudan (EFSS) on Saturday, the 25th and Sunday, the 26th of May 2024.
He discussed the concept of quality improvement, emphasizing its applicability to various aspects of life, including personal, project, and program improvements. He defined quality as doing the right thing at the right time in the right way to achieve the best possible results and discussed the concept of the "gap" between what we know and what we do, and how this gap represents the areas we need to improve. He explained the scientific approach to quality improvement, which involves systematic performance analysis, testing and learning, and implementing change ideas. He also highlighted the importance of client focus and a team approach to quality improvement.
Synthetic Fiber Construction in lab .pptxPavel ( NSTU)
Synthetic fiber production is a fascinating and complex field that blends chemistry, engineering, and environmental science. By understanding these aspects, students can gain a comprehensive view of synthetic fiber production, its impact on society and the environment, and the potential for future innovations. Synthetic fibers play a crucial role in modern society, impacting various aspects of daily life, industry, and the environment. ynthetic fibers are integral to modern life, offering a range of benefits from cost-effectiveness and versatility to innovative applications and performance characteristics. While they pose environmental challenges, ongoing research and development aim to create more sustainable and eco-friendly alternatives. Understanding the importance of synthetic fibers helps in appreciating their role in the economy, industry, and daily life, while also emphasizing the need for sustainable practices and innovation.
Model Attribute Check Company Auto PropertyCeline George
In Odoo, the multi-company feature allows you to manage multiple companies within a single Odoo database instance. Each company can have its own configurations while still sharing common resources such as products, customers, and suppliers.
2024.06.01 Introducing a competency framework for languag learning materials ...Sandy Millin
http://sandymillin.wordpress.com/iateflwebinar2024
Published classroom materials form the basis of syllabuses, drive teacher professional development, and have a potentially huge influence on learners, teachers and education systems. All teachers also create their own materials, whether a few sentences on a blackboard, a highly-structured fully-realised online course, or anything in between. Despite this, the knowledge and skills needed to create effective language learning materials are rarely part of teacher training, and are mostly learnt by trial and error.
Knowledge and skills frameworks, generally called competency frameworks, for ELT teachers, trainers and managers have existed for a few years now. However, until I created one for my MA dissertation, there wasn’t one drawing together what we need to know and do to be able to effectively produce language learning materials.
This webinar will introduce you to my framework, highlighting the key competencies I identified from my research. It will also show how anybody involved in language teaching (any language, not just English!), teacher training, managing schools or developing language learning materials can benefit from using the framework.
How to Split Bills in the Odoo 17 POS ModuleCeline George
Bills have a main role in point of sale procedure. It will help to track sales, handling payments and giving receipts to customers. Bill splitting also has an important role in POS. For example, If some friends come together for dinner and if they want to divide the bill then it is possible by POS bill splitting. This slide will show how to split bills in odoo 17 POS.
Palestine last event orientationfvgnh .pptxRaedMohamed3
An EFL lesson about the current events in Palestine. It is intended to be for intermediate students who wish to increase their listening skills through a short lesson in power point.
Operation “Blue Star” is the only event in the history of Independent India where the state went into war with its own people. Even after about 40 years it is not clear if it was culmination of states anger over people of the region, a political game of power or start of dictatorial chapter in the democratic setup.
The people of Punjab felt alienated from main stream due to denial of their just demands during a long democratic struggle since independence. As it happen all over the word, it led to militant struggle with great loss of lives of military, police and civilian personnel. Killing of Indira Gandhi and massacre of innocent Sikhs in Delhi and other India cities was also associated with this movement.
1. 1
How can DIT academic staff use Webcourses data
and reporting to make better informed decisions
around student learning?
2. » The research is can be seen as a an evaluation of the data analysis tools within
Blackboard Learn. - What information can we glean from these analytical
features?
» Explore how engagement with course modules compares with
module grades
Instructor View in BlackBoard.
Test Module created for the
purposes of workshop
» This study will focus on the following features
– Module Reports (Real data)
– Performance Dashboard
– Retention Center
2
4. Literature Review
•Educause Learning Initiative (Oblinger, Brown)
•Papers submitted to the annual LAK – Learning and Analytics Knowledge
Conference 2011/2012/2013
•The Educause Annual Conference 2012/2013 , Waiting on 2013 (120 days)
•Other Key Players – Dawson, Siemens , Oblinger ,Brown, Elsa,Campbell,Mc William,
•ECAR 2013 – Discusses students lukewarm attitude towards learning analytics
•Previous data mining projects within LMS
•Purdue University – Very much the flagship project fro L.A (Campbell)
•The Indicators Project- Conducts research into the analysis of research data within a
LMS (Beer , Clark, Jones) - Click activity? Critical of some of these studies as
debatable if click activity is indicator of LMS activity.
4
5. Previous studies on LMS data
The project identified a positive correlation between student participation In online discussion forums and final
academic performance. (Macfadyen & Dawson, 2010)
Active site engagement with LMS can serve as an effective predictor of course outcomes (Smith, Lange, & Huston
2012, p. 60) ;(Dawson, Mc William, & Tan (2008, p. 227)
Other Readings
2013 ECAR Report (Dahlstrom, E., Walker, J., & Dziuban, C. (2013)
7/10 HEI see learning analytics as a major priority but only 10% of HEI collect system generated data needed for
analytics
Discusses Ethical and Privacy Issues
Highlighted some considerations when I was submitting to REC
Discusses student’s lukewarm attitude to learning analytics
Openness and transparency – Adhere to good ethical guidelines/information privacy guidelines
Personalised outreach not impersonalised digital profiling
ECAR 2012/2013 –LMS listed in top three for preferred method of communication along with face to
face interaction and email. (Dahlstrom, E., Walker, J., & Dziuban, C. (2013)
ECAR 2013 Discusses student’s lukewarm attitudes towards learning analytics (Dahlstrom, Walker, & Dziuban, 2013)
LAK 11 -> Raise deep and complex privacy issues Perception of a digital big brother (Brown , 2013) ,(Ferguson
,2012) (LAK 11 Educause, 2011), (Prinsloo & Slade, 2013)
5
6. Other Lit Review Findings
Lit review highlights numerous studies involving mining of LMS data using third
party software outside of the LMS such as SAS, SPSS,Business Objects,
Oracle,Student Explorer etc. - Can be extremely difficult.
Very few studies focus on the inbuilt reporting features of LMS.
Lack of research into inbuilt reporting features within LMS
Commercial systems’ reportage of data is “basic and not intuitive”.
“The current visualisation mechanisms available in BlackBoard 8.0 and BlackBoard
Vista are limited in scope and difficult for teachers to readily interpret and action.”
Dawson, S., & McWilliam, E. (2008).
Other research studies have indicated possibilities for course
redesign
6
7. » Snowball sampling /referral sampling technique to identify staff
participants (Next step -Circulate information sheets and consent
forms) (Nov)
Mixed Method
» Quantitative Analysis conducted at end of Semester one on 4-5
modules via module reporting. Engagement within course
modules will be compared with assessment results. All data deidentified.(Jan)
» Resource – Workshop for staff demonstrating (Feb)
Module Reports
Performance Dashboard
Retention Center
7
» Interview staff participants in March 2014 (Qualitative)
8. John Campbell identifies these factors within LMS as highly predictive of student success
(Feldstein, 2013)
Dummy data provided
during workshop to
demonstrate analysis 8
features
10. Target Journals
» Journal of Information Technology Education
» International Journal of Technology, Knowledge and
Society
» MERLOT Journal of Online Learning and Teaching
Target Conference
» LAK2015 (5th Learning Analytics and Knowledge
Conference 2015)
10