Modification and Climate Change Analysis of surrounding Environment using Rem...iosrjce
This review is presented in three parts. The first part explains such terms as climate, climate change,
climate change adaptation, remote sensing (RS) and geographical information systems (GIS). The second part
highlights some areas where RS and GIS are applicable in climate change analysis and adaptation. Issues
considered are snow/glacier monitoring, land cover monitoring, carbon trace/accounting, atmospheric
dynamics, terrestrial temperature monitoring, biodiversity conservation, ocean and coast monitoring, erosion
monitoring and control, agriculture, flood monitoring, health and disease, drought and desertification. The
third part concludes from all illustrated instances that climate change problems will be less understood and
managed without the application of RS and GIS. While humanity is still being plagued by climate change effects,
RS and GIS play a crucial role in its management for continued human survival. Key words: Climate, Climate
Change, Climate Change Adaptation, Geographical Information System and Remote Sensing.
PSY2G: moving towards
global operational oceanography
By Nicolas Ferry
Introduction
In just a few years, Mercator has developed 3 ocean analysis and forecasting systems for the
North Atlantic. Today a new stage has been reached with PSY2G, Mercator’s first low resolution (2°),
global ocean analysis system.
Each week, the PSY2G system does operational analysis of the global ocean by assimilating all
available altimetry observations in an identical way to the work being done with PSY1v1 and PSY2v1.
PSY2G thus provides weekly ocean bulletins which are used, in particular, for seasonal forecasting by
Météo France. Mercator has thus shown its determination to contribute to GODAE (the Global Ocean
Data Assimilation Experiment).
In terms of objectives, PSY2G, due to its horizontal resolution, is of course not designed to
assimilate mesoscale processes like PSY1 or PSY2 but rather to assimilate global scale climate
signals. This is also a significant technical stage before the migration towards PSY3 (global to ¼°) and
the setting up of global mode multivariate assimilation (SAM1v2).
In this newsletter, we shall be describing the PSY2G prototype in detail. The system’s
performances are discussed by referring to a global ocean reanalysis for an 11 year period (1993 to
2003).
Gravity anomaly across reagional structuresAmit K. Mishra
Gravity Anomaly across continents and ocean, gravity anomaly across mid-oceanic ridges, gravity anomaly across orogenic belts, and gravity anomaly across subduction zones.
M6.0 2004 Parkfield Earthquake : Seismic AttenuationAli Osman Öncel
HRSN isimli kuyu içi sismik istasyonlar kullanılarak, San Andreas fayı boyunca meydana gelen büyük depremler öncesi sismik azalımın varlığının olup olmadığı araştırılıyor.
Delineation of Hydrocarbon Bearing Reservoirs from Surface Seismic and Well L...IOSR Journals
Hydrocarbon reservoir has been delineated and their boundaries mapped using direct indicators from 3-D seismic and well log data from an oil field in Nembe creek, Niger Delta region. Well log signatures were employed to identify hydrocarbon bearing sands. Well to seismic correlation revealed that these reservoirs tied with direct hydrocarbon indicators on the seismic section. The results of the interpreted well logs revealed that the hydrocarbon interval in the area occurs between 6450ft to 6533ft for well A, 6449ft to 6537ft for well B and 6629ft to 6704ft for well C; which were delineated using the resistivity, water saturation and gamma ray logs. Cross plot analysis was carried out to validate the sensitivity of the rock attributes to reservoir saturation condition. Analysis of the extracted seismic attribute slices revealed HD5000 as hydrocarbon bearing reservoir.
Bouguer anomaly and free-air anomaly correlation signatures in parts of Benue...Premier Publishers
Topographic values in the study area range from 80m to 170m. The rock type comprises Basement Complex at the west bounded by River Niger, and sedimentary rock type in the east. Density measurements of various rocks were taken with the highest bulk density from the metamorphic schist (2.77gm/cm3), followed by igneous rock olivine gabbro (2.73gm/cm3), and sandstone (2.35gm/cm3). Results of gravity survey revealed a mean Bouguer anomaly of +12.15 mgals and a mean free air anomaly of +22.0 mgals. Interpretation of gravity measurements revealed the existence of a fracture at Gboloko NE-SW axis, a synclinal fold axis at about 5.5km west of Gboloko (between the Staurolite Schist and Cordierite-Tourmaline schist). The Basement-Sedimentary boundary is characterized by a drop in residual Bouguer anomaly from positive to negative at about 6km east of Gboloko. The thickness of the sediments is about 0.90km at the northern part of the Basement-Sedimentary boundary, and about 2.0km in the south, thus suggesting a progressive increase in sedimentary thickness at the western edge of the Benue trough. The Free-air anomaly ‘highs’ correspond to Bouguer anomaly ‘highs’ and tied to areas of high topography and bands of weathered, lateritized sediments. The Bouguer anomaly profiles exhibited reliable signature changes at the rock boundaries, thus a supportive tool for delineation of those border areas.
Exposed subsurface ice sheets in the Martian mid-latitudesSérgio Sacani
Thick deposits cover broad regions of the Martian mid-latitudes with a smooth mantle; erosion
in these regions creates scarps that expose the internal structure of the mantle.We
investigated eight of these locations and found that they expose deposits of water ice that
can be >100 meters thick, extending downward from depths as shallow as 1 to 2 meters below
the surface.The scarps are actively retreating because of sublimation of the exposed water
ice.The ice deposits likely originated as snowfall during Mars’ high-obliquity periods and have
now compacted into massive, fractured, and layered ice.We expect the vertical structure of
Martian ice-rich deposits to preserve a record of ice deposition and past climate.
A large impact crater beneath Hiawatha Glacier in northwest GreenlandSérgio Sacani
We report the discovery of a large impact crater beneath Hiawatha Glacier in northwest Greenland. From airborne radar surveys, we identify a 31-kilometer-wide, circular bedrock depression beneath up to a kilometer of ice. This depression has an elevated rim that cross-cuts tributary subglacial channels and a subdued central uplift that appears to be actively eroding. From ground investigations of the deglaciated foreland, we identify overprinted structures within Precambrian bedrock along the ice margin that strike tangent to the subglacial rim. Glaciofluvial sediment from the largest river draining the crater contains shocked quartz and other impact- related grains. Geochemical analysis of this sediment indicates that the impactor was a fractionated iron aster- oid, which must have been more than a kilometer wide to produce the identified crater. Radiostratigraphy of the ice in the crater shows that the Holocene ice is continuous and conformable, but all deeper and older ice appears to be debris rich or heavily disturbed. The age of this impact crater is presently unknown, but from our geological and geophysical evidence, we conclude that it is unlikely to predate the Pleistocene inception of the Greenland Ice Sheet.
Antarctic climate history and global climate changesPontus Lurcock
Antarctic climate changes have been reconstructed from ice and sediment cores and numerical models (which also predict future changes). Major ice sheets first appeared 34 million years ago (Ma) and fluctuated throughout the Oligocene, with an overall cooling trend. Ice volume more than doubled at the Oligocene-Miocene boundary. Fluctuating Miocene temperatures peaked at 17–14 Ma, followed by dramatic cooling. Cooling continued through the Pliocene and Pleistocene, with another major glacial expansion at 3–2 Ma. Several interacting drivers control Antarctic climate. On timescales of 10,000–100,000 years, insolation varies with orbital cycles, causing periodic climate variations. Opening of Southern Ocean gateways produced a circumpolar current that thermally isolated Antarctica. Declining atmospheric CO2 triggered Cenozoic glaciation. Antarctic glaciations affect global climate by lowering sea level, intensifying atmospheric circulation, and increasing planetary albedo. Ice sheets interact with ocean water, forming water masses that play a key role in global ocean circulation.
Observed glacier and volatile distribution on Pluto from atmosphere–topograph...Sérgio Sacani
Pluto has a variety of surface frosts and landforms as well as a
complex atmosphere1. There is ongoing geological activity related
to the massive Sputnik Planum glacier, mostly made of nitrogen (N2)
ice mixed with solid carbon monoxide and methane2, covering the
4-kilometre-deep, 1,000-kilometre-wide basin of Sputnik Planum1,3
near the anti-Charon point. The glacier has been suggested to arise
from a source region connected to the deep interior, or from a sink
collecting the volatiles released planetwide1. Thin deposits of N2
frost, however, were also detected at mid-northern latitudes and
methane ice was observed to cover most of Pluto except for the
darker, frost-free equatorial regions2. Here we report numerical
simulations of the evolution of N2, methane and carbon monoxide
on Pluto over thousands of years. The model predicts N2 ice
accumulation in the deepest low-latitude basin and the threefold
increase in atmospheric pressure that has been observed to occur
since 19884–6. This points to atmospheric–topographic processes as
the origin of Sputnik Planum’s N2 glacier. The same simulations also
reproduce the observed quantities of volatiles in the atmosphere and
show frosts of methane, and sometimes N2, that seasonally cover the
mid- and high latitudes, explaining the bright northern polar cap
reported in the 1990s7,8 and the observed ice distribution in 20152.
The model also predicts that most of these seasonal frosts should
disappear in the next decade.
The use of Nauplii and metanauplii artemia in aquaculture (brine shrimp).pptxMAGOTI ERNEST
Although Artemia has been known to man for centuries, its use as a food for the culture of larval organisms apparently began only in the 1930s, when several investigators found that it made an excellent food for newly hatched fish larvae (Litvinenko et al., 2023). As aquaculture developed in the 1960s and ‘70s, the use of Artemia also became more widespread, due both to its convenience and to its nutritional value for larval organisms (Arenas-Pardo et al., 2024). The fact that Artemia dormant cysts can be stored for long periods in cans, and then used as an off-the-shelf food requiring only 24 h of incubation makes them the most convenient, least labor-intensive, live food available for aquaculture (Sorgeloos & Roubach, 2021). The nutritional value of Artemia, especially for marine organisms, is not constant, but varies both geographically and temporally. During the last decade, however, both the causes of Artemia nutritional variability and methods to improve poorquality Artemia have been identified (Loufi et al., 2024).
Brine shrimp (Artemia spp.) are used in marine aquaculture worldwide. Annually, more than 2,000 metric tons of dry cysts are used for cultivation of fish, crustacean, and shellfish larva. Brine shrimp are important to aquaculture because newly hatched brine shrimp nauplii (larvae) provide a food source for many fish fry (Mozanzadeh et al., 2021). Culture and harvesting of brine shrimp eggs represents another aspect of the aquaculture industry. Nauplii and metanauplii of Artemia, commonly known as brine shrimp, play a crucial role in aquaculture due to their nutritional value and suitability as live feed for many aquatic species, particularly in larval stages (Sorgeloos & Roubach, 2021).
Seminar of U.V. Spectroscopy by SAMIR PANDASAMIR PANDA
Spectroscopy is a branch of science dealing the study of interaction of electromagnetic radiation with matter.
Ultraviolet-visible spectroscopy refers to absorption spectroscopy or reflect spectroscopy in the UV-VIS spectral region.
Ultraviolet-visible spectroscopy is an analytical method that can measure the amount of light received by the analyte.
ANAMOLOUS SECONDARY GROWTH IN DICOT ROOTS.pptxRASHMI M G
Abnormal or anomalous secondary growth in plants. It defines secondary growth as an increase in plant girth due to vascular cambium or cork cambium. Anomalous secondary growth does not follow the normal pattern of a single vascular cambium producing xylem internally and phloem externally.
ESR spectroscopy in liquid food and beverages.pptxPRIYANKA PATEL
With increasing population, people need to rely on packaged food stuffs. Packaging of food materials requires the preservation of food. There are various methods for the treatment of food to preserve them and irradiation treatment of food is one of them. It is the most common and the most harmless method for the food preservation as it does not alter the necessary micronutrients of food materials. Although irradiated food doesn’t cause any harm to the human health but still the quality assessment of food is required to provide consumers with necessary information about the food. ESR spectroscopy is the most sophisticated way to investigate the quality of the food and the free radicals induced during the processing of the food. ESR spin trapping technique is useful for the detection of highly unstable radicals in the food. The antioxidant capability of liquid food and beverages in mainly performed by spin trapping technique.
Travis Hills' Endeavors in Minnesota: Fostering Environmental and Economic Pr...Travis Hills MN
Travis Hills of Minnesota developed a method to convert waste into high-value dry fertilizer, significantly enriching soil quality. By providing farmers with a valuable resource derived from waste, Travis Hills helps enhance farm profitability while promoting environmental stewardship. Travis Hills' sustainable practices lead to cost savings and increased revenue for farmers by improving resource efficiency and reducing waste.
This presentation explores a brief idea about the structural and functional attributes of nucleotides, the structure and function of genetic materials along with the impact of UV rays and pH upon them.
Richard's aventures in two entangled wonderlandsRichard Gill
Since the loophole-free Bell experiments of 2020 and the Nobel prizes in physics of 2022, critics of Bell's work have retreated to the fortress of super-determinism. Now, super-determinism is a derogatory word - it just means "determinism". Palmer, Hance and Hossenfelder argue that quantum mechanics and determinism are not incompatible, using a sophisticated mathematical construction based on a subtle thinning of allowed states and measurements in quantum mechanics, such that what is left appears to make Bell's argument fail, without altering the empirical predictions of quantum mechanics. I think however that it is a smoke screen, and the slogan "lost in math" comes to my mind. I will discuss some other recent disproofs of Bell's theorem using the language of causality based on causal graphs. Causal thinking is also central to law and justice. I will mention surprising connections to my work on serial killer nurse cases, in particular the Dutch case of Lucia de Berk and the current UK case of Lucy Letby.
Comparing Evolved Extractive Text Summary Scores of Bidirectional Encoder Rep...University of Maribor
Slides from:
11th International Conference on Electrical, Electronics and Computer Engineering (IcETRAN), Niš, 3-6 June 2024
Track: Artificial Intelligence
https://www.etran.rs/2024/en/home-english/
Observation of Io’s Resurfacing via Plume Deposition Using Ground-based Adapt...Sérgio Sacani
Since volcanic activity was first discovered on Io from Voyager images in 1979, changes
on Io’s surface have been monitored from both spacecraft and ground-based telescopes.
Here, we present the highest spatial resolution images of Io ever obtained from a groundbased telescope. These images, acquired by the SHARK-VIS instrument on the Large
Binocular Telescope, show evidence of a major resurfacing event on Io’s trailing hemisphere. When compared to the most recent spacecraft images, the SHARK-VIS images
show that a plume deposit from a powerful eruption at Pillan Patera has covered part
of the long-lived Pele plume deposit. Although this type of resurfacing event may be common on Io, few have been detected due to the rarity of spacecraft visits and the previously low spatial resolution available from Earth-based telescopes. The SHARK-VIS instrument ushers in a new era of high resolution imaging of Io’s surface using adaptive
optics at visible wavelengths.
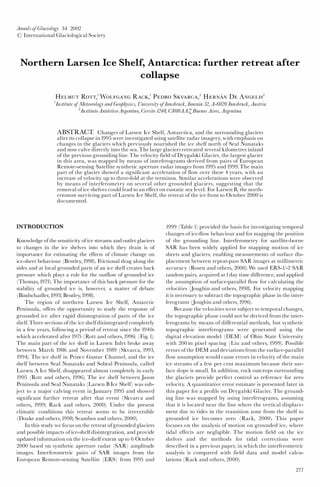
Northern larsen ice shelf Antarctica: further retreat after collapse
1. Northern Larsen Ice Shelf, Antarctica: further retreat after
collapse
Helmut Rott,1
Wolfgang Rack,1
Pedro Skvarca,2
Herna¨ n De Angelis2
1
Institute of Meteorology and Geophysics, University of Innsbruck, Innrain 52, A-6020 Innsbruck, Austria
2
Instituto Anta¨ rtico Argentino, Cerrito 1248, C1010AAZ Buenos Aires, Argentina
ABSTRACT. Changes of Larsen Ice Shelf, Antarctica, and the surrounding glaciers
after its collapse in1995 were investigated using satellite radar imagery, with emphasis on
changes in the glaciers which previously nourished the ice shelf north of Seal Nunataks
and now calve directly into the sea.The large glaciers retreated several kilometres inland
of the previous grounding line.The velocity field of Drygalski Glacier, the largest glacier
in this area, was mapped by means of interferograms derived from pairs of European
Remote-sensing Satellite synthetic aperture radar images from 1995 and 1999.The main
part of the glacier showed a significant acceleration of flow over these 4 years, with an
increase of velocity up to three-fold at the terminus. Similar accelerations were observed
by means of interferometry on several other grounded glaciers, suggesting that the
removal of ice shelves could lead to an effect on eustatic sea level. For Larsen B, the north-
ernmost surviving part of Larsen Ice Shelf, the retreat of the ice front to October 2000 is
documented.
INTRODUCTION
Knowledge of the sensitivity of ice streams andoutlet glaciers
to changes in the ice shelves into which they drain is of
importance for estimating the effects of climate change on
ice-sheet behaviour (Bentley,1998). Frictional drag along the
sides and at local grounded parts of an ice shelf creates back
pressure which plays a role for the outflow of grounded ice
(Thomas,1973).The importance of this back pressure for the
stability of grounded ice is, however, a matter of debate
(Bindschadler,1993; Bentley,1998).
The region of northern Larsen Ice Shelf, Antarctic
Peninsula, offers the opportunity to study the response of
grounded ice after rapid disintegration of parts of the ice
shelf.Three sections of the ice shelf disintegrated completely
in a few years, following a period of retreat since the 1940s
which accelerated after 1975 (Rott and others,1996) (Fig.1).
The main part of the ice shelf in Larsen Inlet broke away
between March 1986 and November 1989 (Skvarca, 1993,
1994). The ice shelf in Prince Gustav Channel, and the ice
shelf between Seal Nunataks and Sobral Peninsula, called
Larsen A Ice Shelf, disappeared almost completely in early
1995 (Rott and others, 1996). The ice shelf between Jason
Peninsula and Seal Nunataks (Larsen B Ice Shelf) was sub-
ject to a major calving event in January 1995 and showed
significant further retreat after that event (Skvarca and
others, 1999; Rack and others, 2000). Under the present
climatic conditions this retreat seems to be irreversible
(Doake and others,1998; Scambos and others, 2000).
In this study we focus on the retreat of grounded glaciers
and possible impacts of ice-shelf disintegration, and provide
updated information on the ice-shelf extent up to 6 October
2000 based on synthetic aperture radar (SAR) amplitude
images. Interferometric pairs of SAR images from the
European Remote-sensing Satellite (ERS) from 1995 and
1999 (Table 1) provided the basis for investigating temporal
changes of ice-flow behaviour and for mapping the position
of the grounding line. Interferometry for satellite-borne
SAR has been widely applied for mapping motion of ice
sheets and glaciers, enabling measurements of surface dis-
placement between repeat-pass SAR images at millimetric
accuracy (Rosen and others, 2000). We used ERS-1/-2 SAR
tandem pairs, acquired at1day time difference, and applied
the assumption of surface-parallel flow for calculating the
velocities (Joughin and others, 1998). For velocity mapping
it is necessary to subtract the topographic phase in the inter-
ferograms (Joughin and others,1996).
Because the velocities were subject to temporal changes,
the topographic phase could not be derived from the inter-
ferograms by means of differential methods, but synthetic
topographic interferograms were generated using the
digital elevation model (DEM) of Ohio State University
with 200 m pixel spacing (Liu and others, 1999). Possible
errors of the DEM and deviations from the surface-parallel
flow assumption would cause errors in velocity of the main
ice streams of a few per cent maximum because their sur-
face slope is small. In addition, rock outcrops surrounding
the glaciers provide perfect control as reference for zero
velocity. A quantitative error estimate is presented later in
this paper for a profile on Drygalski Glacier. The ground-
ing line was mapped by using interferograms, assuming
that it is located near the line where the vertical displace-
ment due to tides in the transition zone from the shelf to
grounded ice becomes zero (Rack, 2000). This paper
focuses on the analysis of motion on grounded ice, where
tidal effects are negligible. The motion field on the ice
shelves and the methods for tidal corrections were
described in a previous paper, in which the interferometric
analysis is compared with field data and model calcu-
lations (Rack and others, 2000).
Annals of Glaciology 34 2002
# International Glaciological Society
277
2. CHANGES IN PRINCE GUSTAV CHANNEL AND
LARSEN INLET
The ice shelf in Prince Gustav Channel was separated from
the main ice shelf in the late1940s (Cooper,1997).The retreat
and disintegration between July 1992 and March 1997 was
documented by a series of ERS SAR images (Rott and
others, 1998). The main inflow to the ice shelf came from
SjÖgren and Boydell Glaciers which originate on Detroit
Plateau on the Antarctic Peninsula, with a total grounded
catchment area of 704 km2
. Atthe grounding zone this outlet
glacier was 6 km wide (Fig. 2). From interferogram No. 1
(28^29 October 1995) a value of 1.5 m d^1
was derived for
the magnitude of the velocity vector, jvj, in the centre of the
glacier at the grounding line.The orientation of the flowline,
which deviates only a few degrees from the ground range,
was taken into account for calculating jvj. The velocity on
the ice shelf previous to the break-up was determined by
means of image cross-correlation using Landsat Thematic
Mapper (TM) images (Rack and others, 1999). From the
TM image pair of 29 February 1988 and 5 November 1989
jvj ˆ 420 m a^1
(1.15 m d^1
) was derived at the ice shelf
10 km downstream of the grounding line.This lower velocity
in comparison to the velocity at the grounding line in 1995
can be at least partly explained by the wider cross-section at
the ice shelf. The velocities at the grounding zone could not
be determined from the Landsat images because no stable
features were found in this area.
Figure 2 shows the retreat of the SjÖgren^Boydell outlet
glacierbetween 26 August1993 and 6 October 2000.The posi-
tion of the grounding line was inferred from the tidal motion
apparent in interferogram No. 1. A large part of the ice shelf
broke away in summer 1992/93. The main disintegration took
Fig.1. ERS SARimage composite of northern Larsen Ice Shelf,
6 October 2000. Previous ice-front positions:1. 26 August1993;
2.30 January1995;3.25 April1998;4.18 November1998;5.5
August 1999. D-B-E, Dinsmoor^Bombardier^Edgeworth
Glaciers; P-G, Prince Gustav Channel; R, Ro« hss Bay; S-B,
SjÖgren^Boydell Glaciers; S-N, Seal Nunataks. Boxes show
location of Figures 2 and 3. ERSSARdata ß European Space
Agency (ESA) (2000).
Table 1. ERS-1/-2 interferograms used in the study (frames
4941and 4923)
No. Dates Satellite track B? Ha
m m
1 28^29 October1995 381 31 328
2 31October^1November1995 424 26 392
3 16^17 November1995 152 330 31
4 9^10 November1999 424 153 66
Notes: B? is the perpendicular baseline and Ha the altitude of ambiguity.
Fig. 2. ERS-2 SAR image of the terminus of SjÖgren (S) and
Boydell (B) Glaciers acquired on 6 October 2000. Positions
of the ice front from SAR images: 1. 26 August 1993; 2. 30
January 1995; 3. 8 March 1995; 4. 10 February 1996; 5. 30
January 1998; 6. 31 January 1999; 7. 6 October 2000. P-G,
Prince Gustav Channel. The black line between positions 3
and 4 corresponds to the grounding line in October 1995.
ERS SAR data ß ESA (2000).
Rott and others: Further retreat of northern Larsen Ice Shelf
278
3. place in January 1995 (Rott and others, 1996), leaving only
3 km of floating ice in front of the glacier. The retreat of
grounded ice started in summer 1995/96, amounting to 4.5 km
in distance and 24km2
in area to October 2000. In the image
of 6 October 2000 the ice front is as close as 1500m to the
mountain ridge between SjÖgren and Boydell Glaciers, which
suggests that the two glaciers will soonbe separated.
The ice retreat coincided with an acceleration of the ice
flow. In the available interferometric pair No. 4 from 1999
the ice front is outside the image swath, which covers only
the upper part of the glacier. Comparison of the velocities
between 1995 (interferogram No. 2) and 1999 (interfero-
gram No. 4) shows strong acceleration of the glacier. For
example,9 km above the 1999 front the velocity accelerated
by a factor of 2 (from 0.4 m d^1
to 0.8 m d^1
) at the central
flowline of SjÖgren Glacier.
Afterthe collapse in1995, a small ice shelf was left inRo« hss
Bay on the west coast of James Ross Island, with an area of
159km2
(Rott and others, 1998). In this part of the ice shelf
the flow velocities were much lower than in the part which
was nourished from the Antarctic Peninsula (Rack and
others,1999). The area of the ice shelf in Ro« hss Bay, analyzed
in a sequence of SAR images, showeda gradualdecrease since
1995, the remnant amounting to an area of 47km2
on 6
October 2000. At this side of Prince Gustav Channel, so far
no grounded ice has been affected by the retreat.
The ice shelf at Larsen Inlet, a bay about 25 km long and
15 km wide, covered an area of 407km2
in1986, including the
bay and a small area east of it. The ice shelf disappeared
almost completely by 1989 (Skvarca,1993).The retreat of the
outlet glacier during recent years has been less pronounced
than for the other main glaciers in this region, possibly due
to the steeper topography. By 6 October 2000 the small rem-
nant floating part disappeared and the ice front retreated
0.5 km beyond the original grounding line. The main outlet
glacier to Larsen Inlet drains a grounded area of 450km2
.
At the centre of the glacier in the grounding zone a velocity
jvj ˆ 1.8 m d^1
was derived from interferogram No. 2 (31
October^1 November 1995), assuming surface-parallel
motion and accounting for the angle between the ice-flow
direction and radar illumination. Considering the size of the
glacier and the width of the terminus, the magnitude of the
velocity seems to be rather high, which might indicate accel-
eration in previous years, related to the disintegration of the
ice shelf. However, no velocity data are availablebefore1995.
RETREAT AND ACCELERATION OF DINSMOOR^
BOMBARDIER^EDGEWORTH GLACIERS AND DRY-
GALSKI GLACIER
The main ice inflow to Larsen A was through Drygalski
Glacier, which in 1995 covered a grounded drainage basin of
984km2
, and Dinsmoor^Bombardier^Edgeworth (D-B-E)
Glaciers with a groundedbasin of 681km2
(Fig.1).The section
between these two outlet glaciers includes a number of smal-
ler and steeper glaciers, with a groundedarea of 622 km2
.The
outlet glaciers D-B-E and Drygalski Glacier are character-
ized by comparatively high velocities. From interferogram
No. 2 (October 1995) the velocity, jvj, in the centre of the
6 km wide front of D-B-E glaciers was 2.9 m d^1
. This high
velocity suggests that there may already have been an
increase after the collapse of Larsen A.
Until 6 October 2000 about 34 km2
of grounded ice were
lost at D-B-E glaciers, and the distance of the front from the
original grounding line was 6.5 km. Whereas interferometric
pair No.2 from1995 shows highcoherence all over the glacier,
inpair No.4 from1999 goodcoherence is observed onlyon the
upper parts of the glacier.The comparison shows clear accel-
eration of the ice flow from1995 to1999, decreasing in magni-
tude with increasing distance from the ice front. On the lower
terminus the coherence is poor in the 1999 interferogram,
probably due to heavy crevassing related to the retreat. On
this part of the glacier the motioncouldbe analyzedby means
of speckle tracking (Gray and others, 2000). At the central
flowline 2 km above the 1999 ice front the velocity, jvj, accel-
erated from1.5 m d^1
in1995 to 6 m d^1
in1999.
For Drygalski Glacier the changes of the velocity field
between 1995 and 1999 are shown in detail. By October 1995
the floating ice had disappeared, and the front had retreated
up to 5 km into grounded ice by 6 October 2000, with a
decrease of grounded area of 24km2
. Drygalski Glacier can
be separated into different zones (Fig. 3). The narrow ice
plateau above the escarpment, which surrounds the main
part of the glacier below the ice cliffs in a semicircle, amounts
to about 25% of the glacier area.The radar reflectivity of the
ice plateau is relativelylowand stable throughthe wholeyear,
indicating permanently dry snow. The parts of the glacier
below the escarpment belong to the percolation zone, as
evidenced by the high reflectivity which is characteristic for
refrozen firn (Rott and others, 1993). The main part of the
glacier extends across a broadbasin with smooth topography
below the cliffs. The ice from this basin is routed through an
outlet glacier that is about 20 km long and 10 km wide. The
direction of ice flow in the basin variesby 490 which makes
interpretation of the interferograms difficult.The main tribu-
tary from the north, for example, flows almost parallel to the
satellite path. Motion in this direction cannot be detected by
means of across-track interferometry. The flow direction at
Fig. 3. Image of velocity difference (in colours) of Drygalski
Glacier.Velocity component (in across-track direction at the
surface) of interferograms No. 4 (9^10 November 1999)
minus No. 2 (31 October^1 November 1995). Background:
ERS SAR amplitude image of 1 November 1995. A, B, posi-
tion of velocity profiles shown in Figure 4.W, mentioned in the
text. Dashed line is approximate ice divide.
279
Rott and others: Further retreat of northern Larsen Ice Shelf
4. the terminus, on the other hand, is almost perpendicular to
the satellite path, providing good sensitivity for interfero-
metric motion analysis.
The main results are based on the interferograms of 31
October^1 November 1995 (No. 2) and 9^10 November 1999
(No. 4). In order to derive the motion, the topographic phase
was subtracted by means of a synthetic interferogram calcu-
lated from a DEM as explained in the introduction. In order
to estimate the impact of DEM errors on the motion analysis,
we calculatedthe velocities at profileA (Fig.3) withthe given
DEM and with an increased topographic gradient corres-
ponding to a total elevation difference of 50m along the
profile which is 18 km long and covers a total height range of
450 m. In this case the gradient of the velocity along the
whole profile would decrease by 1cm d^1
for interferogram
No. 2 and 6 cm d^1
for interferogram No. 4, which is only
about 0.4% and 2.3%, respectively, of the velocity difference
in 1995 (3.3 m d^1
at the front, decreasing to 0.7 m d^1
at the
top of the profile). In interferogram No. 2, possible errors of
the DEM play a smaller role because of the short interfero-
metric baseline, corresponding to an elevation difference of
392 m per 2º phase cycle (Table1). In particular on the outlet
glacier, where the surface is relatively flat and the velocities
are high, possible errors of the DEM would result in velocity
errors which are about two orders of magnitude below the
observed values in any of the availableinterferograms.
After subtraction of the topographic phase and phase
unwrapping, motion images were compiled for the velocity
component in ground range.The comparison reveals a clear
increase of velocity between 1995 and 1999 for the glacier
below the escarpment. The individual motion maps, as well
as Figure 3, showing the difference of velocity in ground
range between 1995 and 1999, confirm that the acceleration
of the ice mass was initialized at the front. The SAR image
pair of November1999 decorrelates on the lowest 6 km of the
terminus, probably because of the high velocity and shear
related to the acceleration of the glacier. The SAR images
as well as observations from airplanes reveal a significant
increase of crevasses in that area since 1995.
A detailed plot is presented in Figure 4, showing magni-
tudes of the velocity vector along the central flowline of the
terminus, starting 17 km upstream of the ice front in 1995
(profile A), and along a transverse profile (profile B). Above
the starting point of profile A the ice flow comes from many
different directions, which complicates interpretation of the
interferogram. The interferogram in 1995 allows determin-
ation of the velocity downto the ice front where a maximum
velocity of 3.3 m d^1
is observed. Four kilometres upstream
of the front, near the narrowest part of the outlet glacier
(about 7 km wide), is a secondary maximum below which
the glaciers widens. About 1km downstream of this maxi-
mum is a local minimum. The increase of velocity down-
stream of this secondary minimum in the profile for
October 1995 suggests that there may already have been
some acceleration in response to the loss of the ice shelf in
front of the glacier 9 months previously. A strong velocity
gradient is observed for the lowest 7 km of the profile, which
might indicate the onset of stream-flow with increasing
basal sliding in the channelized part of the glacier.
At the first point where the velocityanalysis is possible in
profile A in the 1999 interferogram, the velocity of Novem-
ber 1999 exceeds that of October 1995 by a factor of 2.9. At
the upstream end of profile A this factor is 2.6 (Fig. 4).
Further upstream the increase is also clearly pronounced,
as for example at pointW (Fig. 3) on the western tributary,
where the velocity was 0.31m d^1
in 1995 and 0.52 m d^1
in
1999. No information can be derived for the northern tribu-
tary because the flow direction is almost in the along-track
direction of the satellite.
A crude estimation of the actual ice transport across the
front is possible by extrapolating the bathymetric data which
were measured near the front in May 2000 (Domack and
others, 2001). Assuming a mean ice thickness of 500 m from
the bathymetric data, and the mean velocity at the front
amounting to 80% of the maximum velocity under the
assumption of full basal sliding, the transport through the
8.5 km wide frontal cross-section would be 11.26106
m3
d^1
(4.106109
m3
a^1
) in October 1995. For an ice density of 910
kgm^3
a mean annual net accumulation of 3781kgm^2
a^1
over the entire drainage basin would be needed to achieve a
balanced mass budget.
There are no accumulation measurements available at
Drygalski Glacier. The closest measurements were made at
various stakes 30 km to the south on Larsen Ice Shelf, near
Pedersen Nunatak.The total net accumulation of the 10 year
period 1978^88 was 260 cm of firn which was partly trans-
formedto ice. In recent yearsthe surface mass balancein this
areawas negative. However, these datacannotbe considered
Fig. 4. Magnitude of the velocity vector along profiles on Dry-
galski Glacier (position shown in Fig. 3) derived from ERS
interferometric pairs of 31October^1November 1995 and 9^10
November 1999. A, longitudinal profile (west^east); B, trans-
verse profile (north^south).
Rott and others: Further retreat of northern Larsen Ice Shelf
280
5. representative for the Drygalski catchment basin. According
to the mean accumulation data for the Antarctic Peninsula,
compiled from a sparse dataset (Peel, 1992), the accumu-
lation rate at an elevation of 970 m, the mean elevation of
the catchment, is 840 kgm^2
a^1
. This value should be a rea-
sonableestimate for the mean net accumulationof Drygalski
Glacier, because onthe one handthe accumulationonthe east
coast is clearly lower than the average, andon the other hand
the glacier is located in the northern part of the Antarctic
Peninsulawhere accumulationis abovethe average. Eventak-
ing into account significant uncertainty of the accumulation,
the exportatthe glacier front is much larger thanthe accumu-
lation estimate, suggesting that the glacier was strongly out of
balance in October 1995, and even more in1999.
CHANGES OF LARSEN B
The retreat of Larsen B, which is now the northernmost
part of Larsen Ice Shelf, has been documented up to 1998
using SAR data (Rott and others,1998; Skvarca and others,
1999) and until March 2000 using U.S. National Oceanic
and Atmospheric Administration (NOAA) AdvancedVery
High Resolution Radiometer (AVHRR) data (Scambos
and others, 2000). We analyzed further SAR data up to
October 2000 and studied also the velocities on the ice shelf
and on the outlet glaciers by means of interferometry and
field data. After the calving event in 1995, an increase of ice
velocity on the shelf by several per cent was observed, which
was more pronounced close to the front due to the opening
of rifts (Rack, 2000). So far we cannot detect any significant
changes of velocity on the outlet glaciers.
Recent values for the ice-shelf area are listed inTable 2
together with selected previous data. Compared to a pre-
vious analysis the values up to 25 April 1998 are smaller by
320 km2
, because the re-analysis of the grounding line using
interferograms indicated a slightly different position in
some parts of the ice shelf than the previous analysis which
had been based on optical images (Rack,2000).Whereas the
slowly moving part of the ice shelf around Seal Nunataks,
which is separated from Larsen B by a zone of strong shear
and rifts (Skvarca,1994; Rack and others,1999,2000), shows
little change, the main part of Larsen B has decreased by
40% sinceJanuary1995.
The retreat between 30 January 1995 and 25 April 1998
was not very significant andaffected mainly the northern part
of the ice front. Inthe image of 25 April1998, several long rifts
are visible parallel to the front (Skvarca and others, 1999). A
major calving event took place in November 1998, which
resulted in significant retreat all along the ice front between
Robertson Island andJason Peninsula.The comparison of the
front with model calculations of stability of Larsen B indicates
that in this position the ice shelf may already have been in a
phase of irreversible retreat (Doake andothers,1998). Between
November 1998 and October 2000 the area decreased by
another 1000km2
, with the main loss on the northern half of
the ice shelf. This retreat coincides with a temperature rise
which continued up to 2000.The mean annualtemperature in
1999 was the warmest of the 48year record for Esperanza and
of the 30year record for Marambio. The 1999/2000 mean
summer temperature for Esperanza was the highest of the
record, and for Marambio it was also clearly above average.
CONCLUSION
The analysis of satellite data shows significant changes of the
outlet glaciers which prior to 1995 nourished the sections of
Larsen Ice Shelf north of Seal Nunataks. The ice front of
most of the glaciers retreated inlandof the former grounding
lines.The velocity of the largest outlet glaciers in this region
(Drygalski Glacier, D-B-E glaciers, SjÖgren and Boydell
Glaciers) increased significantly after the ice shelf in front
brokeaway. Also most of the smaller glaciers show clear signs
of break-up. Due to the chaotic nature of their surface, the
main parts of the small glaciers are incoherent in the 1999
interferometric data, so that surface motion cannot be
derived. In the SARamplitude images, many more crevasses
are apparent in1999 than in 1995.
The rapid retreat of Larsen B, currently the northern-
most part of Larsen Ice Shelf, continued to 2000. This con-
firms that the present ice-front configuration is no longer
stable.The trend of regional climatic warming at the north-
eastern part of the Antarctic Peninsula and probably also
the greater proximity to the ocean after the collapse of the
ice shelf north of Seal Nunataks, causing changes of the ice/
ocean/air energy transfer, favouredthe retreat. So far no sig-
nificant acceleration has been observed on the glaciers flow-
ing into Larsen B. The observations on Larsen A suggest
that glaciers accelerate if the ice shelf in front disappears
more or less completely. If the retreat of Larsen B continues,
there will be opportunity to verify this hypothesis.
Comparing Landsat images of 1974 and 1989, Vaughan
(1993) did not observe any significantchanges in the flowbeha-
viourofthe variousoutlet glaciers fromtheAntarcticPeninsula
during the break-up of Wordie Ice Shelf, but in 1989 remnants
of the ice shelf still filled the bays in front of the main ice
streams. Our observations suggest significant sensitivity of
glacier flux to ice-shelf back pressure at the Larsen A and
Prince Gustav Channel ice shelves. Rapid acceleration and
retreat of the outlet glaciers after complete removal of the ice
shelves seem to be the rule in this region, suggesting that the
removal of ice shelves could lead to an effect on eustatic sea
level through the impact on the grounded outlet glaciers.
ACKNOWLEDGEMENTS
This work is a contribution to the Austrian Science Fund
(FWF) Project No. 12923 GEO and the Larsen Ice Shelf
Project of Instituto Anta¨ rtico Argentino, Direccio¨ n Nacional
del Anta¨ rtico. The ERS SAR data were kindly made avail-
able by ESA for the experiment AO3.A108 (VECTRA). We
Table 2. Area of Larsen B south of Seal Nunataks, derived
from selected SAR images
Date Area
km2
26 August 1993 11466
30 January1995 9192
25 April 1998 9022
18 November1998 7829
22 February 1999 7639
5 August 1999 7198
6 October 2000 6831
281
Rott and others: Further retreat of northern Larsen Ice Shelf
6. are grateful for the careful review by D. Vaughan and M.
Frezzotti, and the useful suggestions of the scientific editor,
N.Young, which helped to improve the manuscript.
REFERENCES
Bentley, C. R.1998. Rapid sea-levelrise from aWest Antarctic ice-sheetcol-
lapse: a short-term perspective. J. Glaciol., 44(146),157^163.
Bindschadler, R. 1993. Siple Coast Project research of Crary Ice Rise and
the mouths of Ice Streams B and C, West Antarctica: review and new
perspectives. J. Glaciol., 39(133), 538^552.
Cooper, A. P. R. 1997. Historical observations of Prince Gustav Ice Shelf.
Polar Rec., 33(187), 285^294.
Doake, C. S. M., H. F. J. Corr, H. Rott, P. Skvarca and N.W. Young. 1998.
Breakup and conditions for stability of the northern Larsen Ice Shelf,
Antarctica. Nature, 391(6669),778^780.
Domack, E.W. and 8 others. 2001. Cruise reveals history of Holocene Larsen
Ice Shelf. Eos, 82(2),13^17.
Gray, A. L., K. E. Mattarand N. Short.2000. Speckletracking for 2-dimen-
sional ice motion studies in polar regions. In ESA Fringe ’99Meeting, 10^12
November 1999, Liege, Belgium. Proceedings. Noordwijk, European Space
Agency, CD-ROM. (ESA Special Publication SP-478.)
Joughin, I., D. Winebrenner, M. Fahnestock, R. Kwok and W. Krabill. 1996.
Measurement of ice-sheet topography using satellite-radar interferometry.
J. Glaciol., 42(140),10^22.
Joughin, I. R., R. Kwok and M. A. Fahnestock.1998. Interferometric esti-
mation of three-dimensional ice-flow using ascending and descending
passes. IEEE Trans. Geosci. Remote Sensing, GE-36(1), 25^37.
Liu, H., K. C. Jezek and B. Li. 1999. Development of an Antarctic digital
elevation model by integrating cartographic and remotely sensed data:
a geographic information system based approach. J. Geophys. Res.,
104(B10), 23,199^23,213.
Peel, D. A. 1992. Spatial temperature and accumulation rate variations in the
Antarctic Peninsula. In Morris, E. M., ed.The contribution of Antarctic Penin-
sula ice to sea level rise. Cambridge, British Antarctic Survey. Commission of
the European Communities Project EPOC-CT90-0015,11^15. (Report1.)
Rack,W. 2000. Dynamicbehaviouranddisintegrationof the northern Larsen
Ice Shelf, Antarctic Peninsula. (Ph.D. thesis, University of Innsbruck.)
Rack,W., H. Rott, A. Siegel and P. Skvarca.1999. The motion field of north-
ern Larsen Ice Shelf, Antarctic Peninsula, derived from satelliteimagery.
Ann. Glaciol., 29, 261^266.
Rack, W., C. S. M. Doake, H. Rott, A. Siegel and P. Skvarca. 2000. Inter-
ferometric analysis of the deformation pattern of the northern Larsen
Ice Shelf, Antarctic Peninsula, compared to field measurements and
numerical modeling. Ann. Glaciol., 31, 205^210.
Rosen, P. A. and6 others.2000. Synthetic aperture radar interferometry. Proc.
IEEE, 88(3), 333^385.
Rott, H., K. Sturm and H. Miller. 1993. Active and passive microwave
signatures of Antarctic firn by means of field measurementsand satellite
data. Ann. Glaciol., 17, 337^343.
Rott, H., P. Skvarca andT. Nagler.1996. Rapidcollapse of northern Larsen
Ice Shelf, Antarctica. Science, 271(5250),788^792.
Rott, H., W. Rack, T. Nagler and P. Skvarca. 1998. Climatically induced
retreat and collapse of northern Larsen Ice Shelf, Antarctic Peninsula.
Ann. Glaciol., 27, 86^92.
Scambos,T. A., C. Hulbe, M. Fahnestock and J. Bohlander. 2000.The link
between climate warming and break-up of ice shelves in the Antarctic
Peninsula. J. Glaciol., 46(154), 516^530.
Skvarca, P.1993. Fast recessionof the northern Larsen Ice Shelf monitored
by space images. Ann. Glaciol., 17, 317^321.
Skvarca, P.1994.Changes and surface features of the Larsen Ice Shelf, Antarc-
tica, derived from Landsat and Kosmos mosaics. Ann.Glaciol., 20, 6^12.
Skvarca,P.,W. RackandH. Rott.1999.34 yearsatellitetime seriesto monitor
characteristics, extent and dynamics of Larsen B Ice Shelf, Antarctic
Peninsula. Ann. Glaciol., 29, 255^260.
Thomas, R. H. 1973. The creep of ice shelves: interpretation of observed
behaviour. J. Glaciol., 12(64), 55^70.
Vaughan, D.G.1993. Implications of the break-up of Wordie Ice Shelf, Ant-
arctica for sea level. Antarct. Sci., 5(4), 403^408.
Rott and others: Further retreat of northern Larsen Ice Shelf
282