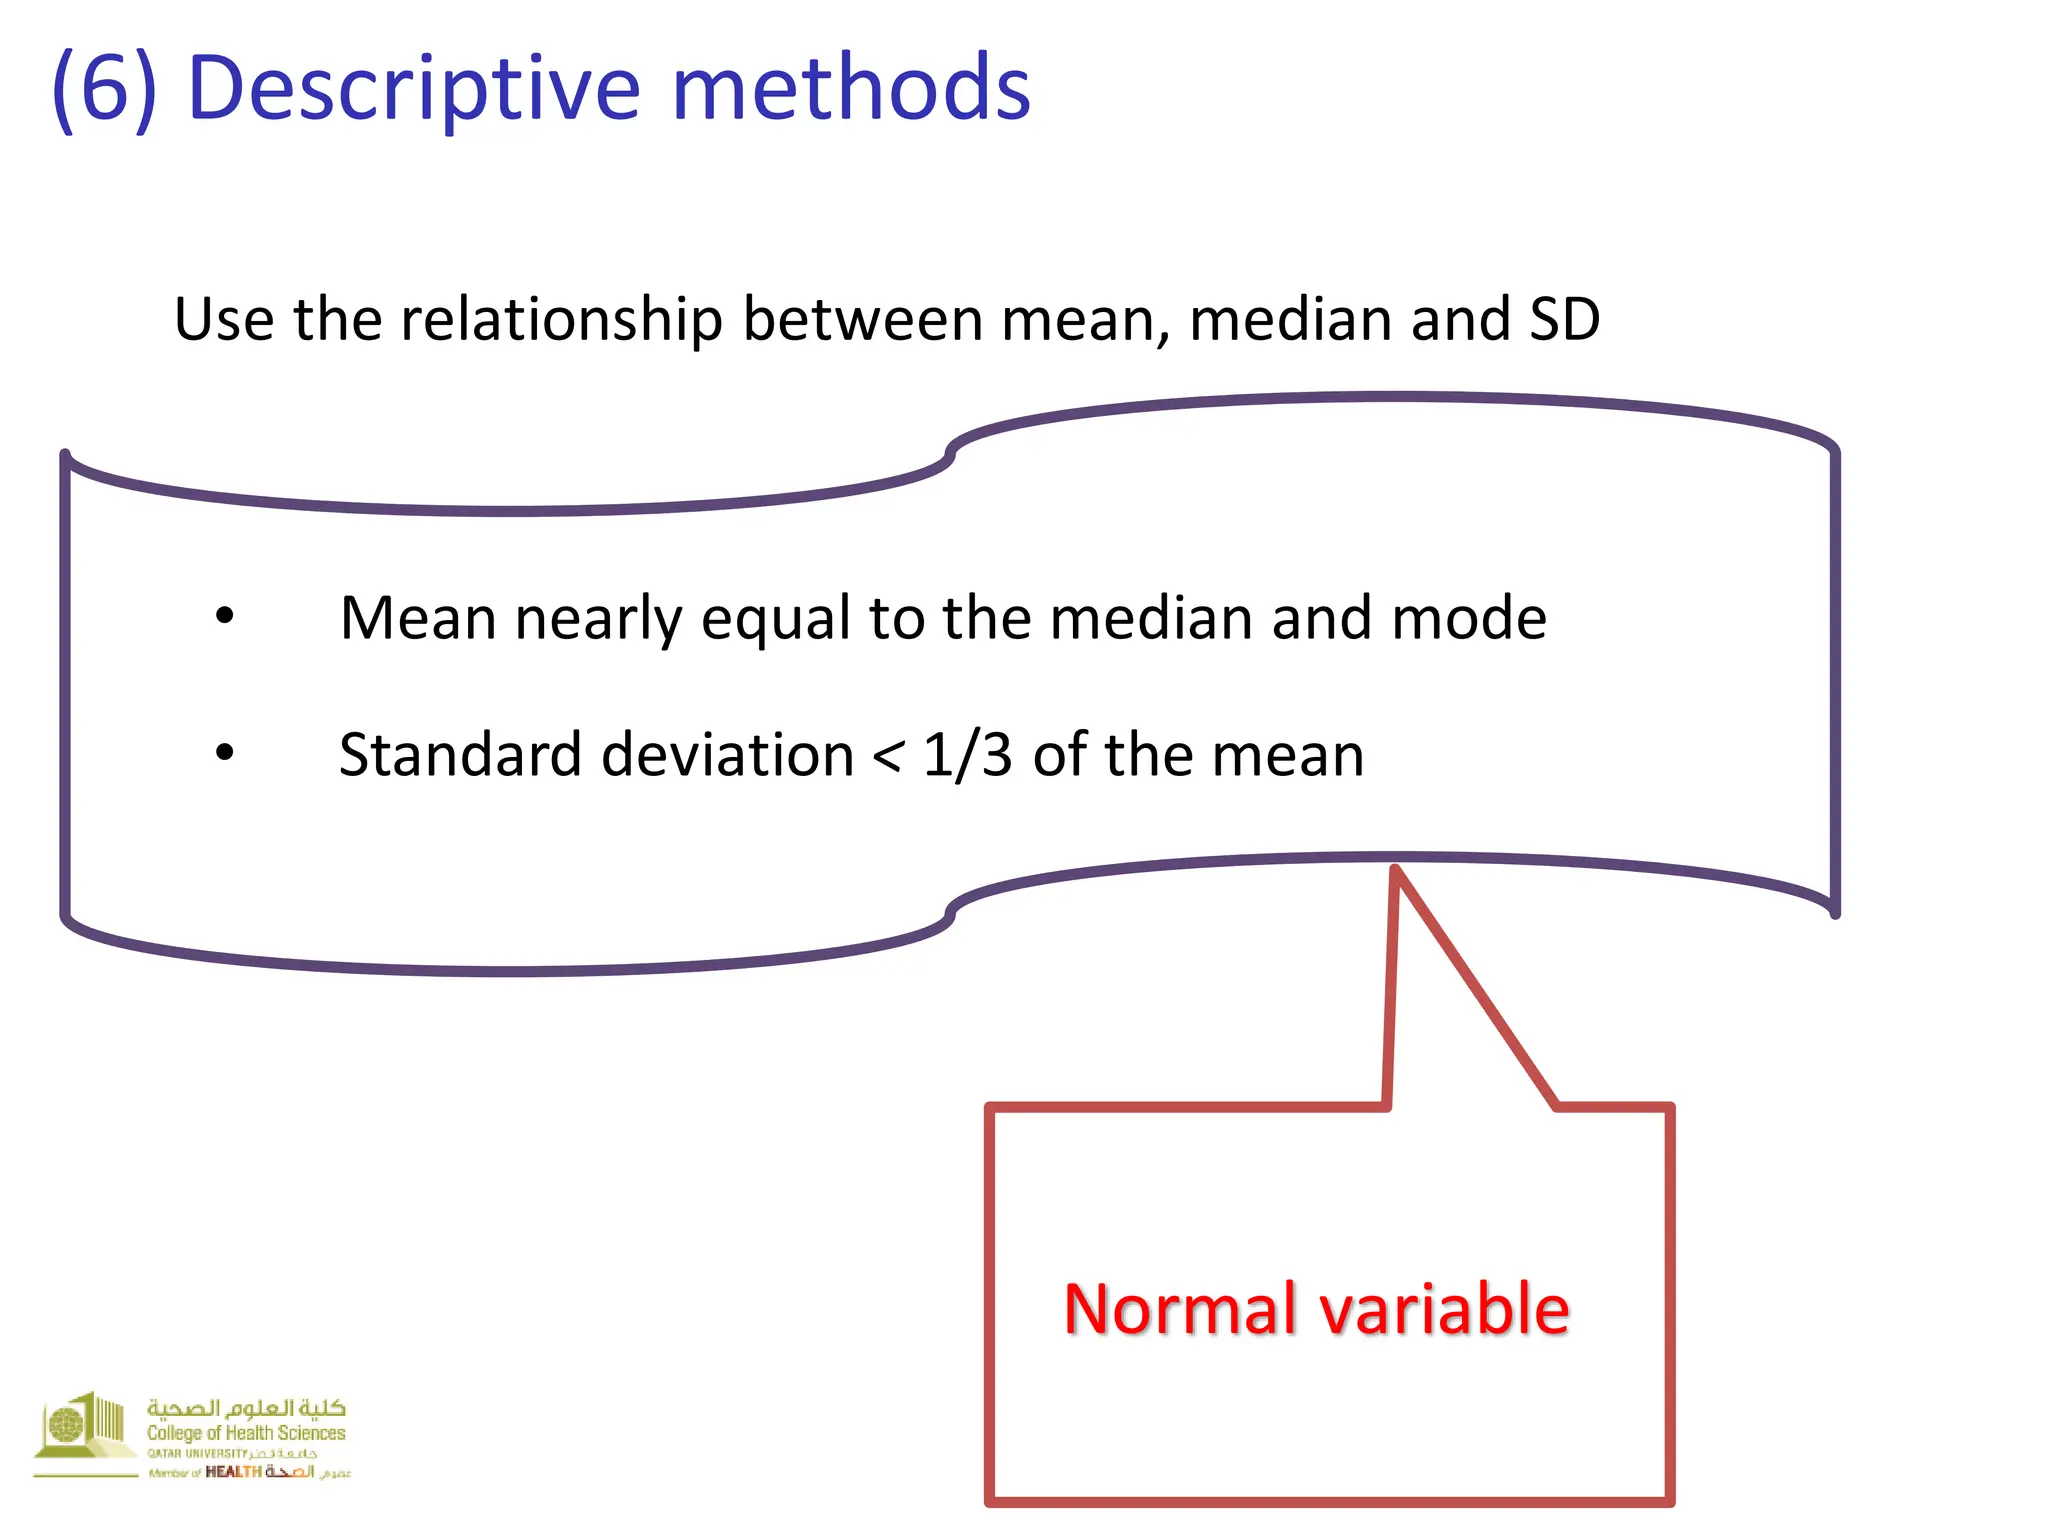
This document outlines a lecture on the normal distribution. It begins by recapping graphical summaries of data and stating the objectives of exploring the importance of the normal distribution, its properties, the standard normal curve, and assessing normality. Key points covered include that the normal distribution is important in statistical analysis, has properties like symmetry and equal mean/median/mode, and can be assessed visually with histograms and Q-Q plots or statistically with tests like Kolmogorov-Smirnov and Shapiro-Wilk. Examples are provided to demonstrate computing z-scores and relating data to the standard normal curve.