- The study examined the relationship between specialist physician supply and mortality rates using county-level data from 1996-2000 in the United States.
- They found that higher ratios of primary care physicians were associated with lower mortality rates for total, heart disease, and cancer mortality. However, higher ratios of specialist physicians showed no improvement or even higher mortality rates.
- These findings suggest that simply increasing the supply of specialists will not necessarily improve population health outcomes and could worsen health disparities.
Closer look at stroke in maine for maine stroke alliance 2019 finalGillian Gordon Perue
Presented to the leadership of the State of Maine; this presentation describes the epidemiology of patients admitted with stroke in Maine from 2010-2014. It exams independent predictors of mortality.
Pregnant women with anxiety and other mood disorders more likely to report us...Δρ. Γιώργος K. Κασάπης
Reinforcing previous data on the subject, a new study of pregnant women in California finds that those who have anxiety and other mental health disorders are most likely to also reporting cannabis use during their pregnancy. Looking at data from nearly 200,000 pregnancies across Kaiser Permanente Northern California health facilities, researchers found that 6% of the women self-reported cannabis use while pregnant. Those who said they used cannabis were, on average, younger than 25, Hispanic, and twice as likely to have anxiety, depression, or both these disorders. Although California's laws permit recreational and medicinal marijuana use, physicians are still contending with how best to talk to women about pot use during pregnancy.
Presentation on Patient Safety Measurement for visitors from Sweden in 2007Noel Eldridge
This presentation was put together on the special topic of measurement when a group from Sweden was visiting the Dept of Veterans Affairs National Center for Patient Safety to learn about patient safety improvement programs underway there. I remember some of the people listening resisting my main point that so far there was no good way to measure PS outcomes, but some good ways to measure important outcomes that are potential precursors to patient safety problems (like not getting X-rays verified in a timely way).
Triglytza: Counter-Regulation of RAAS and COVID-19 TreatmentRavi Kumar, Ph.D.
TriGlytza is a proprietary dual combination product of ARKAY Therapeutics. It is custom-designed for treatment and mitigation of ARDS and MODS associated with COVID-19.
Familial Mediterranean Fever (FMF) is an autoinfl ammatory disease caused by mutations in the MEFV
gene and characterized by recurrent fever, polyserositis and arthritis. It is transmitted in an autosomal
recessive pattern. FMF has been predominantly found in ethnic groups living around the Mediterranean
basin (Jews, Arabs, Turks, and Armenians). Although accompanying infl ammatory diseases have been
reported in FMF, the coexistance of fi bromyalgia syndrome (FMS) is very rare. MEFV gene analysis that the
fi rst patient had compound heterozygous mutation (M680I+V726A) and the other patient had heterozygous
mutation (M694V). This association will be discussed in this case report.
Methylenetetrahydrofolate Reductase Gene (MTHFR_677CT) Associated with the de...ijsrd.com
Globally, Depression is widespread neuropsychiatric disorders affecting around 5% of the population and has been described as millennia linked with neurobiology showing association with direct neuro-chemicals and biochemical incredible factors, interact with "gene-gene", "gene-environment" as long as a scaffold potential for better exploration. The aetiology of depression is still unknown but believes to be the interaction between gene and environment including some of the other factors responsible for development of depression. The PCR-RFLP analysis of MTHFR (C677T) gene showed 0.45% in CT (heterozygous) genotype in patients of depression in comparison to controls (0.15%), suggesting increased risk of depression in those individuals. However, the odd ratio was also calculated at 95% confidence interval for MTHFR C677T gene which revealed non- significant difference between cases and control, may be because of small sample size.
There was a time when Man was the son of nature, interacting and part of the whole process of life. Then, as his fate, man progressed, invented, produced, flourished and finally prevailed on earth. He created artificial systems in which he lived, and at times seemed so close to being protected and safe from any natural phenomenal impact. Then he realized that his own creation, byproducts, beside his aggression against his own kind were being his enemy. In recent years, disasters increased in frequency, where grade 4 or more, hurricanes attacked the southern parts of the USA, as well in Asia. Large ice bergs cracked in Greenland, North and South poles, dissolving in the sea. There is an increase or rise of the Sea level, although it is few cms a year but it became a reality
https://crimsonpublishers.com/eaes/fulltext/EAES.000501.php
For more open access journals in Crimson Publishers
Please click on link: https://crimsonpublishers.com
For More Articles on Environmental Analysis & Ecology Studies
Please click on: https://crimsonpublishers.com/eaes/
Presentation from the 2016 International Conference on Aging in the Americas hosted at the University of Texas at San Antonio Downtown Campus, Sept. 14-16.
The Use of Artificial Neural Network and Logistic Regression to Predict the I...Crimsonpublisherscojnh
The Use of Artificial Neural Network and Logistic Regression to Predict the Influence of Lifestyle on Cardiovascular Risk Factors by Jahandideh S*, Jahandideh M, Asefzadeh S and Ziaee A in COJ Nursing & Healthcare
Factors affecting mortality in burns: a single center studyKETAN VAGHOLKAR
Background: Burns injury continues to be the greatest challenge to the trauma surgeon. A multitude of factors determine the mortality in burns patients. The present study aims at identifying those factors which have a significant impact on mortality in burns patients.
Methods: A total 80 patients presenting with burns injury were studied prospectively. Various factors which included age, sex, aetiology, mode of injury, total body surface area which is burnt (BSA), duration of stay, time interval up to admission, pregnant state, inhalation injury, systemic complications, wound complications, and psychological impact were studied.
Results: The mean age was 24.07 years. 59 were females, 21 were males. 19 (23.75%) cases were suicidal in aetiology whereas the remaining 61(76.25%) were accidental. Flame injury was the most common mode of injury in 65 patients (81.25%). The mean BSA in the study was 53.5% whereas the mean BSA in those patients who expired was 71.4%. Mean duration of stay in hospital was 6.55 days whereas mean time interval between burns injury and admission to hospital was 101.33 minutes. All 12 pregnant women had spontaneous miscarriages with a mortality in 11 patients. Inhalation injury was seen in 49 patients (61%) with mortality of 42 (83.7%) patients. Systemic complications seen in 60 patients mortality and BSA was high in patients who had infection. 31 patients in the study had severe depression with a mortality of 91.32%. 50 out of the 80 patients studied expired.
Conclusions: Increased age, BSA, mode of injury, presence of inhalation injury, systemic complication, pregnant state, wound infection and depression had a significant impact on the mortality of burns patients.
Used for Medical Grand Rounds at several hospitals, this is data based comprehensive review of the shortcomings of the American Medical System and dysfunctional political attempts at reform. Single payer, Medicare for all, with elimination of for profit insurance companies is the best answer.
PRIVATE AGE ADJUSTMENTWhen analyzing epidemiologic dat.docxsleeperharwell
PRIVATE
AGE ADJUSTMENT
When analyzing epidemiologic data, researchers often wish to adjust for the influence of some variable so that the "true" effect of other variables can be seen more clearly. Consider the example of a study to determine if gray hair is related to mortality risk. Two statements stand out in this study:
1. People with gray hair have a higher death rate when compared to other people.
2. People with gray hair are older than others people.
Because of this second statement the meaning of statement one is obscure. The possible link between gray hair and mortality risk is confused by the effect of age on mortality risk. Age is considered a confounding factor that needs to be accounted for to accurately assess the impact of gray hair on mortality rates. Epidemiologists use many tools to sort through information and overcome this confusion of information by adjusting data. The purpose of data adjustment is to disentangle the relationship so that we can evaluate a variables effect free from confusion and distortion. For the gray hair investigation, adjustment would permit us to determine whether persons of the same age who have gray hair have different mortality risks. (Sempos 1989)
Confounding Variables
Confounding variables are variables whose effects confuse the true relationships between factors and diseases. This is why there is a need for data adjustment. In order for a variable to be considered a confounding variable, it must be related to the disease or condition of interest and to the risk factor being investigated (Miettinen 1970). But if the possible confounding variable is truly related only to the disease of interest, it may still be desirable to adjust for it (Mantel 1986). One reason is the adjustment could possibly reduce the sampling variance of the comparison that is being investigated.
Adjustments
A common example of data adjustment is the age adjustment of mortality rates. While the age adjustment technique is most often applied to mortality (death) rates, it could also be applied to incidence of disease, prevalence, or any other kind of proportional rates. Age adjustment allows comparison of mortality risk for various groups free from the distortion of one group having a different age distribution than another. There are two types of age adjustments in relation to mortality rates -- direct and indirect age adjustments.
Direct Adjustment
Direct adjustment, or direct standardization, is to superimpose the age distribution of a standard population on the two study groups to be compared. Standardized rates are then calculated for each population, making use of the standard age distribution. These adjusted rates are then compared, and any difference between them can no longer be due to difference in age distribution because age has been taken into account. The direct method uses two inputs called age-specific rates and standard population.
Age-Specific Rates
A set of age-specif.
This presents the trends, issues, and challenges in the Philippine Health Care Delivery System. The data were mostly taken from the Philippine Department of Health (DOH) website and DOH Region VI Office.
The goal of this webinar was to help healthcare professionals improve care coordination for patients with advanced illness and to reduce hospital readmissions and length of stay.
Deaths from fall-related traumatic brain injuries are on the rise in U.S.Δρ. Γιώργος K. Κασάπης
Deaths due to traumatic brain injuries from falls have risen in recent years, according to new CDC data. Here's more:
•Overall trends: From 2008-2017, the number of TBI-related deaths from falls increased 17%, leading to more than 17,400 such deaths in 2017.
•Demographics: In 2017, the rate of such deaths was highest in males and in people aged 75 and older. In fact, the death rate in this age group was eight times more than for those 55-74.
•Implications: Given the study's findings, and the aging population in the U.S., health care providers ought to educate the elderly and their families about the risk of falls, the report authors conclude.
Copyright 2016 American Medical Association. All rights reservAlleneMcclendon878
Copyright 2016 American Medical Association. All rights reserved.
Association Between Rotating Night Shift Work and Risk
of Coronary Heart Disease Among Women
Céline Vetter, PhD; Elizabeth E. Devore, ScD; Lani R. Wegrzyn, ScD; Jennifer Massa, ScD; Frank E. Speizer, MD;
Ichiro Kawachi, MD, ScD; Bernard Rosner, PhD; Meir J. Stampfer, MD, DrPH; Eva S. Schernhammer, MD, DrPH
IMPORTANCE Prospective studies linking shift work to coronary heart disease (CHD) have
been inconsistent and limited by short follow-up.
OBJECTIVE To determine whether rotating night shift work is associated with CHD risk.
DESIGN, SETTING, AND PARTICIPANTS Prospective cohort study of 189 158 initially healthy
women followed up over 24 years in the Nurses’ Health Studies (NHS [1988-2012]:
N = 73 623 and NHS2 [1989-2013]: N = 115 535).
EXPOSURES Lifetime history of rotating night shift work (�3 night shifts per month in
addition to day and evening shifts) at baseline (updated every 2 to 4 years in the NHS2).
MAIN OUTCOMES AND MEASURES Incident CHD; ie, nonfatal myocardial infarction, CHD
death, angiogram-confirmed angina pectoris, coronary artery bypass graft surgery, stents,
and angioplasty.
RESULTS During follow-up, 7303 incident CHD cases occurred in the NHS (mean age at
baseline, 54.5 years) and 3519 in the NHS2 (mean age, 34.8 years). In multivariable-adjusted
Cox proportional hazards models, increasing years of baseline rotating night shift work was
associated with significantly higher CHD risk in both cohorts. In the NHS, the association
between duration of shift work and CHD was stronger in the first half of follow-up than in the
second half (P=.02 for interaction), suggesting waning risk after cessation of shift work.
Longer time since quitting shift work was associated with decreased CHD risk among ever
shift workers in the NHS2 (P<.001 for trend).
Baseline History of Rotating Night Shift Work P Value
for
TrendNone <5 y 5-9 y ≥10 y
NHS cohort
CHD incidence ratea 425.5 435.1 525.7 596.9
HR (95% CI)b 1 [Reference] 1.02 (0.97-1.08) 1.12 (1.02-1.22) 1.18 (1.10-1.26) <.001
First half of follow-up
CHD incidence ratea 367.3 382.4 483.1 494.4
HR (95% CI)b 1 [Reference] 1.10 (1.01-1.21) 1.19 (1.03-1.39) 1.27 (1.13-1.42) <.001
Second half of
follow-up
CHD incidence ratea 436.6 424.8 520.7 556.2
HR (95% CI)b 1 [Reference] 0.98 (0.92-1.05) 1.08 (0.96-1.21) 1.13 (1.04-1.24) .004
NHS2 cohort
CHD incidence ratea 122.6 130.6 151.6 178.0
HR (95% CI)b 1 [Reference] 1.05 (0.97-1.13) 1.12 (0.99-1.26) 1.15 (1.01-1.32) .01
a Age-adjusted rates per 100 000 person-years.
b Multivariable-adjusted hazard ratio (HR).
CONCLUSIONS AND RELEVANCE Among women who worked as registered nurses, longer
duration of rotating night shift work was associated with a statistically significant but small
absolute increase in CHD risk. Further research is needed to explore whether the association
is related to specific work hours and individual characteristics.
JAMA. 2016;315(16):1726-1734. ...
Presentation by our Keynote Speaker, Leslie J. Kohman, MD at our Cancer Mission 2020 28th Congressional District Summit in Buffalo, NY. Dr. Kohman is the Professor of Surgery Medical Director at Upstate Cancer Center in Syracuse, NY.
Conferencia inaugural Congreso Asociación Andaluza de Cirujanos 2017trujillo40
El Dr.Joseantonio Trujillo compartió sus reflexiones sobre Medicina 3.0 y Branding Médico en la Conferencia inaugural Congreso Asociación Andaluza de Cirujanos 2017.
Palestine last event orientationfvgnh .pptxRaedMohamed3
An EFL lesson about the current events in Palestine. It is intended to be for intermediate students who wish to increase their listening skills through a short lesson in power point.
Students, digital devices and success - Andreas Schleicher - 27 May 2024..pptxEduSkills OECD
Andreas Schleicher presents at the OECD webinar ‘Digital devices in schools: detrimental distraction or secret to success?’ on 27 May 2024. The presentation was based on findings from PISA 2022 results and the webinar helped launch the PISA in Focus ‘Managing screen time: How to protect and equip students against distraction’ https://www.oecd-ilibrary.org/education/managing-screen-time_7c225af4-en and the OECD Education Policy Perspective ‘Students, digital devices and success’ can be found here - https://oe.cd/il/5yV
Ethnobotany and Ethnopharmacology:
Ethnobotany in herbal drug evaluation,
Impact of Ethnobotany in traditional medicine,
New development in herbals,
Bio-prospecting tools for drug discovery,
Role of Ethnopharmacology in drug evaluation,
Reverse Pharmacology.
Instructions for Submissions thorugh G- Classroom.pptxJheel Barad
This presentation provides a briefing on how to upload submissions and documents in Google Classroom. It was prepared as part of an orientation for new Sainik School in-service teacher trainees. As a training officer, my goal is to ensure that you are comfortable and proficient with this essential tool for managing assignments and fostering student engagement.
This is a presentation by Dada Robert in a Your Skill Boost masterclass organised by the Excellence Foundation for South Sudan (EFSS) on Saturday, the 25th and Sunday, the 26th of May 2024.
He discussed the concept of quality improvement, emphasizing its applicability to various aspects of life, including personal, project, and program improvements. He defined quality as doing the right thing at the right time in the right way to achieve the best possible results and discussed the concept of the "gap" between what we know and what we do, and how this gap represents the areas we need to improve. He explained the scientific approach to quality improvement, which involves systematic performance analysis, testing and learning, and implementing change ideas. He also highlighted the importance of client focus and a team approach to quality improvement.
The Roman Empire A Historical Colossus.pdfkaushalkr1407
The Roman Empire, a vast and enduring power, stands as one of history's most remarkable civilizations, leaving an indelible imprint on the world. It emerged from the Roman Republic, transitioning into an imperial powerhouse under the leadership of Augustus Caesar in 27 BCE. This transformation marked the beginning of an era defined by unprecedented territorial expansion, architectural marvels, and profound cultural influence.
The empire's roots lie in the city of Rome, founded, according to legend, by Romulus in 753 BCE. Over centuries, Rome evolved from a small settlement to a formidable republic, characterized by a complex political system with elected officials and checks on power. However, internal strife, class conflicts, and military ambitions paved the way for the end of the Republic. Julius Caesar’s dictatorship and subsequent assassination in 44 BCE created a power vacuum, leading to a civil war. Octavian, later Augustus, emerged victorious, heralding the Roman Empire’s birth.
Under Augustus, the empire experienced the Pax Romana, a 200-year period of relative peace and stability. Augustus reformed the military, established efficient administrative systems, and initiated grand construction projects. The empire's borders expanded, encompassing territories from Britain to Egypt and from Spain to the Euphrates. Roman legions, renowned for their discipline and engineering prowess, secured and maintained these vast territories, building roads, fortifications, and cities that facilitated control and integration.
The Roman Empire’s society was hierarchical, with a rigid class system. At the top were the patricians, wealthy elites who held significant political power. Below them were the plebeians, free citizens with limited political influence, and the vast numbers of slaves who formed the backbone of the economy. The family unit was central, governed by the paterfamilias, the male head who held absolute authority.
Culturally, the Romans were eclectic, absorbing and adapting elements from the civilizations they encountered, particularly the Greeks. Roman art, literature, and philosophy reflected this synthesis, creating a rich cultural tapestry. Latin, the Roman language, became the lingua franca of the Western world, influencing numerous modern languages.
Roman architecture and engineering achievements were monumental. They perfected the arch, vault, and dome, constructing enduring structures like the Colosseum, Pantheon, and aqueducts. These engineering marvels not only showcased Roman ingenuity but also served practical purposes, from public entertainment to water supply.
2. D ata Wat c h
based patient care in family medicine or general practice, general internal medi-
cine, and general pediatrics were considered primary care physicians because
prior data show that only these three fulfill the criteria for primary care practice.3
Other physicians were considered specialists.
For multivariate analyses, we performed pooled cross-sectional analyses (1996–
2000) using the mixed-model method (the SAS PROC MIXED procedure).4 This
allowed us to pool observations over several years, to increase the sample size.
Two different approaches examined the relationship between primary care and
specialist physicians and health. In the first, only the supply of primary care or
specialist physicians was used as a predictor of mortality indicators. The second
included an adjustment for population characteristics known to be associated
with higher mortality: per capita income; education; unemployment; location in a
metropolitan statistical area (MSA); and the percentages of the population that
are elderly, are African American, or have incomes below 100 percent of the federal
poverty level.
Study Results
Exhibit 1 contains mean values for each of the variables, along with standard de-
viations. During the time period there was a slight mean increase in total mortality
and a slight decrease in heart and cancer mortality. Per capita income rose, while
EXHIBIT 1
Description Of Study Variables, Examination Of Effect Of Specialist Supply On
Populations’ Health, 1996–2000
1996 1997 1998 1999 2000
Variable Mean SD Mean SD Mean SD Mean SD Mean SD
All-cause mortality 103.65 30.42 103.19 31.1 104.31 31.8 104.46 29.2 104.61 29.42
Heart mortality 20.93 8.33 20.84 8.41 20.78 8.47 20.73 8.57 20.7 8.32
Cancer mortality 23.18 6.22 23.06 6.31 22.98 6.41 22.92 6.51 22.48 6.24
Per capita income $18,951 4,903 $19,513 5,055 $20,991 5,527 $21,954 5,905 $21,954a 5,905
Percent high school
educationb 68.17% 14.08 68.17% 14.08 68.17% 14.08 68.17% 14.08 68.17% 14.08
Percent unemploy-
ment 6.02% 3.16 5.61% 3.01 5.27% 2.88 4.98% 2.76 4.76% 2.62
Percent elderly 14.77% 4.30 14.67% 4.26 14.73% 4.28 14.37% 4.41 14.37% 4.41
Percent African
American 9.17% 14.98 9.28% 15.06 9.37% 15.16 9.46% 15.25 8.74% 14.48
Percent below poverty 15.01%c 6.34 15.01% 6.34 14.67% 5.93 14.67%d 5.93 14.67%d 5.93
Percent in MSA 26.63% –e 26.63% –e 26.63% –e 26.63% –e 26.63% –e
SOURCE: National Center for Health Workforce Analysis, 2002 Area Resource File (Rockville, Md.: National Center for Health
Workforce Analysis, 2002).
NOTES: SD is standard deviation. Mortality is deaths per 100,000 population. MSA is metropolitan statistical area.
a
1999 data.
b
1990 data.
c
1997 data.
d
1998 data.
e
Not available.
W5-98 15 March 2005
3. Sp e c i a li s ts & H e a lth
unemployment, poverty, and percentage of African Americans decreased slightly.
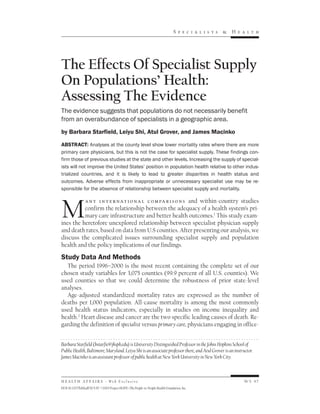
Exhibit 2 shows the relationships between primary care physicians, specialists,
and age-adjusted total, heart disease, and cancer mortality. Regression coefficients
and standard errors are presented along with tests of significance. The higher the
specialist-to-population ratios, the higher the mortality rates for total mortality
and cancer mortality, although this relationship disappears after the sociodemo-
graphic variables are controlled for. In contrast, the greater the supply of primary
care physicians, the lower the total and heart disease mortality rates, and statisti-
cal significance is maintained even after the socioeconomic and demographic
characteristics are controlled for.
In additional analyses using different types of geographic areas, including seven
geographic levels (MSA, non-MSA, metropolitan, metropolitan-adjacent city,
nonmetropolitan-adjacent city, metropolitan-adjacent rural, and nonmetro-
politan-adjacent rural) and mortality (total, heart, cancer, stroke, and infant),
there are thirty-five different results for primary care and for specialist ratios, re-
spectively (data not shown). The higher the primary care ratios, the lower the
mortality for twenty-eight of the thirty-five results, with statistical significance
reached in twenty of them. For the specialist ratios, the higher the ratio, the higher
the mortality in twenty-five of the thirty-five results, with statistical significance
reached in two. When sociodemographic characteristics were added, the ratio of
primary care to population remained significantly associated with lower total,
heart disease, and cancer mortality, whereas the ratio of specialist to population
was generally associated with higher mortality. This shows great consistency in
the directions of relationships between physician ratios and mortality outcomes.
EXHIBIT 2
Relationship Between Primary Care And Specialist Physician Ratios And Mortality:
Regression Coefficients, Standard Errors, And Statistical Significance, 1996–2000
Primary care Specialist
Mortality Unadjusted Adjusted
a
Unadjusted Adjusted
a
measure (per
100,000) Coefficient SE Coefficient SE Coefficient SE Coefficient SE
All-cause –0.0353**** 0.0029 –0.0086** 0.0035 0.0264**** 0.0068 –0.0031 0.0051
Heart –0.0171**** 0.0011 –0.0117**** 0.0005 0.0031 0.0017 –0.004** 0.0016
Cancer –0.0039**** 0.0006 –0.0006 0.0005 0.0053**** 0.0007 –0.0003 0.0007
SOURCE: National Center for Health Workforce Analysis, 2002 Area Resource File (Rockville, Md.: National Center for Health
Workforce Analysis, 2002).
NOTES: Numbers are regression coefficients derived from Proc-Mixed analysis. The results are interpreted as in an ordinary
regression: A one-unit change in the coefficient is associated with a one-unit change in the outcome. Negative values indicate
an association with lower mortality; positive values indicate an association with higher mortality.
a
All values for regression coefficients adjusted for per capita income, percent high school education, percent unemployment,
percent elderly, percent African American, percent below the federal poverty level, and percent in a metropolitan statistical
area (MSA) or non-MSA. SE is standard error. Tests of significance were based on z-statistics.
**p < .05 ****p < .001
H E A LT H A F F A I R S ~ We b E x c l u s i v e W5-99
4. D ata Wat c h
Discussion And Policy Implications
n The relationship between health and physician supply. These findings are
consistent with those found in previous studies showing a negative relationship be-
tween the state-level supply of primary care and death from stroke, infant mortality
and low-birthweight, and all-cause mortality.5 When state-level economic and de-
mographic characteristics were controlled for, an increase of one primary care phy-
sician per 10,000 population (about a 20 percent increase) was associated with a 6
percent decrease in all-cause mortality and about a 3 percent decrease in infant,
low-birthweight, and stroke mortality. For total mortality, an increase of one pri-
mary care physician per 10,000 population was associated with a reduction of 34.6
deaths per 100,000 population at the state leve1.6
The relative position of the United States on health indicators among countries
in the Organization for Economic Cooperation and Development (OECD) is at or
near the bottom for every indicator and has worsened during the most recent de-
cade, during a time when the proportion of specialists per population has risen.7
Although the United States has approximately the same number of physicians per
population as the OECD average, this number masks a very different balance be-
tween generalists and specialists. The number of primary care physicians per pop-
ulation in the United States is 0.25 (0.75 including general internists and pediatri-
cians), compared with one or more per population in Australia, France, and
Germany.8 In the United Kingdom, the number of primary care physicians is low,
but the number of specialists is also low.9 In fact, the specialist-to-population ra-
tio bears little relationship to health outcomes. Although primary care–oriented
countries have, in general, more generalists than specialists and better health out-
comes, Sweden achieves a relatively high level of primary care practice and one of
the best health outcomes with more specialists than generalists.10 In most if not all
Western industrialized countries, the number of visits to generalists greatly ex-
ceeds the number of visits to specialists, but this is not the case in the United
States.11 It appears that it is the relative roles of primary care physicians and spe-
cialists rather than their number that makes the difference in health outcomes.
Evidence of this is the threefold difference between the United States and the
United Kingdom in the percentage of people seen by a specialist in a year, even
after differences in morbidity burden are controlled for.12
n The relationship between specialist supply and health outcomes. Clues
about the relationship between activities and outcomes for primary care physicians
and specialists can be gleaned from evidence within the United States. In one of the
first demonstrations of the relationship between physician supply and outcomes,
Frank Farmer and colleagues showed that at the state level, the higher the ratio of
primary care physicians to population, the better the outcomes as measured by age-
specific mortality rates.13 A subsequent analysis added several other measures of ill
health and specialist supply while also considering supply of hospital beds, educa-
tional level and income of the population, unemployment rates, percentage urban,
W5-100 15 March 2005
5. Sp e c i a li s ts & H e a lth
levels of air pollution, lifestyle (individual behavior), and percentage minority.
Lower primary care physician supply and higher specialist-to-population ratios
were associated with higher overall age-adjusted mortality, mortality from heart
disease, mortality from cancer, neonatal mortality, life span, and low-birthweight ra-
tios.14 Similarly, Elliott Fisher and colleagues, examining care provided to the U.S.
Medicare population, showed that the higher the ratio of specialists per population,
the higher the surgery rates, performance of procedures, and expenditures; that the
higher the level of spending in geographic areas, the more people see specialists
rather than primary care physicians; and that quality and outcomes of care, for both
illnesses and preventive care, were no better in higher-spending areas.15 In most
cases, outcomes were worse in these areas, even after sociodemographic characteris-
tics, comorbidity, and severity of illness were controlled for. Confirming these find-
ings, Katherine Baicker and Amitabh Chandra showed that an increase of general
practitioners (GPs) per 10,000 population is associated with a significant increase in
quality of health services as well as a reduction in costs per beneficiary.16 Conversely,
increasing the number of specialists is associated with poor quality and higher
costs.
Several other studies had similar results for specific types of specialists. The
variation in numbers (per population) of neonatologists does not vary with mea-
sures of need (very low birthweight ratios); there is no relationship between the
supply of neonatal resources and infant mortality; and increases in the supply of
neonatologists beyond a moderate level confers no additional benefit.17
Studies in the state of Florida showed a similar phenomenon. Each tenth-per-
centile increase in primary care physician supply is associated with a statistically
significant 4 percent increase in odds of early-stage (rather than late-stage) diag-
nosis of breast cancer.18 The higher the specialty care physician-to-population ra-
tio, the greater the likelihood of late-stage (rather than early-stage) diagnosis of
colorectal cancer.19 For cervical cancer, advanced-stage presentation is less com-
mon in areas well supplied with family physicians, but there is no significant rela-
tionship between these rates and the supply of specialist physicians, either in total
or for obstetrician/gynecologists.20 Melanoma is also identified at an earlier stage
in areas where the supply of family physicians is high, in both urban and nonurban
areas. The same is the case for the supply of dermatologists, although the effect
does not reach statistical significance. In contrast, there is no relationship be-
tween the supply of other specialists and early detection of melanoma.21
A national study of one-year mortality among elderly adults with acute myocar-
dial infarction (AMI) showed no differences between care provided by cardiolo-
gists and family physicians once a variety of characteristics (including comor-
bidity and use of guidelines) were controlled for, a finding that was considered to
confirm the results of other cited studies.22 In that study, the patients of cardiolo-
gists were less ill overall, with fewer comorbid illnesses than the patients of
primary care physicians.
H E A LT H A F F A I R S ~ We b E x c l u s i v e W5-101
6. D ata Wat c h
“From a population viewpoint, there is considerable evidence for
the benefits of an increase in primary care physician supply.”
Patients receiving care from specialists for conditions outside their area of spe-
cialization have higher mortality rates for community-acquired pneumonia, AMI,
congestive heart failure, and upper gastrointestinal hemorrhage.23 Several other
studies indicate better, or at least equivalent, outcomes for primary care physi-
cians as compared with specialists, starting with the Medical Outcomes Study in
the 1980s.24 More recently, Marshall Chin and colleagues demonstrated that dis-
ease-oriented specialists adhere to guidelines for processes of care related to the
specific disease better than primary care physicians do, but there are no differ-
ences in short-term outcomes or satisfaction, and much lower costs for family
physicians.25 Conversely, primary care physicians achieve better generic (that is,
not disease-specific) outcomes than do specialists at much lower costs, even
though specialists may achieve better “quality” of care in their particular area of
competence.26
Thus, from a population viewpoint, there is considerable evidence for the bene-
fits (on health outcomes) of an increase in supply of primary care physicians, and
no evidence for a similar effect for specialists.
n Evidence on adverse effects associated with an excessive supply of spe-
cialists. A second consideration in deliberations about the need for physician per-
sonnel concerns the evidence on volume/outcome relationships. At least for hospital
services, quality of care for many, if not most, operations is better when the hospital
performs at least a certain number per year.27 More recent studies had similar find-
ings when the analysis was directed at individual surgeon volumes. Patients of high-
volume surgeons have lower death rates for heart bypass surgery, carotid endar-
terectomy, and five other cardiovascular and cancer procedures as compared with
surgeons who perform fewer such procedures. The magnitude of difference is con-
siderable: 24 percent greater for lung resections, and four times greater for pancre-
atic resection.28
The more surgical specialists, the lower the volume of procedures for each one,
unless the rate of performance of procedures also increases, which raises the spec-
ter of increasing overuse or nonindicated interventions with an increased supply
of specialists. In the United States, one-third of excessive costs (compared with
comparable industrialized countries) is attributed to performance of unnecessary
and nonindicated procedures.29 Despite this evidence, quality-of-care indicators
focus primarily on errors of omission (nonperformance of indicated procedures)
rather than errors of commission (including too many nonindicated interven-
tions).30 For example, approximately half of children with headaches who are re-
ferred to an academic children’s hospital outpatient clinic had one or more imag-
ing procedures, whereas established guidelines indicate that no more than 10
W5-102 15 March 2005
7. Sp e c i a li s ts & H e a lth
percent of them should have had one. More than 30 percent of the children were
given therapy to prevent migraines even before referral to the headache clinic, thus
raising the question of whether or not the referral was needed.31
The dangers of unnecessary referrals, particularly self-referrals, are docu-
mented.32 Noralou Roos provided a dramatic example of the better short- and
long-term outcomes of children whose primary care physician referred them to an
ear, nose, and throat (ENT) specialist compared with outcomes in children whose
parents self-referred.33
By virtue of their training and experience, specialists have a higher likelihood of
suspecting serious pathology than is the case for primary care physicians; they
have been shown to do excessive (and unnecessary) diagnostic workups to rule
out what they suspect.34 As a result, primary care physicians are better diagnosti-
cians than specialists are, and specialist performance is better in patients referred
by primary care physicians.35 It is possible, therefore, that part of the benefit of pri-
mary care is in reducing unnecessary and inappropriate specialist visits.36
The third concern deals with the likely increased inequity in health associated
with increasing specialization. Specialty care is more costly than primary care; to
the extent that cost sharing is present, it will preferentially reduce access for the
socially disadvantaged.37 Moreover, in a country such as the United States, which
has no mechanism to prevent physicians from locating in overdoctored areas, in-
creasing the number of physicians does not reduce disparities in regional supply.38
Thus, care will be preferentially available to the already advantaged, with increas-
ing social disparities in health. The likelihood that access to specialists differs
from access to primary care physicians is suggested by our analysis, which showed
that, after sociodemographic characteristics were controlled for, specialist supply
more often lost its statistically significant relationship with higher mortality, as
compared with the persistence of statistical significance for the relationship be-
tween primary care physician supply and lower mortality.
A case could be made that there is some degree of overcontrol in including so-
cioeconomic and demographic characteristics, resulting in an underestimation of
the benefit of primary care and an overestimation of the benefit of specialty care.
In the United States (but not in Western Europe), more socially disadvantaged
people have less access to (and use of) primary care services related to their
needs.39 Thus, even where primary care is in good supply, the association between
supply and mortality may underestimate the impact of primary care because de-
prived populations are underusing it. Thus, the apparent lessening of relationship
with control for socioeconomic characteristics does not necessarily mean that the
actual effect of receipt of primary care lessens. Conversely, a shift in sign (from
positive to negative) in the relationship between specialist supply and some types
of mortality after controlling for socioeconomic and demographic characteristics
may be a result of less unnecessary use by disadvantaged people as a result of the
compromised access and less use of specialists.40
H E A LT H A F F A I R S ~ We b E x c l u s i v e W5-103
8. D ata Wat c h
“Greater rationalization of specialist care is occurring in several
countries, particularly where waiting lists are too long.”
n Study limitations. Some possible limitations warrant mention. First, indica-
tors of impact were primarily mortality rates. If specialty care improves quality of
life, our results may underestimate a beneficial impact on outcomes. The same, how-
ever, might be postulated for primary care.
Second, our analysis did not examine the mortality effect of the supply of par-
ticular specialists. Subsequent researchers might disaggregate heart disease mor-
tality into components responsive to different types of heart specialists (for exam-
ple, medical and surgical) and examine mortality/specialist relationships.
Similarly, the supply of oncologists could be related to cancer deaths, but even
here different types of cancer (for example, skin, gastrointestinal) would have to
be related to corresponding types of specialists. Because there is no limitation on
the type of care provided by different types of specialists, and it is known that re-
ferrals for specific conditions often are made to different types of specialists, such
analyses would have to contend with assumptions that would be very difficult to
test.41
Third, including pediatricians in analyses when mortality is concentrated in
adults may be illogical. Studies that have disaggregated the three primary care
specialties have found the relationship with better health outcomes to be greater
for family physicians than for the other two types of primary care physicians.42
n Policy implications. The roles and responsibilities of primary care are well
known; the same is not the case for specialty care.43 Surgical specialists make a
unique contribution through surgical interventions, but many are involved in activi-
ties other than operations. The need for specialists to deal with conditions too un-
common for primary care physicians to maintain competence in dealing with them
undoubtedly is, or at least should be, the basis for specialization. Beyond this gener-
alization, little is known about the roles of specialists. Furthermore, the boundary
between “uncommon” and “not uncommon” is not well defined and may differ from
place to place. In countries where specialists work in hospitals and see patients only
on referral from primary care, there is a clear delineation of roles defined by what
primary care physicians do. Referrals have four functions: short-term consultation
for diagnosis; short-term consultation for initiation of management; long-term refer-
ral for total care of rare conditions; and recurrent consultation for continuing man-
agement.44 Little is known about the relative balance of these functions, although
short-term consultations are far more common than long-term consultations or re-
ferrals, for virtually all specialist types in the United States.45
Greater rationalization of specialist care is occurring in several countries, par-
ticularly where waiting lists for specialist care are perceived as too long. None of
these efforts involves increasing the supply of specialists. Planning for these im-
W5-104 15 March 2005
9. Sp e c i a li s ts & H e a lth
provements is seen as a role of central or provincial governments.46 The special
role of information systems is particularly recognized in the Canadian province of
Saskatchewan, which systematically collects data on waiting lists and devises
clear and transparent patient prioritization processes.47 In the United Kingdom,
there is evidence that many specialist visits can be avoided. If primary care physi-
cians are provided with cameras and the subsequent means to obtain dermatology
consults directly, 25 percent of patients who otherwise would have been referred
can be managed without a specialist appointment; at least 38 percent can be saved
at least one dermatology visit by initiating management without the dermatolo-
gist seeing the patient.48 Furthermore, the need for specialists can be reduced by
enabling less costly professionals to do professionally more sophisticated inter-
ventions in less costly settings, as long as they are appropriately trained, maintain
a reasonable volume, and are subject to assessment of unnecessary or inappropri-
ate use.49 Experience elsewhere also shows that countries with increasing demand
for specialty services are not responding by increasing their supply. In the United
Kingdom, the development of primary care physicians with specialty interests is
proving successful in reducing waiting time for consults in a variety of specialist
types.50 That is, increased availability of primary care services provides a viable
and much less costly alternative to increasing the number of specialists.
I
n v i e w o f t h e s t r o n g e v i d e n c e that having more specialists, or higher
specialist-to-population ratios, confers no advantages in meeting population
health needs and may have ill effects when specialist care is unnecessary, in-
creasing the specialist supply is not justifiable. Of course, there may be particular
specialists who are in insufficient supply to meet particular needs. Moreover, there
is already considerable evidence that increasing the supply of primary care physi-
cians would have a beneficial impact on the health of the population.
This work was supported in part by Grant no. 6 U30 CS 00189-05 S1 R1 from the Bureau of Primary Health Care,
Health Resources and Services Administration, U.S. Department of Health and Human Services, to the Primary
Care Policy Center for the Underserved at Johns Hopkins University.
NOTES
1. B. Starfield and L. Shi, “Primary Care Impact on Health Outcomes: A Literature Review,” Milbank Quarterly
(forthcoming).
2. M. Bergner, “Measurement of Health Status,” Medical Care 23, no. 5 (1985): 696–704; and I. Kawachi, B.P.
Kennedy, and R.G. Wilkinson, The Society and Population Health Reader: Volume 1: Income Inequality and Health
(New York: New Press, 1999).
3. Data from National Center for Health Workforce Analysis, 2002 Area Resource File (Rockville, Md.: National
Center for Health Workforce Analysis, 2002); and B. Starfield, Primary Care: Balancing Health Needs, Services,
and Technology (New York: Oxford University Press, 1998).
4. For more detail, see SAS Institute, SAS/STAT User’s Guide, Version 8 (Cary, N.C.: SAS Institute, 1999).
5. L. Shi et al., “Primary Care, Income Inequality, and Stroke Mortality in the United States: A Longitudinal
Analysis, 1985–1995,” Stroke 34, no. 8 (2003): 1958–1964; L. Shi et al., “Primary Care, Infant Mortality, and
Low Birth Weight in the States of the USA,” Journal of Epidemiology and Community Health 58, no. 5 (2004):
374–380; and L. Shi et al., “The Relationship between Primary Care, Income Inequality, and Mortality in
H E A LT H A F F A I R S ~ We b E x c l u s i v e W5-105
10. D ata Wat c h
U.S. States, 1980–1995,” Journal of the American Board of Family Practice 16, no. 5 (2003): 412–422.
6. L. Shi et al., “Income Inequality, Primary Care, and Health Indicators,” Journal of Family Practice 48, no. 4
(1999): 275–284.
7. World Health Organization, World Health Report 2003: Shaping the Future (Geneva: WHO, 2003).
8. National Center for Health Statistics, Health, United States, 2003, with Chartbook on Trends in the Health of Ameri-
cans (Hyattsville, Md.: NCHS, 2003).
9. K. Bloor and A. Maynard, Planning Human Resources in Health Care: Towards an Economic Approach; An International
Comparative Review (Ottawa: Canadian Health Services Research Foundation, 2003); and B. Starfield and L.
Shi, “Policy Relevant Determinants of Health: An International Perspective,” Health Policy 60, no. 3 (2002):
201–218.
10. J. Macinko, B. Starfield, and L. Shi, “The Contribution of Primary Care Systems to Health Outcomes
within Organization for Economic Cooperation and Development (OECD) Countries, 1970–1998,” Health
Services Research 38, no. 3 (2003): 831–865; Bloor and Maynard, Planning Human Resources in Health Care; and
Starfield, Primary Care.
11. E. van Doorslaer, X. Koolman, and F. Puffer, “Equity in the Use of Physician Visits in OECD Countries: Has
Equal Treatment for Equal Need Been Achieved?” in Measuring Up: Improving Health System Performance in
OECD Countries (Paris: Organization for Economic Cooperation and Development, 2002), 225–248.
12. C.B. Forrest et al., “Comparison of Specialty Referral Rates in the United Kingdom and the United States:
Retrospective Cohort Analysis,” British Medical Journal 325, no. 7360 (2002): 370–371; and C.B. Forrest et al.,
“Referral of Children to Specialists in the United States and the United Kingdom,” Archives of Pediatric and
Adolescent Medicine 157, no. 3 (2003): 279–285.
13. F.L. Farmer et al., “Poverty, Primary Care, and Age-Specific Mortality,” Journal of Rural Health 7, no. 2 (1991):
153–169.
14. L. Shi, “Primary Care, Specialty Care, and Life Chances,” International Journal of Health Services 24, no. 3 (1994):
431–458.
15. E.S. Fisher et al., “The Implications of Regional Variations in Medicare Spending, Part 1: The Content,
Quality, and Accessibility of Care,” Annals of Internal Medicine 138, no. 4 (2003): 273–287; and E.S. Fisher et al.,
“The Implications of Regional Variations in Medicare Spending, Part 2: Health Outcomes and Satisfaction
with Care,” Annals of Internal Medicine 138, no. 4 (2003): 288–298.
16. K. Baicker and A. Chandra, “Medicare Spending, the Physician Workforce, and Beneficiaries’ Quality of
Care,” Health Affairs, 7 April 2004, content.healthaffairs.org/cgi/content/abstract/hlthaff.w4.184 (7 February
2005).
17. D.C. Goodman et al., “The Relation between the Availability of Neonatal Intensive Care and Neonatal
Mortality,” New England Journal of Medicine 346, no. 20 (2002): 1538–1544.
18. J.M. Ferrante et al., “Effects of Physician Supply on Early Detection of Breast Cancer,” Journal of the American
Board of Family Practice 13, no. 6 (2000): 408–414.
19. R.G. Roetzheim et al., “The Effects of Physician Supply on the Early Detection of Colorectal Cancer,” Jour-
nal of Family Practice 48, no. 11 (1999): 850–858.
20. R.J. Campbell et al., “Cervical Cancer Rates and the Supply of Primary Care Physicians in Florida,” Family
Medicine 35, no. 1 (2003): 60–64.
21. R.G. Roetzheim et al., “Increasing Supplies of Dermatologists and Family Physicians Are Associated with
Earlier Stage of Melanoma Detection,” Journal of the American Academy of Dermatology 43, no. 2, Part 1 (2000):
211–218.
22. J. Chen et al., “Care and Outcomes of Elderly Patients with Acute Myocardial Infarction by Physician Spe-
cialty: The Effects of Comorbidity and Functional Limitations,” American Journal of Medicine 108, no. 6
(2000): 460–469.
23. S.R. Weingarten et al., “Do Subspecialists Working Outside of Their Specialty Provide Less Efficient and
Lower-Quality Care to Hospitalized Patients than Do Primary Care Physicians?” Archives of Internal Medicine
162, no. 5 (2002): 527–532.
24. S. Greenfield et al., “Variations in Resource Utilization among Medical Specialties and Systems of Care:
Results from the Medical Outcomes Study,” Journal of the American Medical Association 267, no. 12 (1992):
1624–1630.
25. M.H. Chin, J.X. Zhang, and K. Merrell, “Specialty Differences in the Care of Older Patients with Diabetes,”
Medical Care 38, no. 2 (2000): 131–140.
W5-106 15 March 2005
11. Sp e c i a li s ts & H e a lth
26. The evidence is summarized in B. Starfield, “The Effectiveness of Primary Health Care,” in A Celebration of
General Practice, ed. M. Lakhani (Oxon, U.K.: Radcliffe, 2003), 19–36.
27. J.D. Birkmeyer et al., “Surgeon Volume and Operative Mortality in the United States,” New England Journal of
Medicine 349, no. 22 (2003): 2117–2127.
28. Ibid.
29. M.A. Schuster, E.A. McGlynn, and R.H. Brook, “How Good Is the Quality of Health Care in the United
States?” Milbank Quarterly 76, no. 4 (1998): 517–563.
30. Fisher et al., “The Implications of Regional Variations in Medicare Spending, Part 2.”
31. N.F. Schor, “Brain Imaging and Prophylactic Therapy in Children with Migraine: Recommendations ver-
sus Reality,” Journal of Pediatrics 143, no. 6 (2003): 776–779.
32. See, for example, P. Franks, C.M. Clancy, and P.A. Nutting, “Gatekeeping Revisited—Protecting Patients
from Overtreatment,” New England Journal of Medicine 327, no. 6 (1992): 424–429.
33. N.P. Roos, “Who Should Do the Surgery? Tonsillectomy-Adenoidectomy in One Canadian Province,” In-
quiry 16, no. 1 (1979): 73–83.
34. H.C. Sox, “Decision-Making: A Comparison of Referral Practice and Primary Care,” Journal of Family Practice
42, no. 2 (1996): 155–160; and D.L. Sackett and R.B. Haynes, “The Architecture of Diagnostic Research,”
British Medical Journal 324, no. 7336 (2002): 539–541.
35. A. Hashem, M.T. Chi, and C.P. Friedman, “Medical Errors as a Result of Specialization,” Journal of Biomedical
Informatics 36, nos. 1–2 (2003): 61–69.
36. Franks et al., “Gatekeeping Revisited.”
37. A. Coffinhal and V. Paris, “Cost-Sharing in France,” CREDES Working Paper (Paris: Centre de recherches
d’études pour le développement de la santé, 2003); and M.E. Rasell, “Cost Sharing in Health Insurance—A
Reexamination,” New England Journal of Medicine 332, no. 17 (1995): 1164–1168.
38. R.K. Chang and N. Halfon, “Geographic Distribution of Pediatricians in the United States: An Analysis of
the Fifty States and Washington, DC,” Pediatrics 100, no. 2, Part 1 (1997): 172–179.
39. E. van Doorslaer, X. Koolman, and A.M. Jones, “Explaining Income-Related Inequalities in Doctor Utilisa-
tion in Europe,” Health Economics 13, no. 7 (2004): 629–647.
40. Ibid.
41. B. Starfield et al., “Variability in Physician Referral Decisions,” Journal of the American Board of Family Practice 15,
no. 6 (2002): 473–480.
42. M.L. Parchman and S. Culler, “Primary Care Physicians and Avoidable Hospitalizations,” Journal of Family
Practice 39, no. 2 (1994): 123–128; and Shi et al., “The Relationship between Primary Care, Income Inequal-
ity, and Mortality.”
43. M.S. Donaldson et al., Primary Care: America’s Health in a New Era (Washington: National Academies Press,
1996).
44. B. Starfield, “New Paradigms for Quality in Primary Care,” British Journal of General Practice 51, no. 465 (2001):
303–309.
45. Starfield et al., “Variability in Physician Referral Decisions.”
46. Bloor and Maynard, Planning Human Resources in Health Care.
47. P.A. Glynn et al., “The Saskatchewan Surgical Care Network—Toward Timely and Appropriate Access,”
Hospital Quarterly 7, no. 1 (2003): 44–48.
48. P. Leggett et al., “A Randomized Controlled Trial using Instant Photography to Diagnose and Manage Der-
matology Referrals,” Family Practice 21, no. 1 (2004): 54–56.
49. C. Christensen, R. Bohmer, and J. Kenagy, “Will Disruptive Innovations Cure Health Care?” Harvard Busi-
ness Review 78, no. 5 (2000): 102–112.
50. A. Nocon and B. Leese, “The Role of U.K. General Practitioners with Special Clinical Interests: Implica-
tions for Policy and Service Delivery,” British Journal of General Practice 54, no. 498 (2004): 50–56.
H E A LT H A F F A I R S ~ We b E x c l u s i v e W5-107