Next generation of the post pc era - beyond the internet of things - j.des jardins 2015
•Download as PPTX, PDF•
0 likes•279 views

Imagining the Future - A Smart Connected World - in the Post-PC Era we need thing beyond "BigData" and "IoT" and imagine a Human-Centered, Interactive World. A world where technology isn't static, but interactive, and behaves more like organic communities and follows natural models of alignment and intelligence.

Recommended
Recommended
More Related Content
What's hot
What's hot (20)
Similar to Next generation of the post pc era - beyond the internet of things - j.des jardins 2015
Similar to Next generation of the post pc era - beyond the internet of things - j.des jardins 2015 (20)
Recently uploaded
Recently uploaded (20)
Next generation of the post pc era - beyond the internet of things - j.des jardins 2015
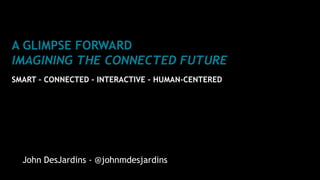
- 1. A GLIMPSE FORWARD IMAGINING THE CONNECTED FUTURE SMART – CONNECTED – INTERACTIVE – HUMAN-CENTERED John DesJardins - @johnmdesjardins
- 2. The Early Evolution of “Data Processing” was about “Straight Through Processing” but assumed the Path was Literally Straight
- 3. And Focused on improving the engine performance
- 4. Early “CONNECTED” Solutions Realized It’s More Complex More Logic Was Needed to Guide Interactions
- 5. Focus Shifted to Visibility & Control: Analytics
- 6. In the Next Generation of Intelligence for the Post-PC Era The Metaphor Must Change Again to a New Paradigm Two Dimensional Intelligence No Longer Captures the Global Complexity of The Connected World | Page 6
- 7. Traditional View of Big Data “We Have Mountains of Data” and: “There’s GOLD in Them Thar Hills!” You just have to dedicate Massive Computing Resources & Teams of Data Scientists to identify nuggets of insight within a matter of Days or Hours. SLOW DATA THIS ISN’T ENOUGH IN THE CONNECTED WORLD
- 8. INSTEAD: Imagine Pin-pointing Nuggets of Insight Instantly & taking Action? Best Route Potential Risk FAST DATA
- 9. Taking it Further: People Must Be The Center For Multi-Device Connected Applications Smart Devices & Smart Applications Must Evolve Into Conversational Models For Communication & Interaction
- 10. The Future will be Automatic, Transparent, Dynamic, Elastic, Intelligent: Organic Models of Alignment & Intelligence | Page 10
- 11. Thank You
Editor's Notes
- Date
- Date
- Date
- Date
- Date
- Date