Avon financial ratios
•Download as DOC, PDF•
0 likes•644 views
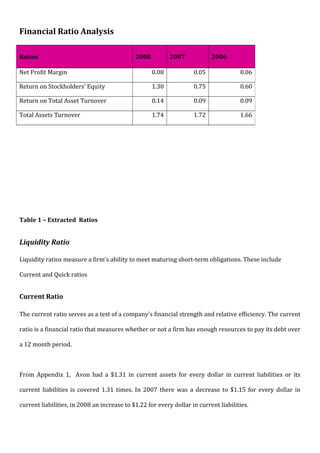
The document analyzes various financial ratios for Avon over three years from 2006 to 2008. It includes ratios related to profitability, asset use, and liquidity. The profitability ratios like net profit margin and return on equity increased from 2006 to 2008. The liquidity ratios like current ratio fluctuated from 2006 to 2008, being highest in 2008 at 1.22, meaning the company had $1.22 in current assets for every $1 in current liabilities. The document also defines the current ratio and its importance as a measure of short-term financial strength.
Report
Share
Report
Share
Recommended
Argie bond quant track record
Argie Bond Quant is an ARS denominated sovereign fixed income portfolio that is always on the cheap side of the market.
Recommended
Argie bond quant track record
Argie Bond Quant is an ARS denominated sovereign fixed income portfolio that is always on the cheap side of the market.
Your answer is incorrect. Try again.Prepare a comparati.docx
Your answer is incorrect. Try again.
Prepare a comparative balance sheet of Gilmour Company showing the dollar change and the percent change for each item. (Round percentages to 2 decimal places, e.g. 2.25%. If $ or % change are in decrease, enter amounts or percentages using either a negative sign preceding the number e.g. -45, -2.25% or parentheses e.g. (45), (2.25)%.)
GILMOUR COMPANY
Comparative Balance Sheet
December 31, 2013 and 2012
December 31
Increase or (Decrease)
Assets
2013
2012
$ Change
% Change
Cash
$ 180,000
$ 275,000
$
%
$-95,000
-34.55%
Accounts receivable (net)
219,500
155,300
64,200
41.34%
Short-term investments
269,300
149,600
119,700
80.01%
Inventories
1,059,600
979,300
80,300
8.20%
Prepaid expenses
24,750
24,750
0
0.00%
Fixed assets
2,585,200
1,949,400
635,800
32.62%
Accumulated depreciation
( 1,000,500
)
( 750,100
)
-250,400
33.38%
Total
$ 3,337,850
$ 2,783,250
$
%
554,600
19.93%
Liabilities and Stockholders’ Equity
Accounts payable
$ 50,020
$ 74,100
$
%
-24,080
-32.50%
Accrued expenses
170,400
199,400
-29,000
-14.54%
Bonds payable
450,500
189,600
260,900
137.61%
Capital stock
2,100,000
1,769,300
330,700
18.69%
Retained earnings
566,930
550,850
16,080
2.92%
Total
$ 3,337,850
$ 2,783,250
$
%
554,600
19.93%
Your answer is partially correct. Try again.
Answer each of the questions in the following unrelated situations.
(a) The current ratio of a company is 5:1 and its acid-test ratio is 1:1. If the inventories and prepaid items amount to $492,400, what is the amount of current liabilities?
Current Liabilities
$
(b) A company had an average inventory last year of $209,000 and its inventory turnover was 5. If sales volume and unit cost remain the same this year as last and inventory turnover is 9 this year, what will average inventory have to be during the current year? (Round answer to 0 decimal places, e.g. 125.)
Average Inventory
$
(c) A company has current assets of $88,790 (of which $37,160 is inventory and prepaid items) and current liabilities of $37,160. What is the current ratio? What is the acid-test ratio? If the company borrows $13,870 cash from a bank on a 120-day loan, what will its current ratio be? What will the acid-test ratio be? (Round answers to 2 decimal places, e.g. 2.50.)
Current Ratio
:1
Acid Test Ratio
:1
New Current Ratio
:1
New Acid Test Ratio
:1
(d) A company has current assets of $605,100 and current liabilities of $239,000. The board of directors declares a cash dividend of $191,200. What is the current ratio after the declaration but before payment? What is the current ratio after the payment of the dividend? (Round answers to 2 decimal places, e.g. 2.50.)
Current ratio after the declaration but before payment
:1
Current ratio after the p.
115Financial andOperating Ratios asPerformanceMeas.docx
115
Financial and
Operating Ratios as
Performance
Measure s
11
C H A P T E R
THE IMPORTANCE OF RATIOS
Ratios are convenient and uniform measures that are
widely adopted in healthcare financial management.
They are important because they are so widely used, es-
pecially because they are used for credit analysis. But a
ratio is only a number. It has to be considered within the
context of the operation. There is another caveat: ratio
analysis should be conducted as a comparative analysis. In
other words, one ratio standing alone with nothing to
compare it with does not mean very much. When inter-
preting ratios, the differences between periods must be
considered, and the reasons for such differences should
be sought. It is a good practice to compare results with
equivalent computations from outside the organization—
regional figures from similar institutions would be a good
example of such outside sources. Caution and good man-
agerial judgment must always be exercised when working
with ratios.
Financial ratios basically pull together two elements of
the financial statements: one expressed as the numerator
and one as the denominator. To calculate a ratio, divide
the bottom number (the denominator) into the top
number (the numerator). The Case Study in Appendix
25-A entitled “Using Financial Ratios and Benchmark-
ing: A Case Study in Comparative Analysis” uses financial
ratios as indicators of financial position. We highly rec-
ommend that you spend time with this Case Study, as it
will add depth and background to the contents of this
chapter.
In this chapter we examine liquidity, solvency, and
profitability ratios. Exhibit 11-1 sets out eight basic ratios
After completing this chapter,
you should be able to
1. Understand four types of
liquidity ratios.
2. Understand two types of
solvency ratios.
3. Understand two types of
profitability ratios.
4. Successfully compute ratios.
P r o g r e s s N o t e s
116 CHAPTER 11 Financial and Operating Ratios as Performance Measures
Exhibit 11–1 Eight Basic Ratios Used in Health Care
Liquidity Ratios
1. Current Ratio
Current Assets
Current Liabilities
2. Quick Ratio
Cash and Cash Equivalents + Net Receivables
Current Liabilities
3. Days Cash on Hand (DCOH)
Unrestricted Cash and Cash Equivalents
Cash Operation Expenses ÷ No. of Days in Period (365)
4. Days Receivables
Net Receivables
Net Credit Revenues ÷ No. of Days in Period (365)
Solvency Ratios
5. Debt Service Coverage Ratio (DSCR)
Change in Unrestricted Net Assets (net income)
+ Interest, Depreciation, Amortization
Maximum Annual Debt Service
6. Liabilities to Fund Balance
Total Liabilities
Unrestricted Fund Balances
Profitability Ratios
7. Operating Margin (%)
Operating Income (Loss)
Total Operating Revenues
8. Return on Total Assets (%)
EBIT (Earnings before Interest and Taxes)
Total Assets
Courtesy of Resource Group, Ltd., Dallas, Texas.
that are widely used in healthcare organizations: four liquidity ty.
Operating Ratios asPerformanceMeasure s 11C H A P T E RTHE.docx
Operating Ratios as
Performance
Measure s 11
C H A P T E R
THE IMPORTANCE OF RATIOS
Ratios are convenient and uniform measures that are
widely adopted in healthcare financial management.
They are important because they are so widely used, especially
because they are used for credit analysis. But a
ratio is only a number. It has to be considered within the
context of the operation. There is another caveat: ratio
analysis should be conducted as a comparative analysis. In
other words, one ratio standing alone with nothing to
compare it with does not mean very much. When interpreting
ratios, the differences between periods must be
considered, and the reasons for such differences should
be sought. It is a good practice to compare results with
equivalent computations from outside the organization—
regional figures from similar institutions would be a good
example of such outside sources. Caution and good managerial
judgment must always be exercised when working
with ratios.
Financial ratios basically pull together two elements of
the financial statements: one expressed as the numerator
and one as the denominator. To calculate a ratio, divide
the bottom number (the denominator) into the top
number (the numerator). The Case Study in Appendix
25-A entitled “Using Financial Ratios and Benchmarking:
A Case Study in Comparative Analysis” uses financial
ratios as indicators of financial position. We highly recommend
that you spend time with this Case Study, as it
will add depth and background to the contents of this
chapter.
In this chapter we examine liquidity, solvency, and
profitability ratios. Exhibit 11-1 sets out eight basic ratios
After completing this chapter,
you should be able to
1. Understand four types of
liquidity ratios.
2. Understand two types of
solvency ratios.
3. Understand two types of
profitability ratios.
4. Successfully compute ratios
CHAPTER 11 Financial and Operating Ratios as Performance Measures
Exhibit 11–1 Eight Basic Ratios Used in Health Care
Liquidity Ratios
1. Current Ratio
Current Assets
Current Liabilities
2. Quick Ratio
Cash and Cash Equivalents + Net Receivables
Current Liabilities
3. Days Cash on Hand (DCOH)
Unrestricted Cash and Cash Equivalents
Cash Operation Expenses ÷ No. of Days in Period (365)
4. Days Receivables
Net Receivables
Net Credit Revenues ÷ No. of Days in Period (365)
Solvency Ratios
5. Debt Service Coverage Ratio (DSCR)
Change in Unrestricted Net Assets (net income)
+ Interest, Depreciation, Amortization
Maximum Annual Debt Service
6. Liabilities to Fund Balance
Total Liabilities
Unrestricted Fund Balances
Profitability Ratios
7. Operating Margin (%)
Operating Income (Loss)
Total Operating Revenues
8. Return on Total Assets (%)
EBIT (Earnings before Interest and Taxes)
Total Assets
Courtesy of Resource Group, Ltd., Dallas, Texas.
that are widely used in healthcare organizations: four liquidity types, two solvency types, and
two profitability types. All are discussed later.
LIQUIDITY RATIOS
Liquidity r.
Business Ratios are Indicators of Company Health
Ratio analysis is a process that incorporates a series of simple mathematical functions and applies ...
More Related Content
Similar to Avon financial ratios
Your answer is incorrect. Try again.Prepare a comparati.docx
Your answer is incorrect. Try again.
Prepare a comparative balance sheet of Gilmour Company showing the dollar change and the percent change for each item. (Round percentages to 2 decimal places, e.g. 2.25%. If $ or % change are in decrease, enter amounts or percentages using either a negative sign preceding the number e.g. -45, -2.25% or parentheses e.g. (45), (2.25)%.)
GILMOUR COMPANY
Comparative Balance Sheet
December 31, 2013 and 2012
December 31
Increase or (Decrease)
Assets
2013
2012
$ Change
% Change
Cash
$ 180,000
$ 275,000
$
%
$-95,000
-34.55%
Accounts receivable (net)
219,500
155,300
64,200
41.34%
Short-term investments
269,300
149,600
119,700
80.01%
Inventories
1,059,600
979,300
80,300
8.20%
Prepaid expenses
24,750
24,750
0
0.00%
Fixed assets
2,585,200
1,949,400
635,800
32.62%
Accumulated depreciation
( 1,000,500
)
( 750,100
)
-250,400
33.38%
Total
$ 3,337,850
$ 2,783,250
$
%
554,600
19.93%
Liabilities and Stockholders’ Equity
Accounts payable
$ 50,020
$ 74,100
$
%
-24,080
-32.50%
Accrued expenses
170,400
199,400
-29,000
-14.54%
Bonds payable
450,500
189,600
260,900
137.61%
Capital stock
2,100,000
1,769,300
330,700
18.69%
Retained earnings
566,930
550,850
16,080
2.92%
Total
$ 3,337,850
$ 2,783,250
$
%
554,600
19.93%
Your answer is partially correct. Try again.
Answer each of the questions in the following unrelated situations.
(a) The current ratio of a company is 5:1 and its acid-test ratio is 1:1. If the inventories and prepaid items amount to $492,400, what is the amount of current liabilities?
Current Liabilities
$
(b) A company had an average inventory last year of $209,000 and its inventory turnover was 5. If sales volume and unit cost remain the same this year as last and inventory turnover is 9 this year, what will average inventory have to be during the current year? (Round answer to 0 decimal places, e.g. 125.)
Average Inventory
$
(c) A company has current assets of $88,790 (of which $37,160 is inventory and prepaid items) and current liabilities of $37,160. What is the current ratio? What is the acid-test ratio? If the company borrows $13,870 cash from a bank on a 120-day loan, what will its current ratio be? What will the acid-test ratio be? (Round answers to 2 decimal places, e.g. 2.50.)
Current Ratio
:1
Acid Test Ratio
:1
New Current Ratio
:1
New Acid Test Ratio
:1
(d) A company has current assets of $605,100 and current liabilities of $239,000. The board of directors declares a cash dividend of $191,200. What is the current ratio after the declaration but before payment? What is the current ratio after the payment of the dividend? (Round answers to 2 decimal places, e.g. 2.50.)
Current ratio after the declaration but before payment
:1
Current ratio after the p.
115Financial andOperating Ratios asPerformanceMeas.docx
115
Financial and
Operating Ratios as
Performance
Measure s
11
C H A P T E R
THE IMPORTANCE OF RATIOS
Ratios are convenient and uniform measures that are
widely adopted in healthcare financial management.
They are important because they are so widely used, es-
pecially because they are used for credit analysis. But a
ratio is only a number. It has to be considered within the
context of the operation. There is another caveat: ratio
analysis should be conducted as a comparative analysis. In
other words, one ratio standing alone with nothing to
compare it with does not mean very much. When inter-
preting ratios, the differences between periods must be
considered, and the reasons for such differences should
be sought. It is a good practice to compare results with
equivalent computations from outside the organization—
regional figures from similar institutions would be a good
example of such outside sources. Caution and good man-
agerial judgment must always be exercised when working
with ratios.
Financial ratios basically pull together two elements of
the financial statements: one expressed as the numerator
and one as the denominator. To calculate a ratio, divide
the bottom number (the denominator) into the top
number (the numerator). The Case Study in Appendix
25-A entitled “Using Financial Ratios and Benchmark-
ing: A Case Study in Comparative Analysis” uses financial
ratios as indicators of financial position. We highly rec-
ommend that you spend time with this Case Study, as it
will add depth and background to the contents of this
chapter.
In this chapter we examine liquidity, solvency, and
profitability ratios. Exhibit 11-1 sets out eight basic ratios
After completing this chapter,
you should be able to
1. Understand four types of
liquidity ratios.
2. Understand two types of
solvency ratios.
3. Understand two types of
profitability ratios.
4. Successfully compute ratios.
P r o g r e s s N o t e s
116 CHAPTER 11 Financial and Operating Ratios as Performance Measures
Exhibit 11–1 Eight Basic Ratios Used in Health Care
Liquidity Ratios
1. Current Ratio
Current Assets
Current Liabilities
2. Quick Ratio
Cash and Cash Equivalents + Net Receivables
Current Liabilities
3. Days Cash on Hand (DCOH)
Unrestricted Cash and Cash Equivalents
Cash Operation Expenses ÷ No. of Days in Period (365)
4. Days Receivables
Net Receivables
Net Credit Revenues ÷ No. of Days in Period (365)
Solvency Ratios
5. Debt Service Coverage Ratio (DSCR)
Change in Unrestricted Net Assets (net income)
+ Interest, Depreciation, Amortization
Maximum Annual Debt Service
6. Liabilities to Fund Balance
Total Liabilities
Unrestricted Fund Balances
Profitability Ratios
7. Operating Margin (%)
Operating Income (Loss)
Total Operating Revenues
8. Return on Total Assets (%)
EBIT (Earnings before Interest and Taxes)
Total Assets
Courtesy of Resource Group, Ltd., Dallas, Texas.
that are widely used in healthcare organizations: four liquidity ty.
Operating Ratios asPerformanceMeasure s 11C H A P T E RTHE.docx
Operating Ratios as
Performance
Measure s 11
C H A P T E R
THE IMPORTANCE OF RATIOS
Ratios are convenient and uniform measures that are
widely adopted in healthcare financial management.
They are important because they are so widely used, especially
because they are used for credit analysis. But a
ratio is only a number. It has to be considered within the
context of the operation. There is another caveat: ratio
analysis should be conducted as a comparative analysis. In
other words, one ratio standing alone with nothing to
compare it with does not mean very much. When interpreting
ratios, the differences between periods must be
considered, and the reasons for such differences should
be sought. It is a good practice to compare results with
equivalent computations from outside the organization—
regional figures from similar institutions would be a good
example of such outside sources. Caution and good managerial
judgment must always be exercised when working
with ratios.
Financial ratios basically pull together two elements of
the financial statements: one expressed as the numerator
and one as the denominator. To calculate a ratio, divide
the bottom number (the denominator) into the top
number (the numerator). The Case Study in Appendix
25-A entitled “Using Financial Ratios and Benchmarking:
A Case Study in Comparative Analysis” uses financial
ratios as indicators of financial position. We highly recommend
that you spend time with this Case Study, as it
will add depth and background to the contents of this
chapter.
In this chapter we examine liquidity, solvency, and
profitability ratios. Exhibit 11-1 sets out eight basic ratios
After completing this chapter,
you should be able to
1. Understand four types of
liquidity ratios.
2. Understand two types of
solvency ratios.
3. Understand two types of
profitability ratios.
4. Successfully compute ratios
CHAPTER 11 Financial and Operating Ratios as Performance Measures
Exhibit 11–1 Eight Basic Ratios Used in Health Care
Liquidity Ratios
1. Current Ratio
Current Assets
Current Liabilities
2. Quick Ratio
Cash and Cash Equivalents + Net Receivables
Current Liabilities
3. Days Cash on Hand (DCOH)
Unrestricted Cash and Cash Equivalents
Cash Operation Expenses ÷ No. of Days in Period (365)
4. Days Receivables
Net Receivables
Net Credit Revenues ÷ No. of Days in Period (365)
Solvency Ratios
5. Debt Service Coverage Ratio (DSCR)
Change in Unrestricted Net Assets (net income)
+ Interest, Depreciation, Amortization
Maximum Annual Debt Service
6. Liabilities to Fund Balance
Total Liabilities
Unrestricted Fund Balances
Profitability Ratios
7. Operating Margin (%)
Operating Income (Loss)
Total Operating Revenues
8. Return on Total Assets (%)
EBIT (Earnings before Interest and Taxes)
Total Assets
Courtesy of Resource Group, Ltd., Dallas, Texas.
that are widely used in healthcare organizations: four liquidity types, two solvency types, and
two profitability types. All are discussed later.
LIQUIDITY RATIOS
Liquidity r.
Business Ratios are Indicators of Company Health
Ratio analysis is a process that incorporates a series of simple mathematical functions and applies ...
Similar to Avon financial ratios (20)
Your answer is incorrect. Try again.Prepare a comparati.docx
Your answer is incorrect. Try again.Prepare a comparati.docx
115Financial andOperating Ratios asPerformanceMeas.docx
115Financial andOperating Ratios asPerformanceMeas.docx
Operating Ratios asPerformanceMeasure s 11C H A P T E RTHE.docx
Operating Ratios asPerformanceMeasure s 11C H A P T E RTHE.docx
Avon financial ratios
- 1. Financial Ratio Analysis Ratios 2008 2007 2006 Net Profit Margin 0.08 0.05 0.06 Return on Stockholders’ Equity 1.30 0.75 0.60 Return on Total Asset Turnover 0.14 0.09 0.09 Total Assets Turnover 1.74 1.72 1.66 Table 1 – Extracted Ratios Liquidity Ratio Liquidity ratios measure a firm’s ability to meet maturing short-term obligations. These include Current and Quick ratios Current Ratio The current ratio serves as a test of a company's financial strength and relative efficiency. The current ratio is a financial ratio that measures whether or not a firm has enough resources to pay its debt over a 12 month period. From Appendix 1, Avon had a $1.31 in current assets for every dollar in current liabilities or its current liabilities is covered 1.31 times. In 2007 there was a decrease to $1.15 for every dollar in current liabilities, in 2008 an increase to $1.22 for every dollar in current liabilities.