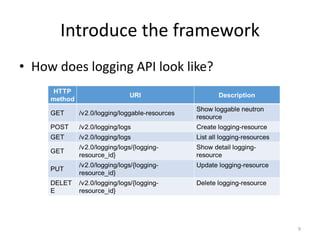
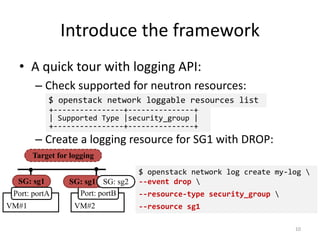
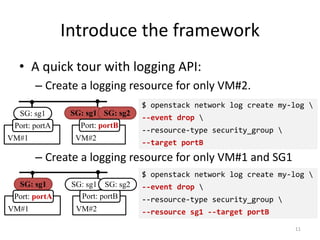
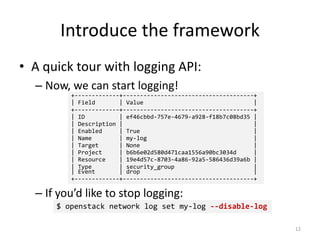
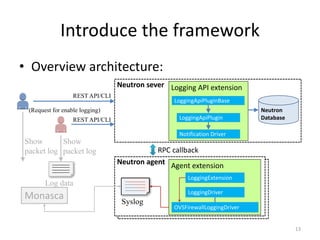
The document introduces the neutron packet logging framework. It discusses how the framework logs packets that are allowed or dropped by security policies to provide visibility for operators. It demonstrates the logging API and how to configure logging. Future plans include supporting additional resources like firewall groups and integrating with monitoring services.

![Introduce the framework
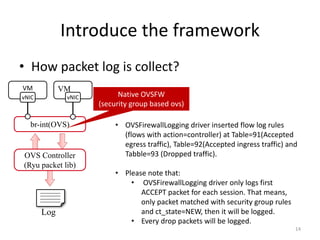
• How does packet log collect?
– Flow log rule of ACCEPT ssh packet look like:
– Flow log rule of DROP traffic looks like:
table=93, priority=53,reg5=0x1c actions=CONTROLLER:65535
table=92, priority=73,ct_state=+new-est,
tcp,reg5=0x1c,dl_dst=fa:16:3e:6f:c9:47,tp_dst=22
actions=ct(commit,zone=NXM_NX_REG6[0..15]),strip_vlan,output:28
CONTROLLER:65535
15](https://image.slidesharecdn.com/neutronpacketloggingframework-180331155146/85/Neutron-packet-logging-framework-15-320.jpg)
![Introduce the framework
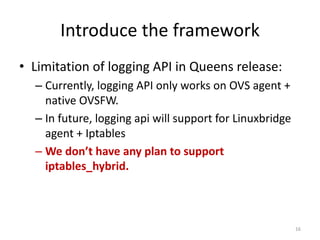
• How do I consume log-data:
– Log data would look like:
May 5 09:02:34 localhost greenthread.py: action=DROP
project_id=736672c700cd43e1bd321aeaf940365c
log_ids=['44a2e297-60ef-4bdd-8cad-14917cbefe9c']
vm_port=0720a67d-3e29-4231-891a-e0ac681bdc7f
pkt=ethernet(dst='fa:16:3e:6f:c9:47',ethertype=2048,src='fa:16:3e:50:aa:b5'),
ipv4(csum=43626,dst='10.0.0.11',flags=2,header_length=5,identification=55076,offset=0,
option=None,proto=6,src='172.24.4.10',tos=0,total_length=60,ttl=63,version=4),
tcp(ack=0,bits=2,csum=14680,dst_port=22,offset=10,
option=[TCPOptionMaximumSegmentSize(kind=2,length=4,max_seg_size=1460),
TCPOptionSACKPermitted(kind=4,length=2),
TCPOptionTimestamps(kind=8,length=10,ts_ecr=0,ts_val=196380390),
TCPOptionNoOperation(kind=1,length=1),
TCPOptionWindowScale(kind=3,length=3,shift_cnt=3)],
seq=571457376,src_port=42838,urgent=0,window_size=14600)
• Where packet is dropped?
• Source/destination IP
• Source/destination MAC
• Source/destination port
• Protocol
• Date
• Packet action
(ACCEPT or DROP)
• Project
• Log resource ID
17](https://image.slidesharecdn.com/neutronpacketloggingframework-180331155146/85/Neutron-packet-logging-framework-17-320.jpg)
![How do I setup logging API
• Enable logging service in server-side by setting in
/etc/neutron/neutron.conf:
• service_plugins=log,..
• Enable logging extension in agent-side by setting in
/etc/neutron/plugins/ml2/ml2_conf.ini
• [agent] extensions=log,…
• Reference:
• https://docs.openstack.org/neutron/latest/admin/config-
logging.html
• https://developer.openstack.org/api-
ref/network/v2/index.html#logging
20](https://image.slidesharecdn.com/neutronpacketloggingframework-180331155146/85/Neutron-packet-logging-framework-20-320.jpg)

![Future plan
• In Rocky:
– Support logging for security group based iptables on
LinuxBridge agent [1]
– SNAT log and Firewall log [2]
• After rocky:
– Integrate with Monasca or develop a new project to detect
attack pattern and alarm to user if there is some suspicion.
[1] https://review.openstack.org/#/c/445827/
[2] https://bugs.launchpad.net/neutron/+bug/1752290
22](https://image.slidesharecdn.com/neutronpacketloggingframework-180331155146/85/Neutron-packet-logging-framework-22-320.jpg)
