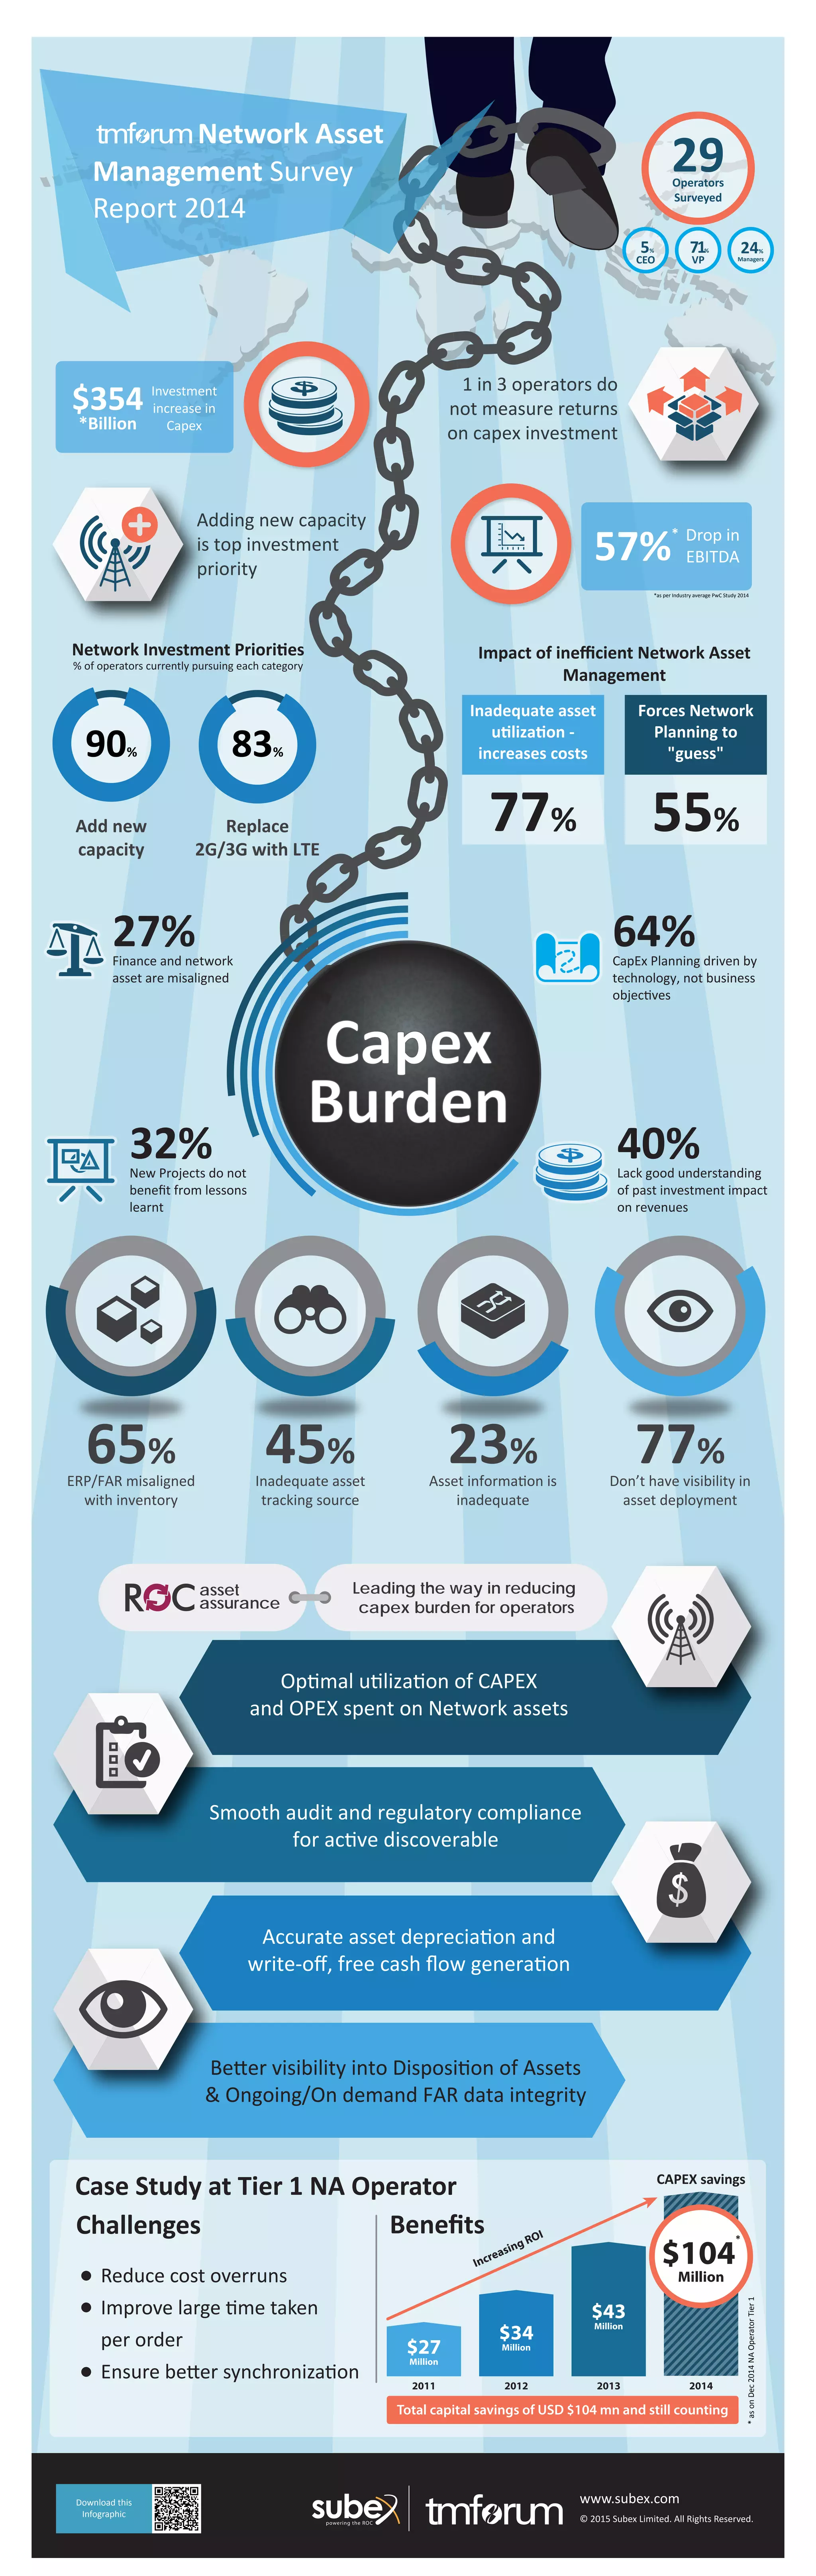
© 2015 Subex Limited. All Rights Reserved.
www.subex.comDownload this
Infographic
$354 Investment
increase in
Capex*Billion
1 in 3 operators do
not measure returns
on capex investment
Adding new capacity
is top investment
priority
ERP/FAR misaligned
with inventory
65%
Inadequate asset
tracking source
45%
Asset information is
inadequate
23%
Don’t have visibility in
asset deployment
77%
57%* Drop in
EBITDA
*as per Industry average PwC Study 2014
New Projects do not
benefit from lessons
learnt
32% Lack good understanding
of past investment impact
on revenues
40%
CapEx Planning driven by
technology, not business
objectives
64%Finance and network
asset are misaligned
27%
Management Survey
Report 2014
Network Asset
Operators
Surveyed
29
90%
Add new
capacity
83%
Replace
2G/3G with LTE
Network Investment Priorities
% of operators currently pursuing each category
Impact of inefficient Network Asset
Management
77%
Inadequate asset
utilization -
increases costs
55%
Forces Network
Planning to
"guess"
VP
71%
Managers
24%
CEO
5%
Capex
Burden
BenefitsChallenges
Reduce cost overruns
Improve large time taken
per order
Ensure better synchronization
Case Study at Tier 1 NA Operator CAPEX savings
*asonDec2014NAOperatorTier1
2011
$27
Million
2012 2014
$34
Million
2013
$43
Million
$104
*
Million
Increasing ROI
Total capital savings of USD $104 mn and still counting
Better visibility into Disposition of Assets
& Ongoing/On demand FAR data integrity
Accurate asset depreciation and
write-off, free cash flow generation
Smooth audit and regulatory compliance
for active discoverable
Optimal utilization of CAPEX
and OPEX spent on Network assets
Leading the way in reducing
capex burden for operators
asset
assurance

TMForum Network Asset Management Survey Report 2014

  • 1.
    © 2015 SubexLimited. All Rights Reserved. www.subex.comDownload this Infographic $354 Investment increase in Capex*Billion 1 in 3 operators do not measure returns on capex investment Adding new capacity is top investment priority ERP/FAR misaligned with inventory 65% Inadequate asset tracking source 45% Asset information is inadequate 23% Don’t have visibility in asset deployment 77% 57%* Drop in EBITDA *as per Industry average PwC Study 2014 New Projects do not benefit from lessons learnt 32% Lack good understanding of past investment impact on revenues 40% CapEx Planning driven by technology, not business objectives 64%Finance and network asset are misaligned 27% Management Survey Report 2014 Network Asset Operators Surveyed 29 90% Add new capacity 83% Replace 2G/3G with LTE Network Investment Priorities % of operators currently pursuing each category Impact of inefficient Network Asset Management 77% Inadequate asset utilization - increases costs 55% Forces Network Planning to "guess" VP 71% Managers 24% CEO 5% Capex Burden BenefitsChallenges Reduce cost overruns Improve large time taken per order Ensure better synchronization Case Study at Tier 1 NA Operator CAPEX savings *asonDec2014NAOperatorTier1 2011 $27 Million 2012 2014 $34 Million 2013 $43 Million $104 * Million Increasing ROI Total capital savings of USD $104 mn and still counting Better visibility into Disposition of Assets & Ongoing/On demand FAR data integrity Accurate asset depreciation and write-off, free cash flow generation Smooth audit and regulatory compliance for active discoverable Optimal utilization of CAPEX and OPEX spent on Network assets Leading the way in reducing capex burden for operators asset assurance