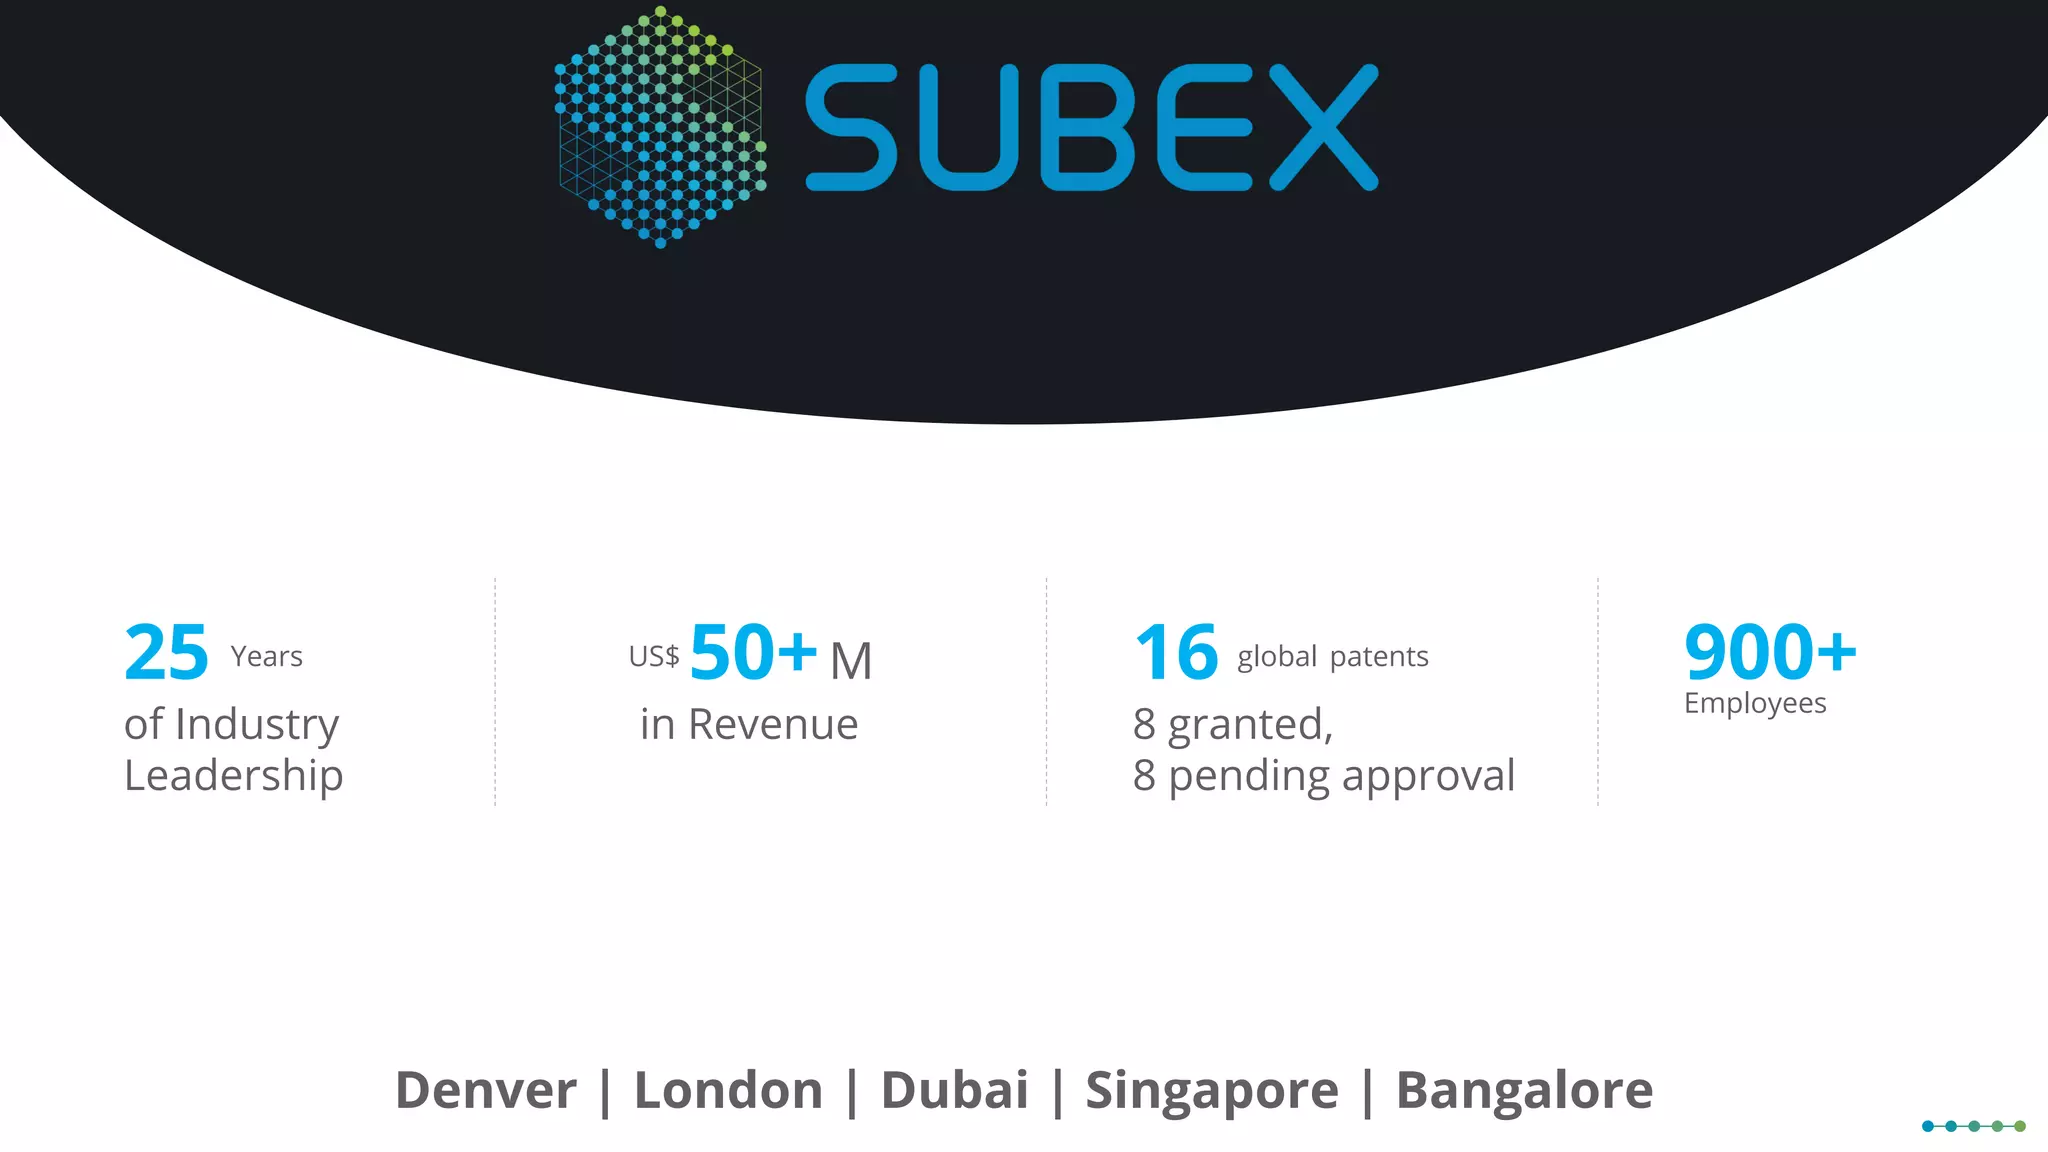
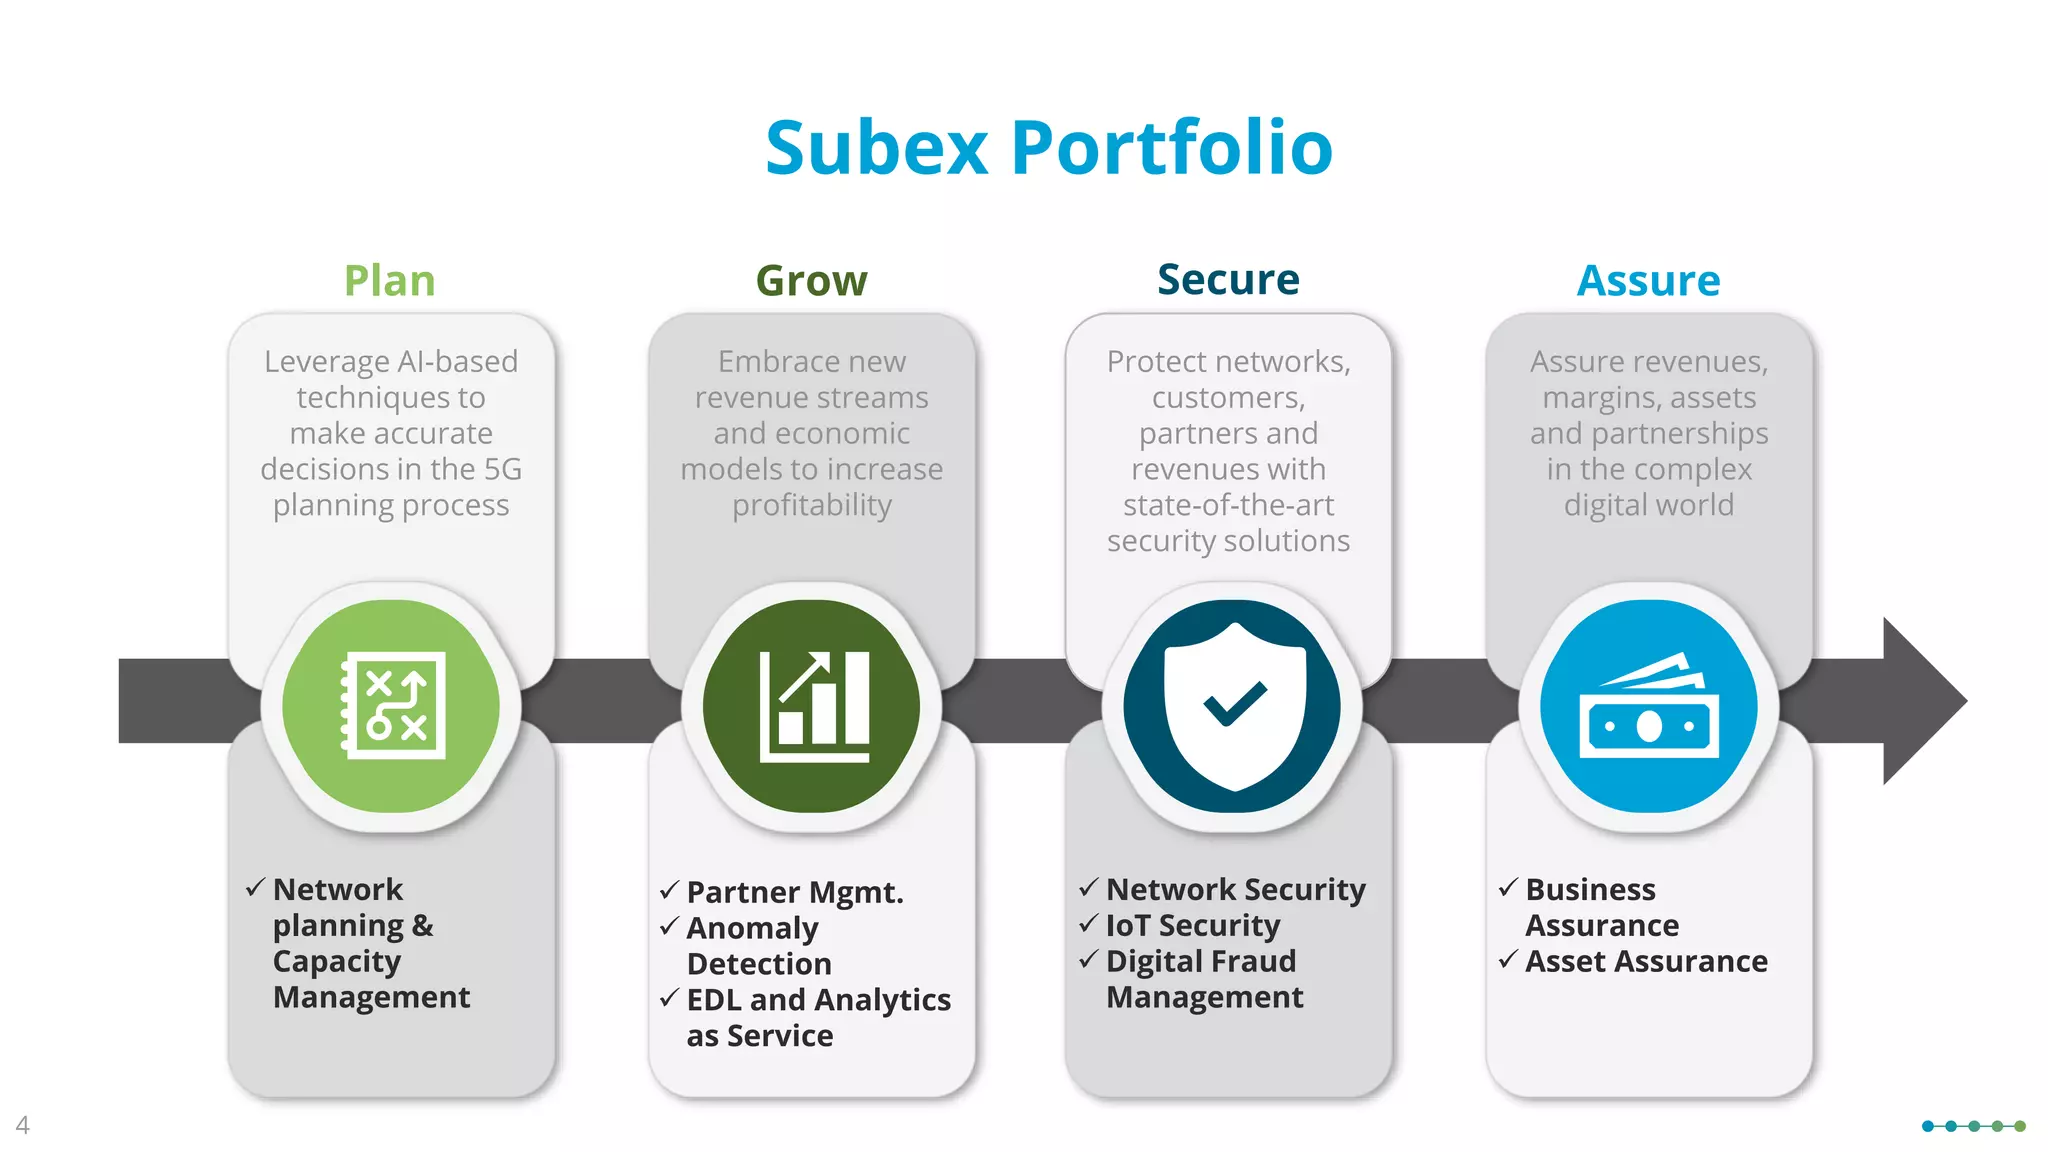
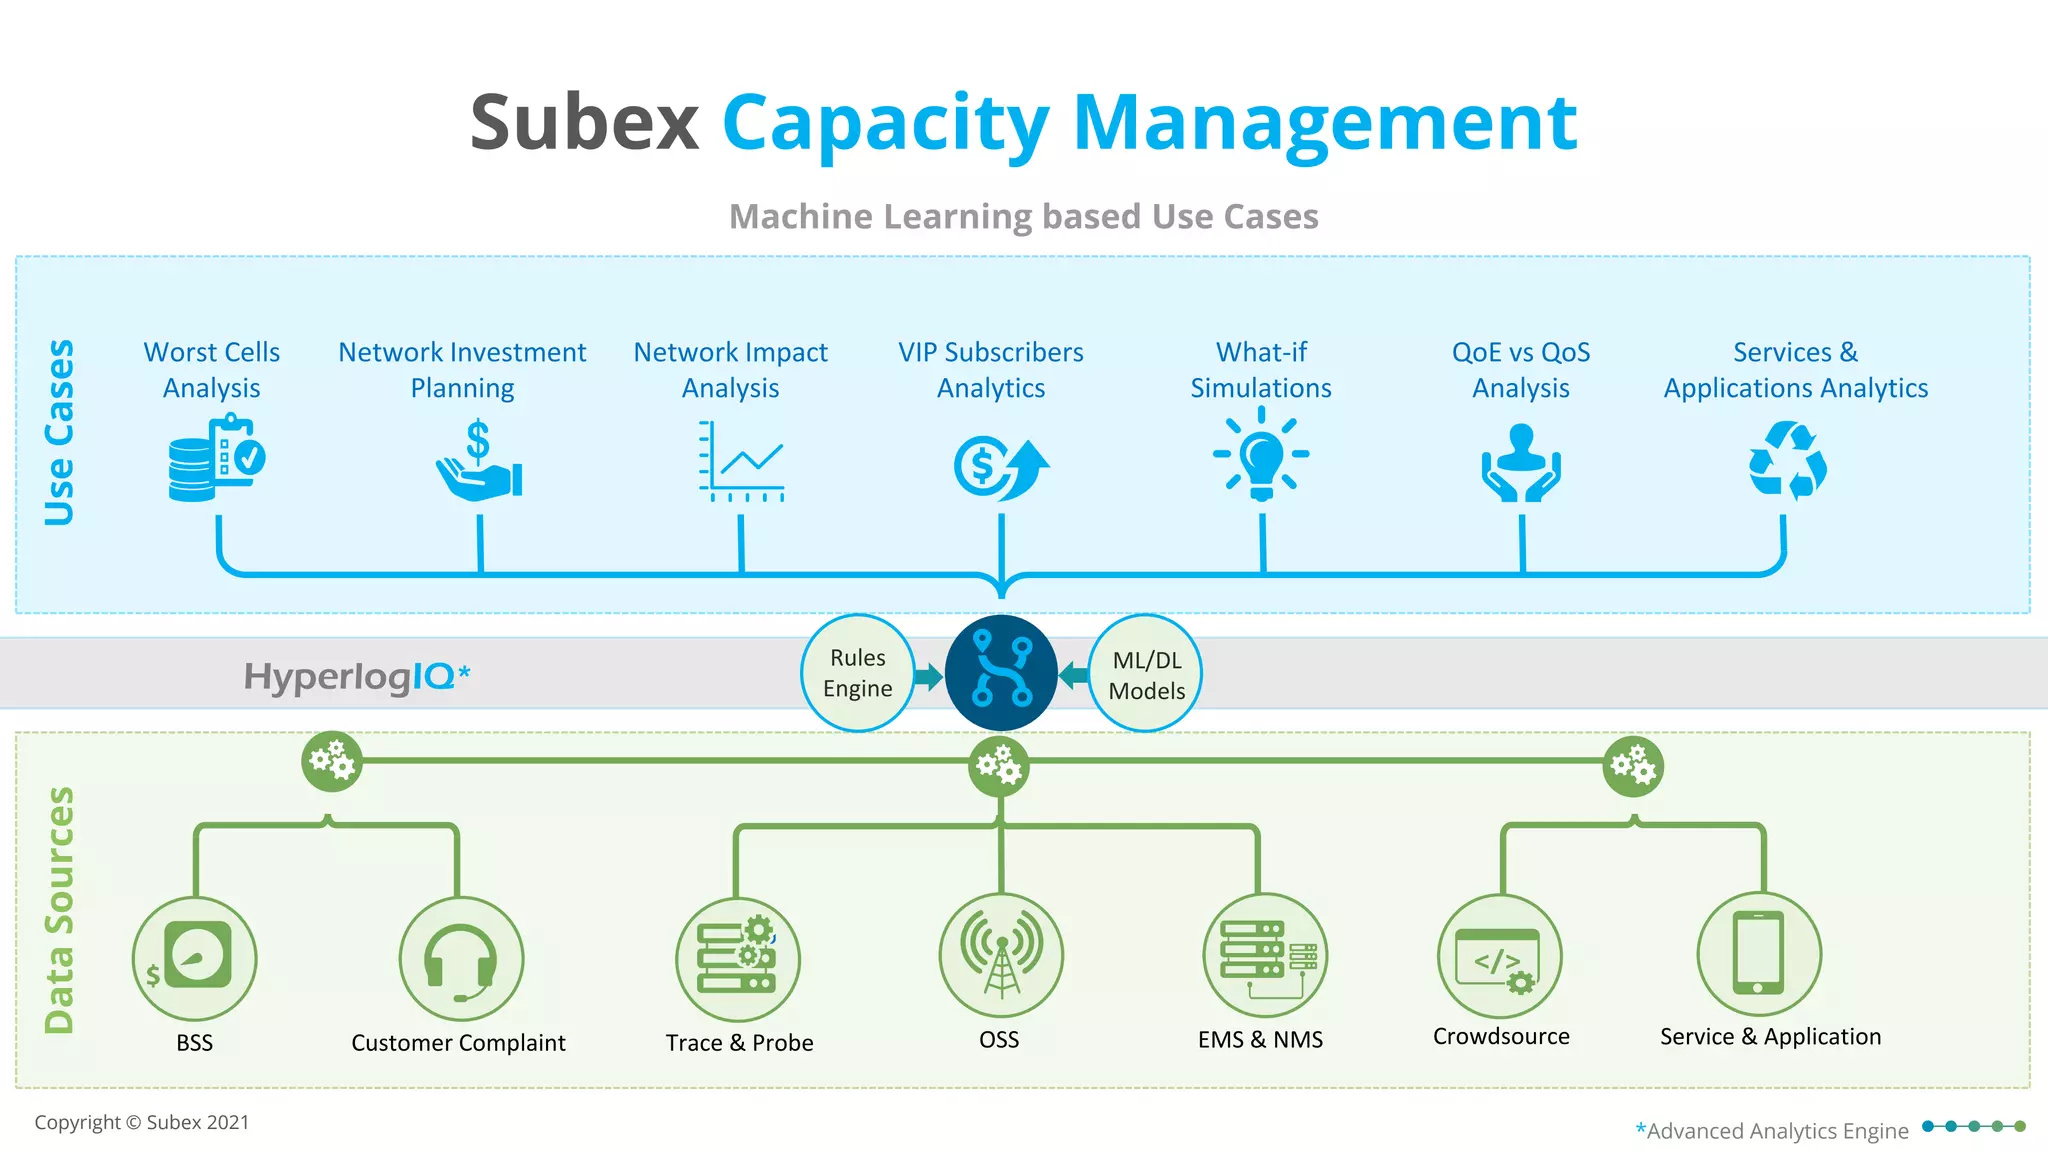
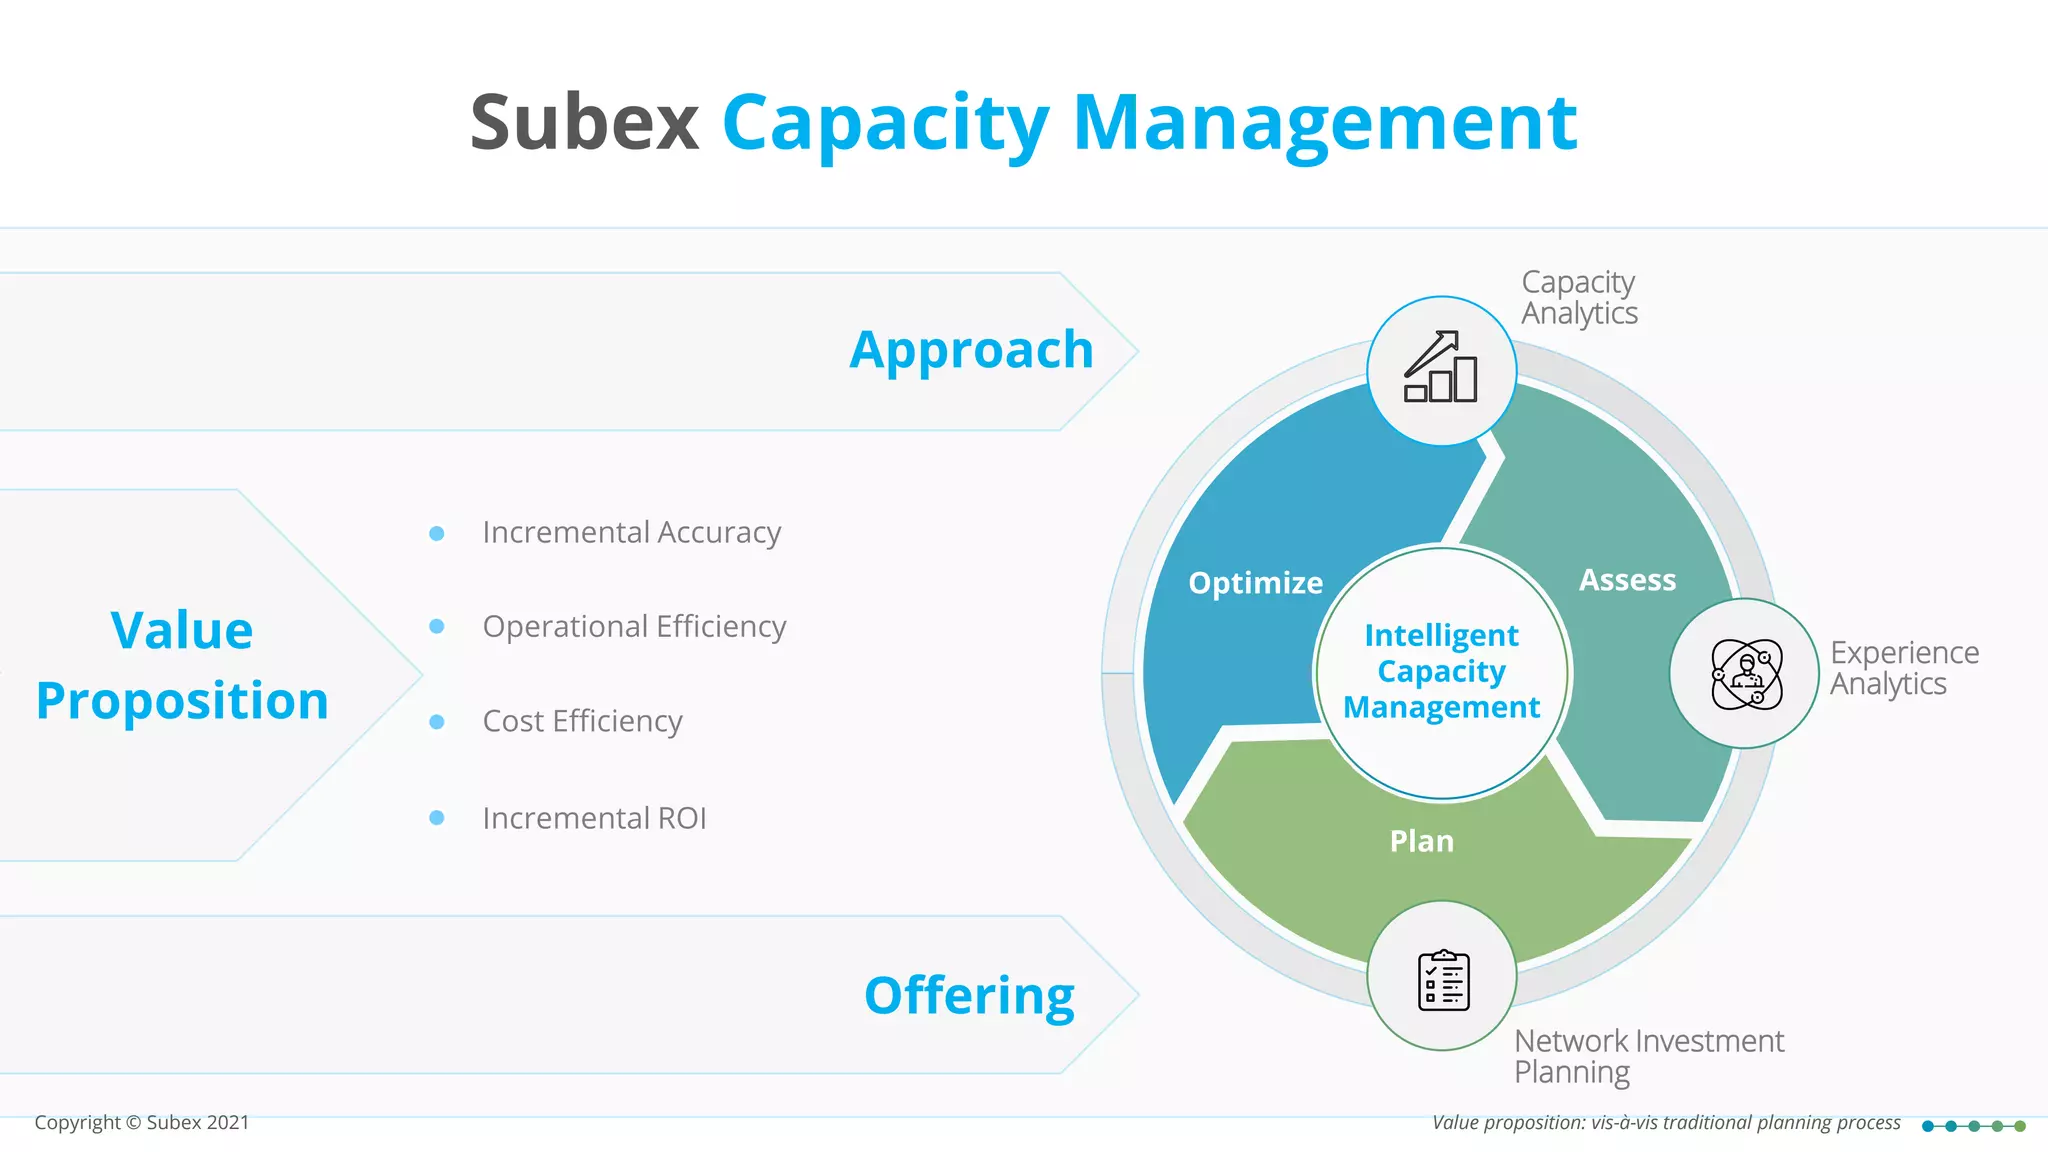
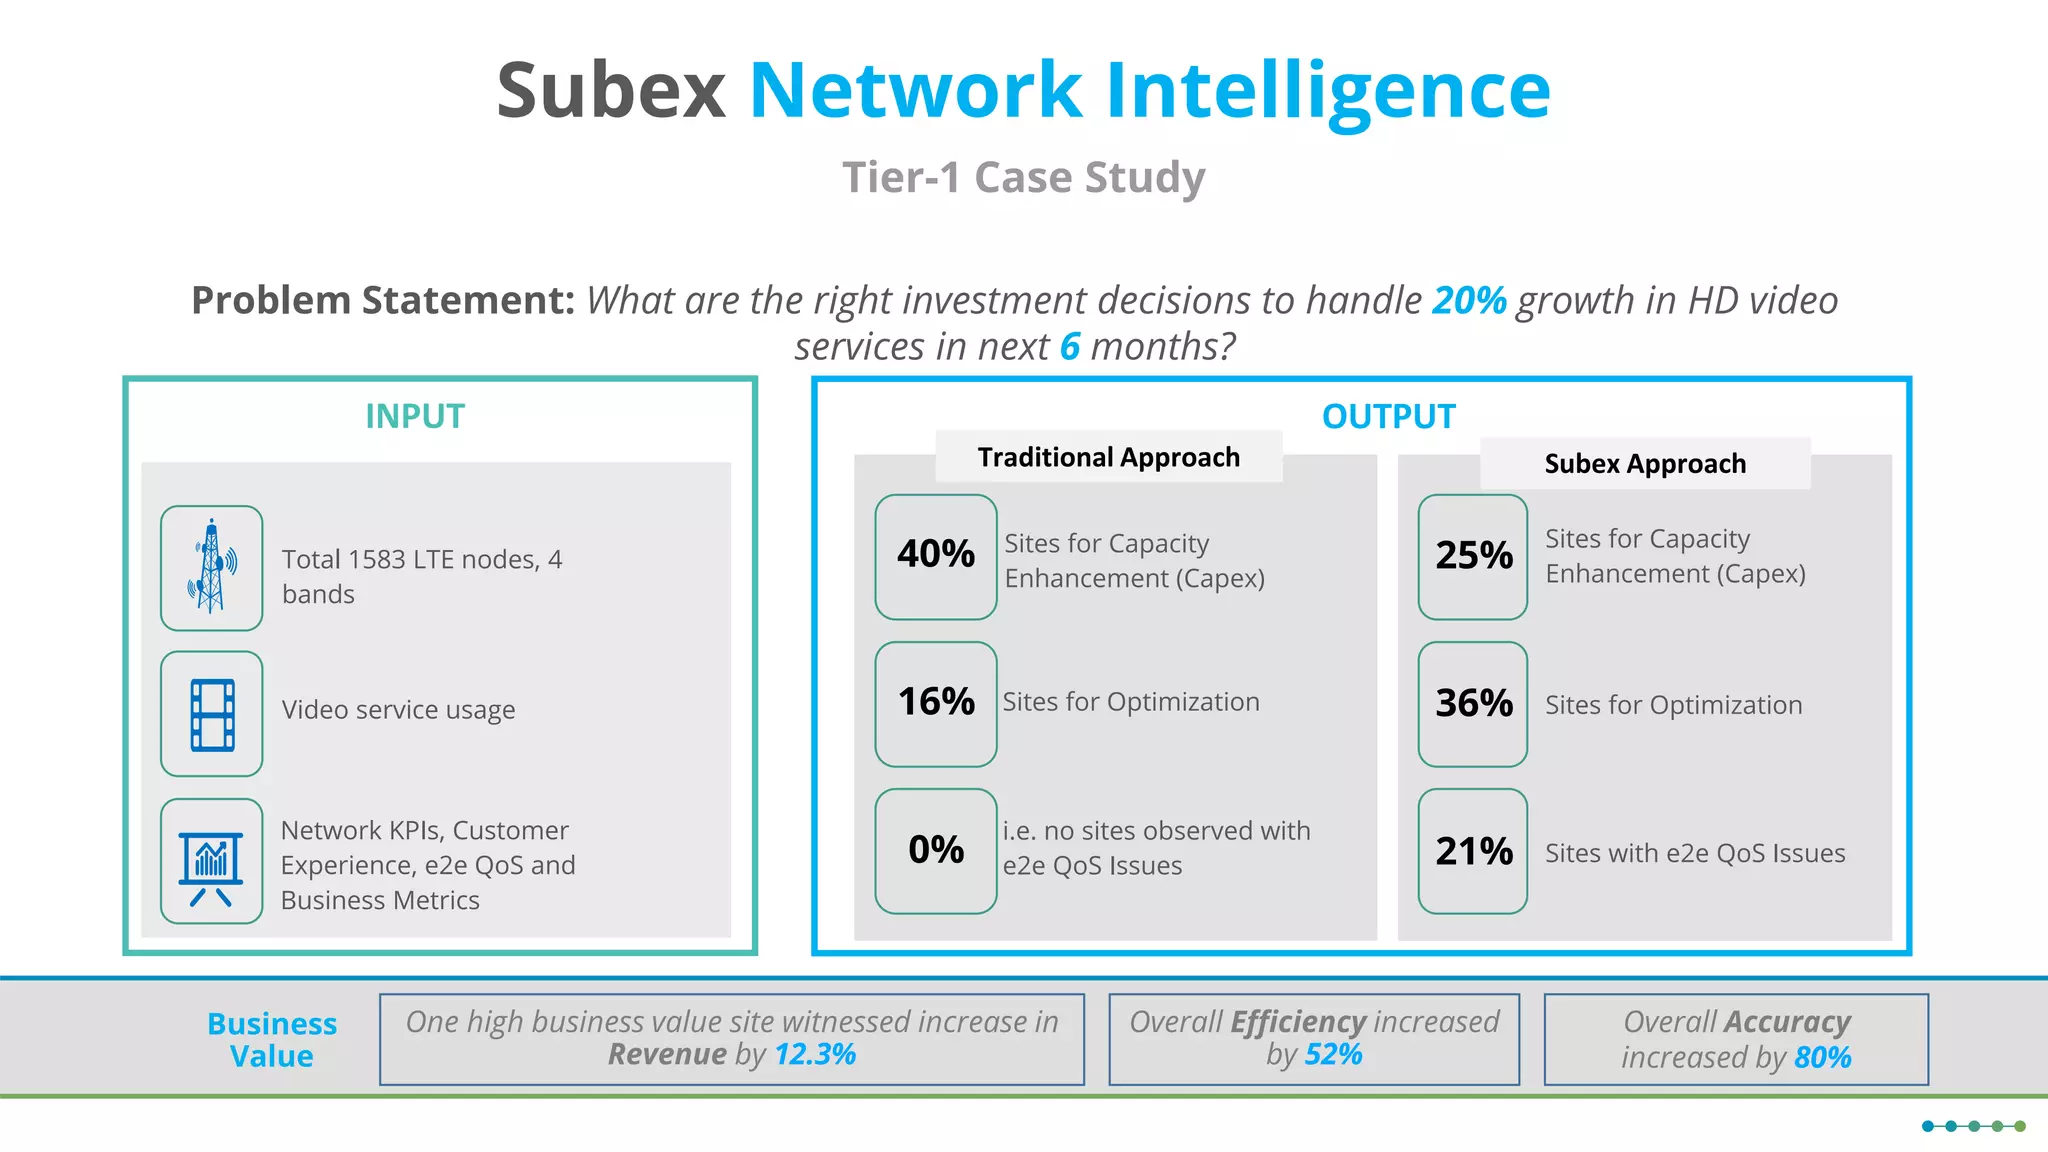
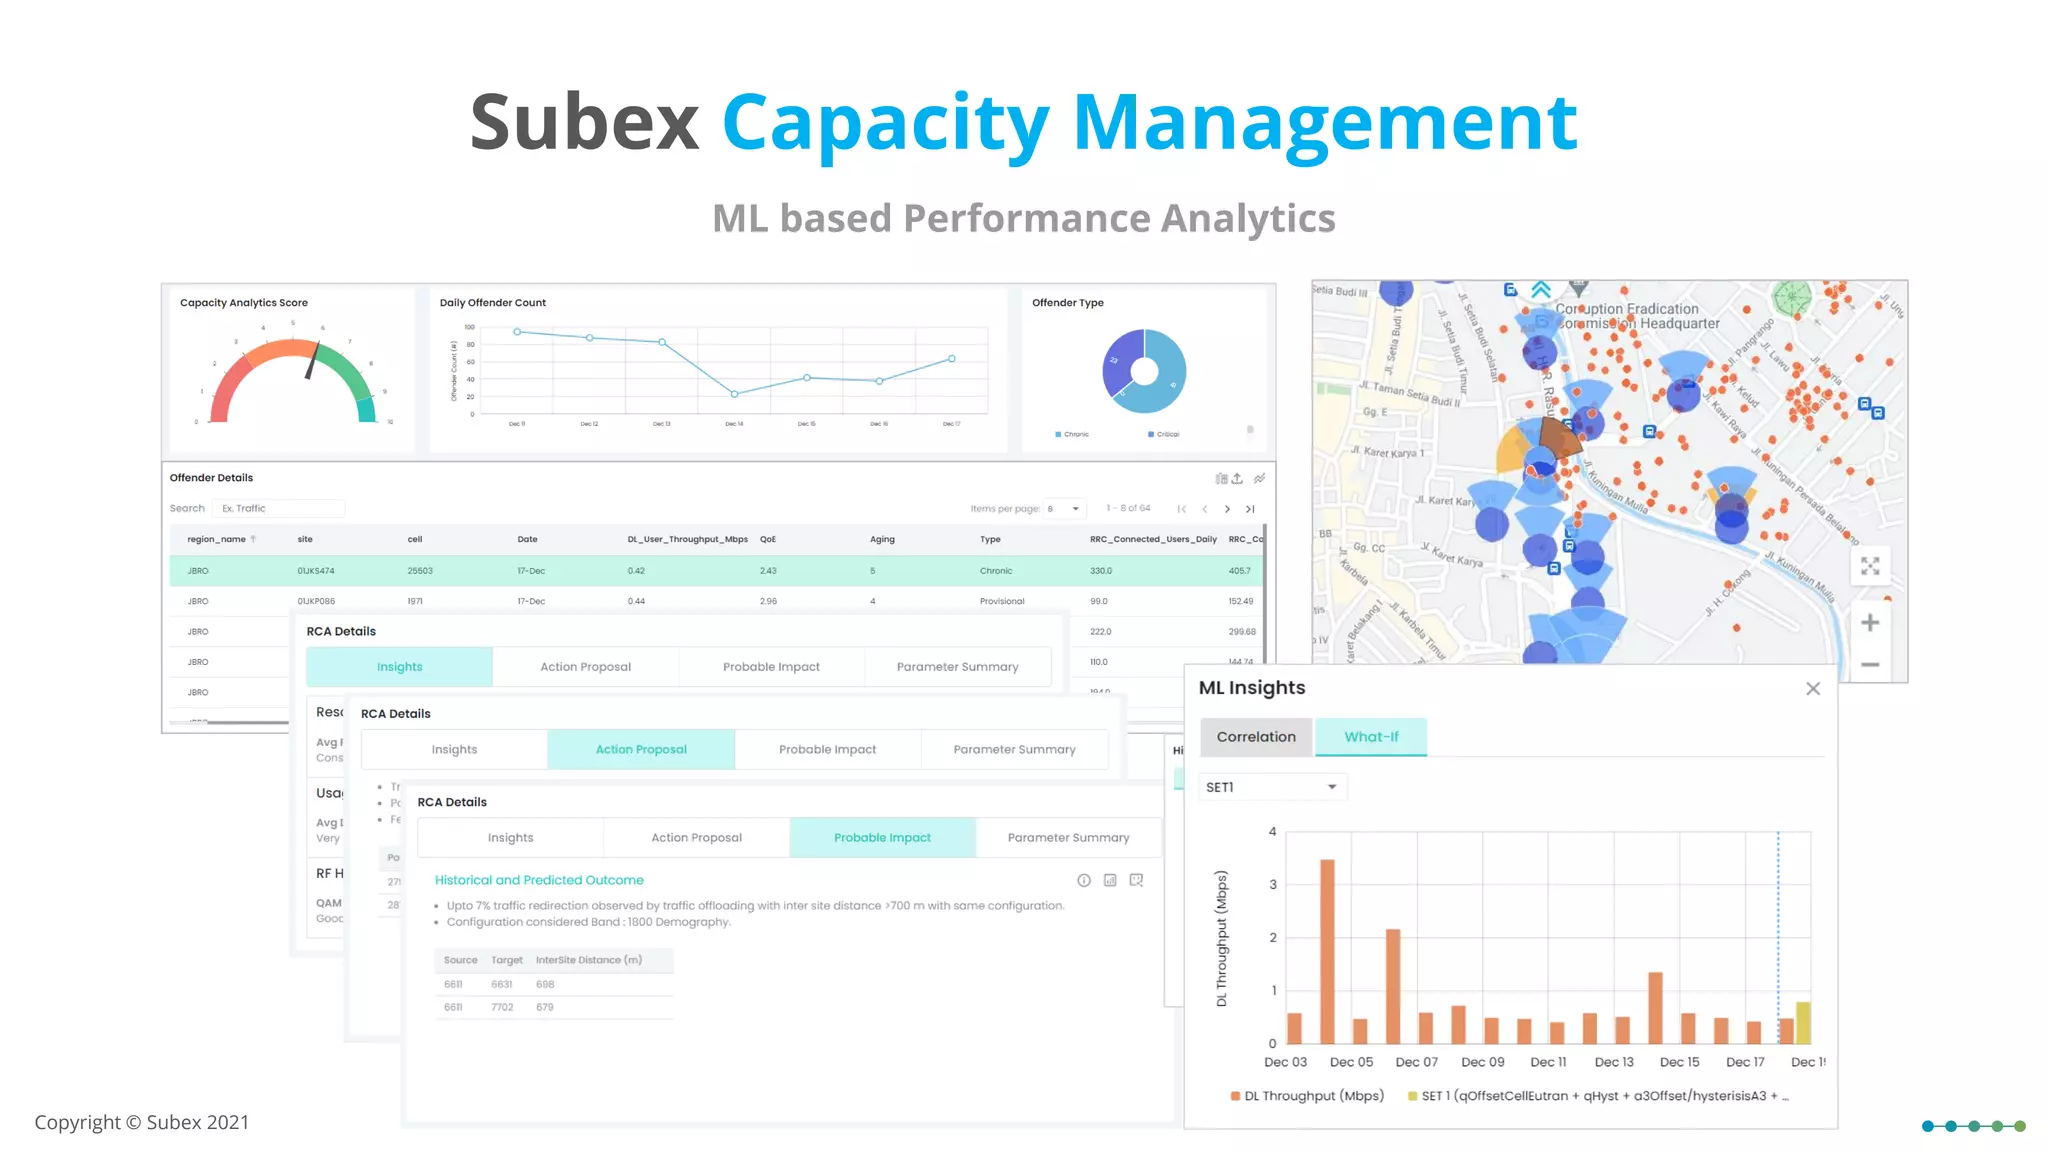
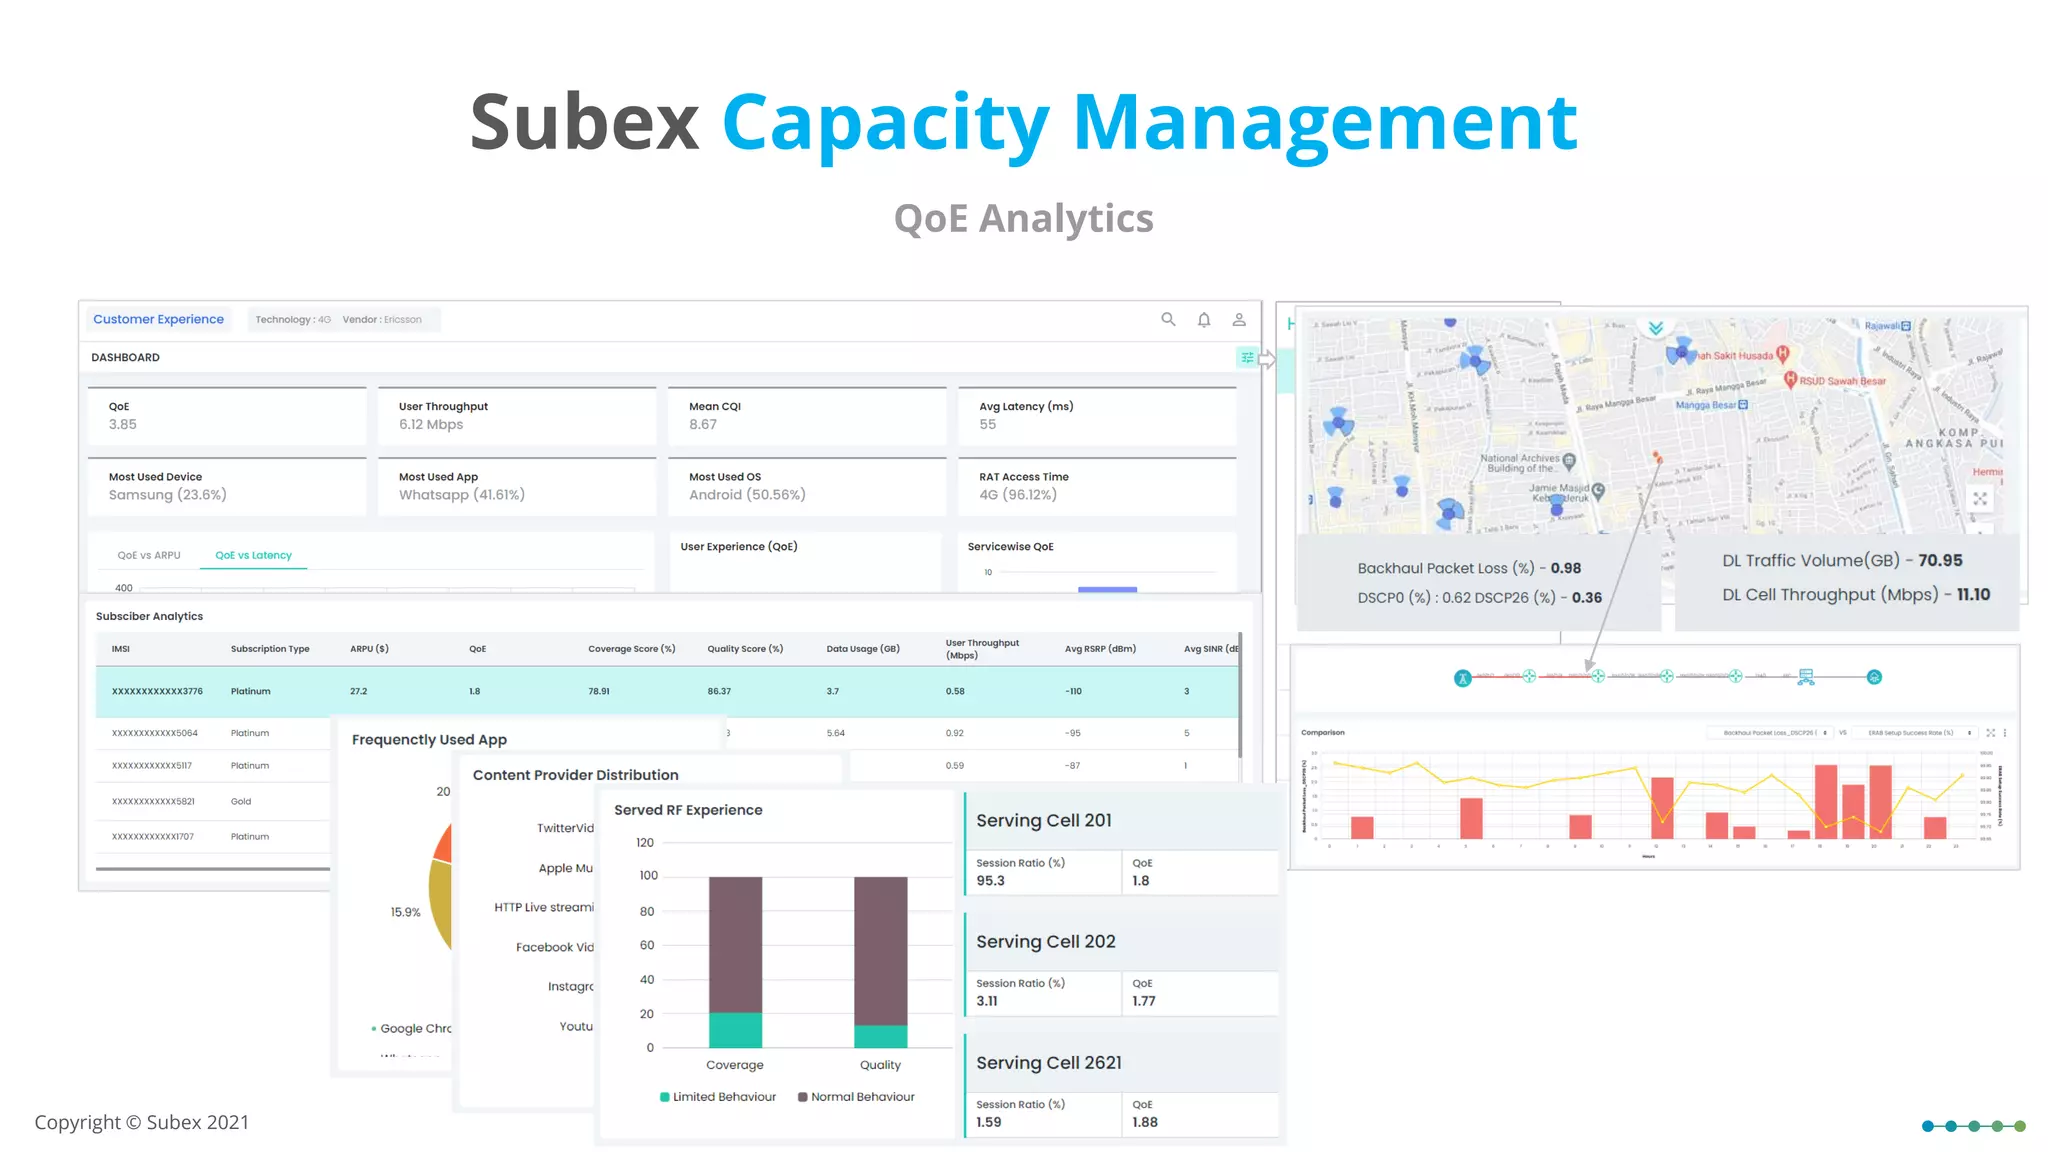
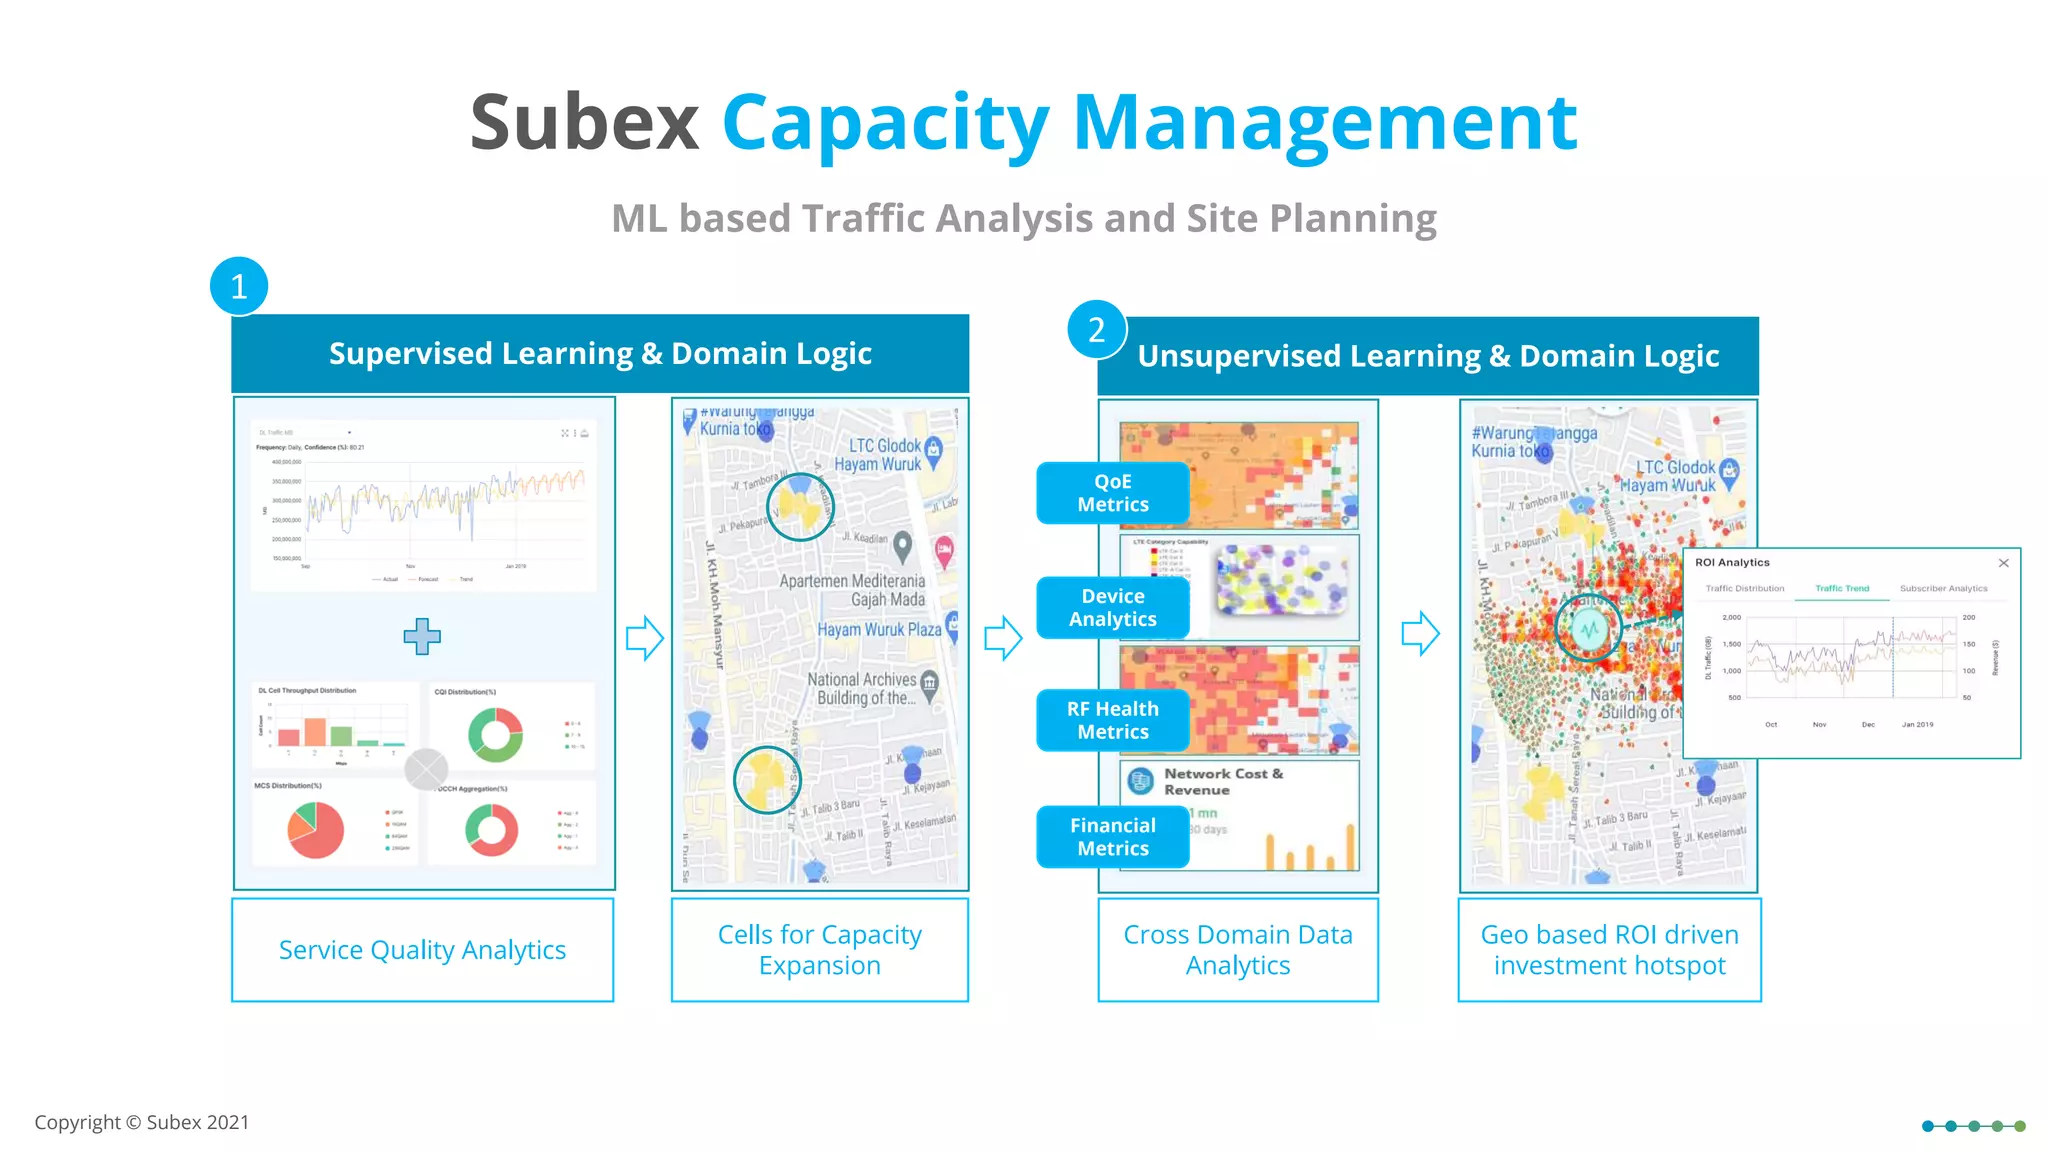
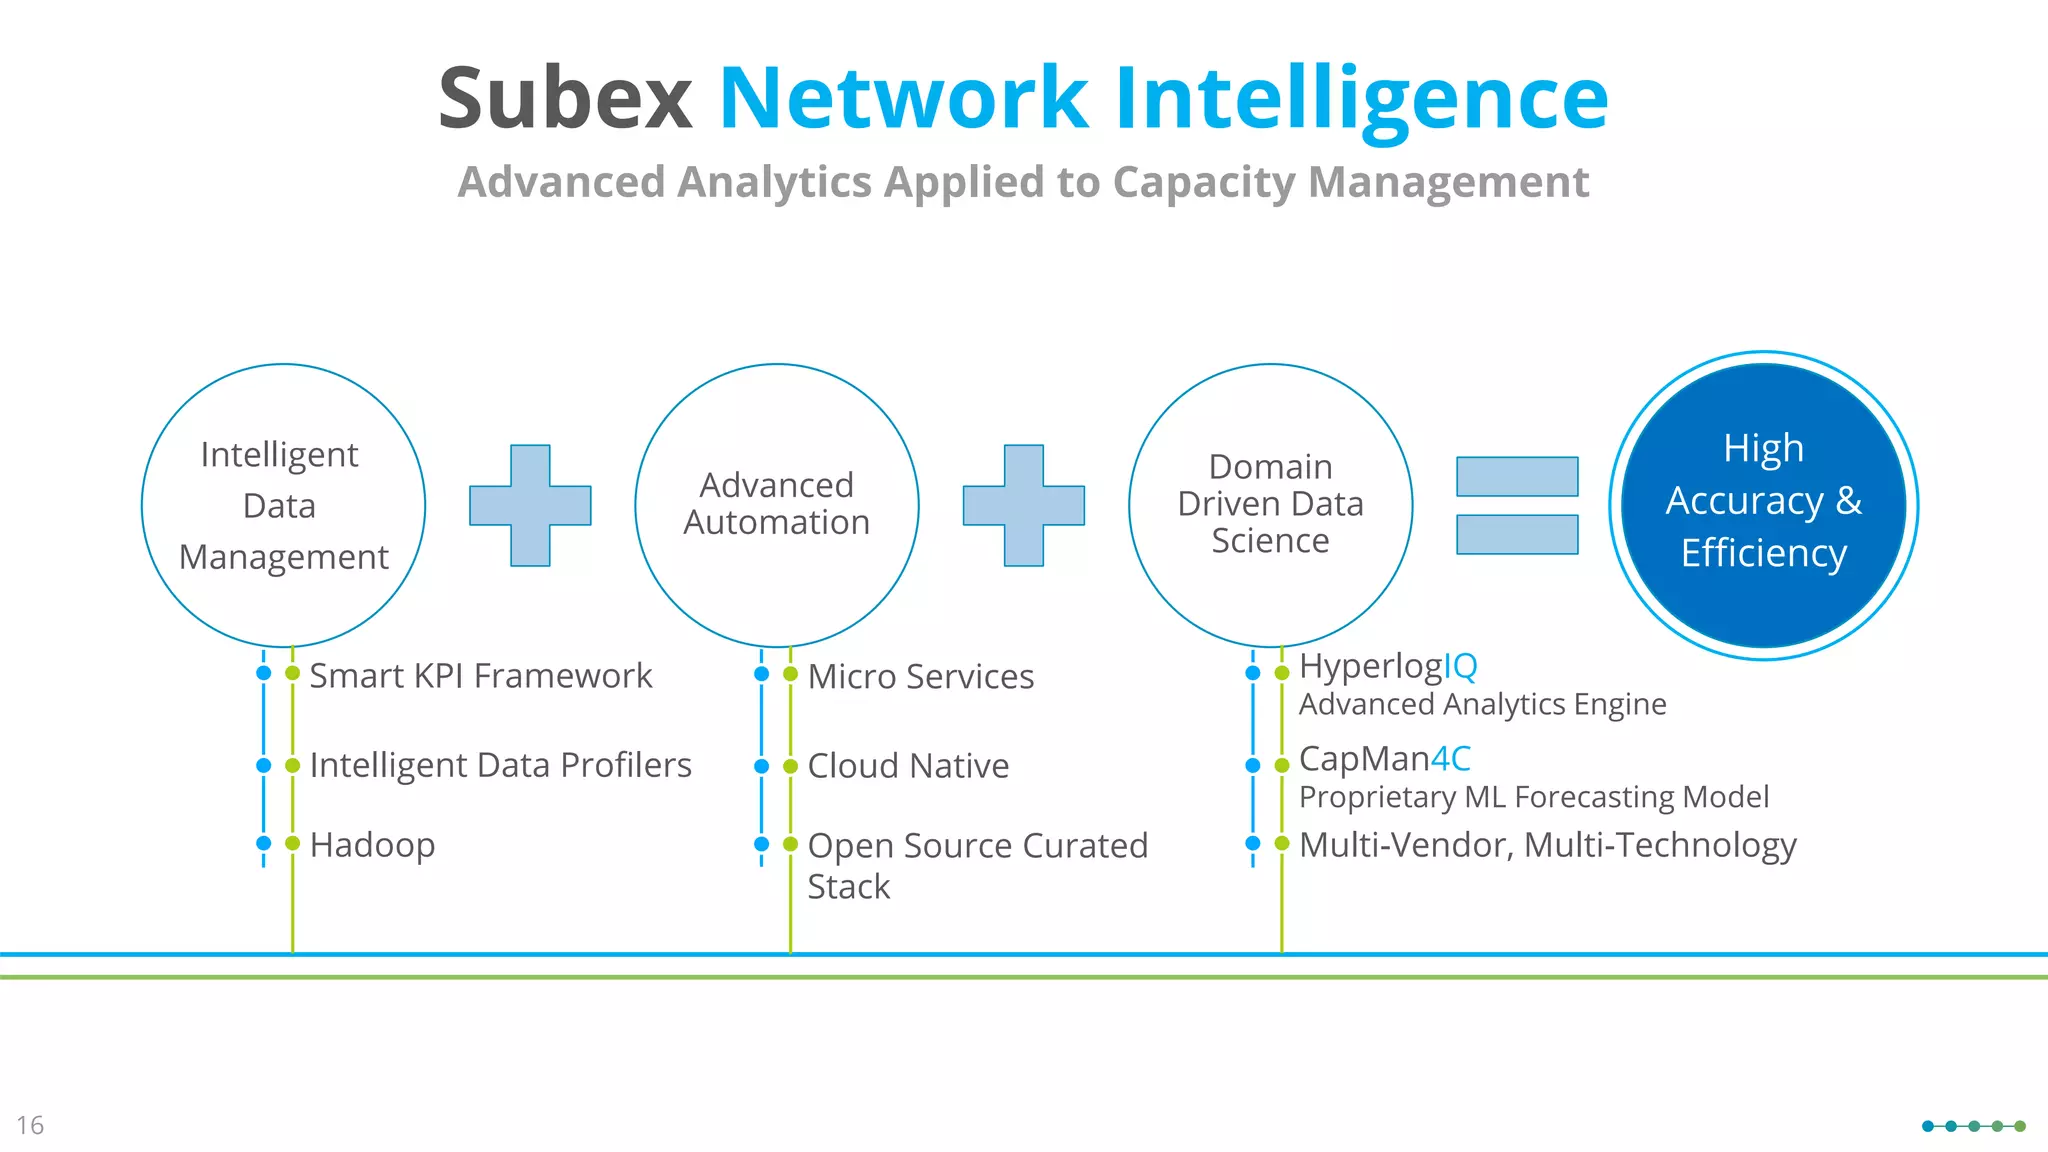
Subex Network Analytics
Portfolio Presentation
25 Years
of Industry
Leadership
US$ 50+M
in Revenue
900+
Employees
16 global patents
8 granted,
8 pending approval
Denver | London | Dubai | Singapore | Bangalore
3
300+ Installation in
90+ Countries
200+
Global customers
4
Leverage AI-based
techniques to
make accurate
decisions in the 5G
planning process
Plan
Embrace new
revenue streams
and economic
models to increase
profitability
Grow
Protect networks,
customers,
partners and
revenues with
state-of-the-art
security solutions
Secure
Assure revenues,
margins, assets
and partnerships
in the complex
digital world
Assure
✓ Network
planning &
Capacity
Management
✓ Partner Mgmt.
✓ Anomaly
Detection
✓ EDL and Analytics
as Service
✓ Network Security
✓ IoT Security
✓ Digital Fraud
Management
✓ Business
Assurance
✓ Asset Assurance
Subex Portfolio
Subex Capacity Management
December 21 www.subex.com
Proprietary and Confidential
Leveraging Machine Learning to Manage Network Complexities
Industry Headwinds
Developed Growth Developing Growth
3%
2%
1%
0%
2018 2019 2020 2021 2022 2023 2024 2025
Mobile revenue (billion), YoY growth
Modest revenue growth
7.5
28
10
50
35
7.6 8.3
29 28 28
24
6.8
0.8
4.7
9.8
5.3
x4 2019 2025
Data growth
World North
America
Europe &
CIS
Asia
Pacific
MENA Greater
China
Latin
America
Sub-Saharan
Africa
0
20
40
60
80
100
2010 2011 2012 2013 2014 2015 2016 2017
Revenue per bit,
100 indexed (100=2010)
Cost per bit,
Ratio of revenue per bit
Rapid data growth
Pressure on margins
Increasing network complexity
Features
Services
Spectrum
RAT
Densification
KPIs
The Challenge
Balancing network investments, customer experience and profitability
Service Performance
Network Cost Service Revenue
maximise margin
Network Impact
Analysis
VIP Subscribers
Analytics
Services &
Applications Analytics
Network Investment
Planning
QoE vs QoS
Analysis
What-if
Simulations
Worst Cells
Analysis
Crowdsource
Customer Complaint Trace & Probe OSS EMS & NMS Service & Application
BSS
ML/DL
Models
Rules
Engine
HyperlogIQ*
*Advanced Analytics Engine
Data
Sources
Use
Cases
Subex Capacity Management
Machine Learning based Use Cases
Copyright © Subex 2021
Approach
Offering
Optimize Assess
Plan
Intelligent
Capacity
Management
Incremental Accuracy
Operational Efficiency
Cost Efficiency
Incremental ROI
Value
Proposition
Network Investment
Planning
Capacity
Analytics
Experience
Analytics
Value proposition: vis-à-vis traditional planning process
Copyright © Subex 2021
Subex Capacity Management
Subex Network Intelligence
Tier-1 Case Study
Problem Statement: What are the right investment decisions to handle 20% growth in HD video
services in next 6 months?
INPUT
Total 1583 LTE nodes, 4
bands
Video service usage
Network KPIs, Customer
Experience, e2e QoS and
Business Metrics
Subex Approach
25%
36%
21%
Sites for Capacity
Enhancement (Capex)
Sites for Optimization
Sites with e2e QoS Issues
Traditional Approach
40%
16%
0%
Sites for Capacity
Enhancement (Capex)
Sites for Optimization
i.e. no sites observed with
e2e QoS Issues
OUTPUT
One high business value site witnessed increase in
Revenue by 12.3%
Overall Efficiency increased
by 52%
Overall Accuracy
increased by 80%
Business
Value
Subex Capacity Management
ML based Performance Analytics
Copyright © Subex 2021
Subex Capacity Management
QoE Analytics
Copyright © Subex 2021
QoE
Metrics
RF Health
Metrics
Device
Analytics
Financial
Metrics
Supervised Learning & Domain Logic
1
Unsupervised Learning & Domain Logic
Cross Domain Data
Analytics
Geo based ROI driven
investment hotspot
Service Quality Analytics
Cells for Capacity
Expansion
2
Subex Capacity Management
ML based Traffic Analysis and Site Planning
Copyright © Subex 2021
Coverage Analysis for Capacity Planning
Copyright © Subex 2021
Subex Network Intelligence
Network
Investment
Planning
Business
• Revenue per
cell/site
• ARPU
• Churn
• VIP Subscribers
• Competition
Network
• Capacity KPIs trend
analysis
• Service-driven
KPIs/KQIs modeling
• QoE and QoS
mapping
Network Investment Planning
Customer Experience
• UE Throughput
• Stall time/length
• NPS
• MOS
15
16
Subex Network Intelligence
Advanced
Automation
Domain
Driven Data
Science
Advanced Analytics Applied to Capacity Management
Smart KPI Framework
Intelligent Data Profilers
Hadoop
Micro Services
Cloud Native
Open Source Curated
Stack
HyperlogIQ
Advanced Analytics Engine
CapMan4C
Proprietary ML Forecasting Model
Multi-Vendor, Multi-Technology
High
Accuracy &
Efficiency
Intelligent
Data
Management
Deepal Jain | Deepal.jain@subex.com
www.subex.com
Thank You
Copyright © Subex 2021

2021_Dec_Subex Network Analytics.pdf

  • 1.
  • 2.
    25 Years of Industry Leadership US$50+M in Revenue 900+ Employees 16 global patents 8 granted, 8 pending approval Denver | London | Dubai | Singapore | Bangalore
  • 3.
    3 300+ Installation in 90+Countries 200+ Global customers
  • 4.
    4 Leverage AI-based techniques to makeaccurate decisions in the 5G planning process Plan Embrace new revenue streams and economic models to increase profitability Grow Protect networks, customers, partners and revenues with state-of-the-art security solutions Secure Assure revenues, margins, assets and partnerships in the complex digital world Assure ✓ Network planning & Capacity Management ✓ Partner Mgmt. ✓ Anomaly Detection ✓ EDL and Analytics as Service ✓ Network Security ✓ IoT Security ✓ Digital Fraud Management ✓ Business Assurance ✓ Asset Assurance Subex Portfolio
  • 5.
    Subex Capacity Management December21 www.subex.com Proprietary and Confidential Leveraging Machine Learning to Manage Network Complexities
  • 6.
    Industry Headwinds Developed GrowthDeveloping Growth 3% 2% 1% 0% 2018 2019 2020 2021 2022 2023 2024 2025 Mobile revenue (billion), YoY growth Modest revenue growth 7.5 28 10 50 35 7.6 8.3 29 28 28 24 6.8 0.8 4.7 9.8 5.3 x4 2019 2025 Data growth World North America Europe & CIS Asia Pacific MENA Greater China Latin America Sub-Saharan Africa 0 20 40 60 80 100 2010 2011 2012 2013 2014 2015 2016 2017 Revenue per bit, 100 indexed (100=2010) Cost per bit, Ratio of revenue per bit Rapid data growth Pressure on margins Increasing network complexity Features Services Spectrum RAT Densification KPIs
  • 7.
    The Challenge Balancing networkinvestments, customer experience and profitability Service Performance Network Cost Service Revenue maximise margin
  • 8.
    Network Impact Analysis VIP Subscribers Analytics Services& Applications Analytics Network Investment Planning QoE vs QoS Analysis What-if Simulations Worst Cells Analysis Crowdsource Customer Complaint Trace & Probe OSS EMS & NMS Service & Application BSS ML/DL Models Rules Engine HyperlogIQ* *Advanced Analytics Engine Data Sources Use Cases Subex Capacity Management Machine Learning based Use Cases Copyright © Subex 2021
  • 9.
    Approach Offering Optimize Assess Plan Intelligent Capacity Management Incremental Accuracy OperationalEfficiency Cost Efficiency Incremental ROI Value Proposition Network Investment Planning Capacity Analytics Experience Analytics Value proposition: vis-à-vis traditional planning process Copyright © Subex 2021 Subex Capacity Management
  • 10.
    Subex Network Intelligence Tier-1Case Study Problem Statement: What are the right investment decisions to handle 20% growth in HD video services in next 6 months? INPUT Total 1583 LTE nodes, 4 bands Video service usage Network KPIs, Customer Experience, e2e QoS and Business Metrics Subex Approach 25% 36% 21% Sites for Capacity Enhancement (Capex) Sites for Optimization Sites with e2e QoS Issues Traditional Approach 40% 16% 0% Sites for Capacity Enhancement (Capex) Sites for Optimization i.e. no sites observed with e2e QoS Issues OUTPUT One high business value site witnessed increase in Revenue by 12.3% Overall Efficiency increased by 52% Overall Accuracy increased by 80% Business Value
  • 11.
    Subex Capacity Management MLbased Performance Analytics Copyright © Subex 2021
  • 12.
    Subex Capacity Management QoEAnalytics Copyright © Subex 2021
  • 13.
    QoE Metrics RF Health Metrics Device Analytics Financial Metrics Supervised Learning& Domain Logic 1 Unsupervised Learning & Domain Logic Cross Domain Data Analytics Geo based ROI driven investment hotspot Service Quality Analytics Cells for Capacity Expansion 2 Subex Capacity Management ML based Traffic Analysis and Site Planning Copyright © Subex 2021
  • 14.
    Coverage Analysis forCapacity Planning Copyright © Subex 2021
  • 15.
    Subex Network Intelligence Network Investment Planning Business •Revenue per cell/site • ARPU • Churn • VIP Subscribers • Competition Network • Capacity KPIs trend analysis • Service-driven KPIs/KQIs modeling • QoE and QoS mapping Network Investment Planning Customer Experience • UE Throughput • Stall time/length • NPS • MOS 15
  • 16.
    16 Subex Network Intelligence Advanced Automation Domain DrivenData Science Advanced Analytics Applied to Capacity Management Smart KPI Framework Intelligent Data Profilers Hadoop Micro Services Cloud Native Open Source Curated Stack HyperlogIQ Advanced Analytics Engine CapMan4C Proprietary ML Forecasting Model Multi-Vendor, Multi-Technology High Accuracy & Efficiency Intelligent Data Management
  • 17.
    Deepal Jain |Deepal.jain@subex.com www.subex.com Thank You Copyright © Subex 2021