Net Lease Big Box Report
•
1 like•233 views

Research report detailing the single tenant net lease big box sector

Recommended
Recommended
More Related Content
What's hot
What's hot (11)
Similar to Net Lease Big Box Report
Similar to Net Lease Big Box Report (20)
More from The Boulder Group
More from The Boulder Group (20)
Recently uploaded
Recently uploaded (20)
Net Lease Big Box Report
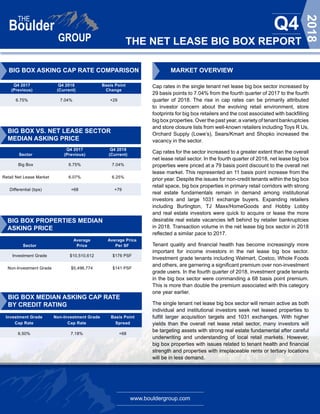
- 1. www.bouldergroup.com THE NET LEASE BIG BOX REPORT Q4 2018 Q4 2017 Q4 2018 Basis Point (Previous) (Current) Change 6.75% 7.04% +29 Q4 2017 Q4 2018 Sector (Previous) (Current) Big Box 6.75% 7.04% Retail Net Lease Market 6.07% 6.25% Differential (bps) +68 +79 BIG BOX PROPERTIES MEDIAN ASKING PRICE Average Average Price Sector Price Per SF Investment Grade $10,510,612 $176 PSF Non-Investment Grade $5,496,774 $141 PSF BIG BOX MEDIAN ASKING CAP RATE BY CREDIT RATING MARKET OVERVIEW Cap rates in the single tenant net lease big box sector increased by 29 basis points to 7.04% from the fourth quarter of 2017 to the fourth quarter of 2018. The rise in cap rates can be primarily attributed to investor concern about the evolving retail environment, store footprints for big box retailers and the cost associated with backfilling big box properties. Over the past year, a variety of tenant bankruptcies and store closure lists from well-known retailers including Toys R Us, Orchard Supply (Lowe’s), Sears/Kmart and Shopko increased the vacancy in the sector. Cap rates for the sector increased to a greater extent than the overall net lease retail sector. In the fourth quarter of 2018, net lease big box properties were priced at a 79 basis point discount to the overall net lease market. This represented an 11 basis point increase from the prior year. Despite the issues for non-credit tenants within the big box retail space, big box properties in primary retail corridors with strong real estate fundamentals remain in demand among institutional investors and large 1031 exchange buyers. Expanding retailers including Burlington, TJ Maxx/HomeGoods and Hobby Lobby and real estate investors were quick to acquire or lease the more desirable real estate vacancies left behind by retailer bankruptcies in 2018. Transaction volume in the net lease big box sector in 2018 reflected a similar pace to 2017. Tenant quality and financial health has become increasingly more important for income investors in the net lease big box sector. Investment grade tenants including Walmart, Costco, Whole Foods and others, are garnering a significant premium over non-investment grade users. In the fourth quarter of 2018, investment grade tenants in the big box sector were commanding a 68 basis point premium. This is more than double the premium associated with this category one year earlier. The single tenant net lease big box sector will remain active as both individual and institutional investors seek net leased properties to fulfill larger acquisition targets and 1031 exchanges. With higher yields than the overall net lease retail sector, many investors will be targeting assets with strong real estate fundamental after careful underwriting and understanding of local retail markets. However, big box properties with issues related to tenant health and financial strength and properties with irreplaceable rents or tertiary locations will be in less demand. Investment Grade Non-Investment Grade Basis Point Cap Rate Cap Rate Spread 6.50% 7.18% +68 BIG BOX ASKING CAP RATE COMPARISON BIG BOX VS. NET LEASE SECTOR MEDIAN ASKING PRICE
- 2. www.bouldergroup.com THE NET LEASE BIG BOX REPORT Q4 2018 BIG BOX MEDIAN ASKING CAP RATE BY REGION MEDIAN ASKING CAP RATES BY SQUARE FOOTAGE MEDIAN ASKING CAP RATE BY LEASE TERM REMAINING Percentage Sector SF Range Cap Rate of Market Junior Big Box 20,000 - 40,000 7.02% 51% Mid Box 40,000 - 80,000 7.15% 39% Large Format Over 80,000 6.70% 10% Years Investment Non-Investment Remaining Grade Grade 16-20 Years 5.50% 6.00% 11-15 Years 6.20% 7.00% 6-10 Years 6.65% 7.23% 5 Years & Under 7.05% 7.70% WEST MOUNTAIN MIDWEST SOUTH NO RTHEAST 7.06% 6.83% 7.25% 7.40% 6.29% WEST MOUNTAIN MIDWEST SOUTH NO RTHEAST
- 3. www.bouldergroup.com THE NET LEASE BIG BOX REPORT Q4 2018 © 2019. The Boulder Group. Information herein has been obtained from databases owned and maintained by The Boulder Group as well as third party sources. We have not verified the information and we make no guarantee, warranty or representation about it. This information is provided for general illustrative purposes and not for any specific recommendation or purpose nor under any circumstances shall any of the above information be deemed legal advice or counsel. Reliance on this information is at the risk of the reader and The Boulder Group expressly disclaims any liability arising from the use of such information. This information is designed exclusively for use by The Boulder Group clients and cannot be reproduced, retransmitted or distributed without the express written consent of The Boulder Group. FOR MORE INFORMATION Sale Date Tenant City State Price Price/SF Cap Rate Lease Term Remaining Nov-18 Safeway Olney MD $25,921,000 $434 5.78% 19 Oct-18 Mariano's Crystal Lake IL $25,200,000 $337 5.88% 20 Nov-18 Stop & Shop Mount Vernon NY $22,250,000 $276 6.98% 5 Jul-18 Art Van Furniture Downers Grove IL $20,232,000 $165 7.25% 19 Aug-18 Kohl's Centerville UT $17,700,000 $197 7.37% 11 Nov-18 Jewel Osco Oak Lawn IL $16,000,000 $338 5.80% 19 Oct-18 Target Skokie IL $13,850,000 $419 5.29% 14 Oct-18 Lowe's (GL) Clovis CA $12,409,500 $76 5.56% 10 Aug-18 Best Buy Woodland Park NJ $12,000,000 $267 8.69% 4 Oct-18 Floor & Décor Oklahoma City OK $11,000,000 $146 7.37% 15 Nov-18 Albertsons Alrington TX $10,358,110 $166 6.40% 12 Oct-18 24 Hour Fitness Austin TX $9,857,142 $329 7.00% 9 Nov-18 Ashley Furniture Green Bay WI $9,250,000 $184 6.88% 10 Nov-18 Academy Sports & Outdoors Liberty MO $5,700,000 $91 8.55% 15 Oct-18 24 Hour Fitness Taylorsville UT $5,300,000 $151 7.25% 16 SELECTED SINGLE TENANT BIG BOX CLOSED TRANSACTIONS Total Number Credit Tenant of Stores Rating 24 Hour Fitness 400+ B Academy Sports + Outdoors 290 Not Rated Albertsons 2,328 B+ Bed Bath & Beyond 1,550 BB+ Best Buy 1,250+ BBB BJ's Wholesale 216 B Dick's Sporting Goods 850 Not Rated Hobby Lobby 822 Not Rated Kohl's 1,158 BBB- Kroger 3,028 BBB LA Fitness 690+ B+ Lowe's Home Improvement 2,394 BBB+ Petco 1,500 CCC+ PetSmart 1,500 CCC Ross Dress for Less 1,412 A- Staples 1,131 B+ TJMaxx 1,000+ A+ The Home Depot 2,000 A Walmart Stores 6,363 AA Whole Foods Market 479 A+ COMPANY COMPARISON John Feeney Senior Vice President john@bouldergroup.com Scott Harris | Senior Analyst scott@bouldergroup.com Jeff Weil | Analyst jeff@bouldergroup.com CONTRIBUTORS Randy Blankstein | President randy@bouldergroup.com Jimmy Goodman | Partner jimmy@bouldergroup.com AUTHOR