Single tenant net lease cap rates
•
1 like•112 views

Single tenant net lease cap rates report by The Boulder Group

Recommended
Recommended
More Related Content
What's hot
What's hot (20)
Similar to Single tenant net lease cap rates
Similar to Single tenant net lease cap rates (20)
More from The Boulder Group
More from The Boulder Group (20)
Recently uploaded
Recently uploaded (20)
Single tenant net lease cap rates
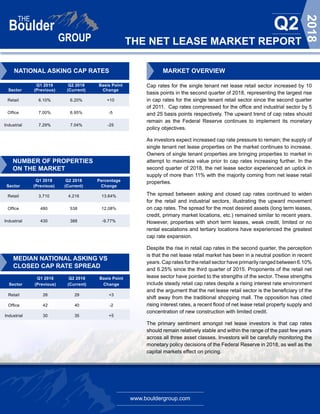
- 1. www.bouldergroup.com THE NET LEASE MARKET REPORT Q2 2018 Q1 2018 Q2 2018 Basis Point Sector (Previous) (Current) Change Retail 6.10% 6.20% +10 Office 7.00% 6.95% -5 Industrial 7.29% 7.04% -25 NUMBER OF PROPERTIES ON THE MARKET Q1 2018 Q2 2018 Percentage Sector (Previous) (Current) Change Retail 3,710 4,216 13.64% Office 480 538 12.08% Industrial 430 388 -9.77% MEDIAN NATIONAL ASKING VS CLOSED CAP RATE SPREAD MARKET OVERVIEW Cap rates for the single tenant net lease retail sector increased by 10 basis points in the second quarter of 2018, representing the largest rise in cap rates for the single tenant retail sector since the second quarter of 2011. Cap rates compressed for the office and industrial sector by 5 and 25 basis points respectively. The upward trend of cap rates should remain as the Federal Reserve continues to implement its monetary policy objectives. As investors expect increased cap rate pressure to remain; the supply of single tenant net lease properties on the market continues to increase. Owners of single tenant properties are bringing properties to market in attempt to maximize value prior to cap rates increasing further. In the second quarter of 2018, the net lease sector experienced an uptick in supply of more than 11% with the majority coming from net lease retail properties. The spread between asking and closed cap rates continued to widen for the retail and industrial sectors, illustrating the upward movement on cap rates. The spread for the most desired assets (long term leases, credit, primary market locations, etc.) remained similar to recent years. However, properties with short term leases, weak credit, limited or no rental escalations and tertiary locations have experienced the greatest cap rate expansion. Despite the rise in retail cap rates in the second quarter, the perception is that the net lease retail market has been in a neutral position in recent years. Cap rates for the retail sector have primarily ranged between 6.10% and 6.25% since the third quarter of 2015. Proponents of the retail net lease sector have pointed to the strengths of the sector. These strengths include steady retail cap rates despite a rising interest rate environment and the argument that the net lease retail sector is the beneficiary of the shift away from the traditional shopping mall. The opposition has cited rising interest rates, a recent flood of net lease retail property supply and concentration of new construction with limited credit. The primary sentiment amongst net lease investors is that cap rates should remain relatively stable and within the range of the past few years across all three asset classes. Investors will be carefully monitoring the monetary policy decisions of the Federal Reserve in 2018, as well as the capital markets effect on pricing. Q1 2018 Q2 2018 Basis Point Sector (Previous) (Current) Change Retail 26 29 +3 Office 42 40 -2 Industrial 30 35 +5 NATIONAL ASKING CAP RATES
- 2. www.bouldergroup.com THE NET LEASE MARKET REPORT Q2 2018 SELECTED SINGLE TENANT SALES COMPARABLES Sale Date Sector Tenant City State Price Price Per SF Cap Rate Lease Term Remaining May-18 Industrial Shaw Industries Savannah GA $56,500,000 $56 5.90% 15 Apr-18 Industrial B. Braun Medical, Inc. Daytona Beach FL $30,750,540 $77 6.37% 10 Apr-18 Office Accenture San Antonio TX $21,000,000 $234 7.85% 4 Apr-18 Retail Lowe's Mount Bernon WA $16,991,453 $124 5.85% 10 Apr-18 Office AT&T Chicago IL $13,500,000 $145 9.26% 4 Apr-18 Retail Walmart Neighborhood Market Clemson SC $13,080,000 $318 5.55% 18 May-18 Retail Walgreens Spring Valley NY $13,000,000 $877 5.30% 19 Apr-18 Retail Jewel-Osco Orland Park IL $12,680,000 $201 5.50% 20 Jun-18 Retail Shopko Sioux Falls SD $11,701,199 $129 8.00% 17 Apr-18 Retail Safeway Silver Spring MD $10,425,000 $234 5.45% 20 May-18 Retail Hobby Lobby Palmdale CA $10,150,000 $185 6.22% 15 Apr-18 Retail Home Depot Farmington NM $9,100,000 $70 6.27% 8 Apr-18 Industrial FedEx Ground Emporia VA $8,413,776 $166 7.60% 8 Apr-18 Retail Kohl's Cedar Rapids IA $8,100,000 $101 7.29% 10 Apr-18 Retail Wawa (GL) Towson MD $7,480,000 -- 4.35% 20 May-18 Industrial FedEx Ground Escanaba MI $5,397,200 $123 6.75% 9 Apr-18 Retail CVS Richmond VA $4,307,000 $399 5.25% 20 NET LEASE CAP RATE TRENDS Retail Office Industrial 5,75% 6.25% 6.75% 7.25% 7.75% 8.25% 8.75% Q1 2004 Q3 2004 Q1 2005 Q3 2005 Q1 2006 Q3 2006 Q1 2007 Q3 2007 Q1 2008 Q3 2008 Q1 2009 Q3 2009 Q1 2010 Q3 2010 Q1 2011 Q3 2011 Q1 2012 Q3 2012 Q1 2013 Q3 2013 Q1 2014 Q3 2014 Q1 2015 Q3 2015 Q1 2016 Q3 2016 Q1 2017 Q3 2017 Q1 2018
- 3. www.bouldergroup.com THE NET LEASE MARKET REPORT Q2 2018 © 2018. The Boulder Group. Information herein has been obtained from databases owned and maintained by The Boulder Group as well as third party sources. We have not verified the information and we make no guarantee, warranty or representation about it. This information is provided for general illustrative purposes and not for any specific recommendation or purpose nor under any circumstances shall any of the above information be deemed legal advice or counsel. Reliance on this information is at the risk of the reader and The Boulder Group expressly disclaims any liability arising from the use of such information. This information is designed exclusively for use by The Boulder Group clients and cannot be reproduced, retransmitted or distributed without the express written consent of The Boulder Group. FOR MORE INFORMATION John Feeney Senior Vice President john@bouldergroup.com Scott Harris | Senior Analyst scott@bouldergroup.com Jeff Weil | Analyst jeff@bouldergroup.com Tenant 2012-2018 2005-2011 2000-2005 Pre 2000 7-Eleven 4.85% 5.25% 5.90% 6.35% Advance Auto Parts 6.00% 6.75% 7.50% 8.00% AutoZone 5.15% 5.65% 6.25% 7.00% Bank of America N/A 5.05% 6.00% 6.40% Chase Bank 4.50% 4.75% 5.00% 5.65% CVS Pharmacy 5.35% 5.72% 5.95% 6.90% DaVita Dialysis Center 5.82% 6.00% N/A 6.95% Dollar General 7.00% 7.70% 8.15% 8.50% Family Dollar 7.25% 7.65% 8.10% 8.65% FedEx 6.00% 6.65% 7.00% 7.55% Fresenius 5.90% 6.65% 6.85% 7.40% McDonald's (GL) 4.13% 4.25% 4.75% 4.95% O'Reilly Auto Parts 5.55% 6.05% 6.25% 7.00% Rite Aid 6.25% 7.00% 7.75% 8.40% Starbucks 5.00% 5.40% 6.00% 6.50% Walgreens 5.50% 5.80% 6.65% 7.15% MEDIAN ASKING CAP RATES BY YEAR BUILT CONTRIBUTORS Randy Blankstein | President randy@bouldergroup.com Jimmy Goodman | Partner jimmy@bouldergroup.com AUTHOR