- Housing market activity decreased in January 2014 compared to January 2013, with new listings down 5.7%, pending sales up 13.2%, and closed sales down 7.1%.
- Median home prices continued to rise, increasing 25.4% to $141,100. Inventory levels fell 3.8% while days on market were down 8.9% to 82 days.
- The document analyzes housing market metrics and notes that factors driving the recovery in recent years will likely continue in 2014, though perhaps at a more moderate pace, and inventory levels will be an important metric to watch.
Georgia Association of Realtors Stats for December 2013Sandra Watkins
- Housing activity in December 2013 saw increases in new listings (up 8.3%), pending sales (up 16.9%), and closed sales (up 3.7%) compared to December 2012.
- The median sales price rose 24.8% to $149,900. Inventory levels fell 4.2% to 37,803 units.
- Days on market decreased 14.7% to 81 days on average. The housing market saw strengthened demand and higher prices in December 2013 compared to the previous year.
The Georgia Association Of Realtors Monthly Indicators For April 2014Arthur Prescott
New residential real estate listings and pending sales in April 2014 increased by 12.5% and 21.2% respectively compared to April 2013. The median sales price rose 14.5% to $158,000, while days on market declined 8.4% to 76 days. Overall, the housing market showed signs of continued recovery in April with higher sales volumes and rising home prices.
June 2013's Monthly Indicators report - Boston Real Estate Market TrendsUnit Realty Group
What’s going on in the Boston real estate market? Concerns about interest rates rising helped push activity higher in the spring, which resulted in an increase in closed sales in June. Prices continue to move up because demand for available homes to buy is outpacing supply. Sellers are gaining confidence as new listings continue to be added to the market.
June single-family home sales – Up 1.6% over last year. June Single-family median prices were UP 6.9% to $350,000 (highest point since Aug. ‘07 $357k). Condo sales up 0.4% and median prices UP 2.9% ($320,000) (only 3rd time over $300k).
December 2014 Greater Boston Real Estate Market Trends ReportUnit Realty Group
Here’s December 2014’s Monthly Indicators report from the Greater Boston Association of Realtors®
2014 ends on a high note with single-family closed sales up in December. Strong buyer activity, lower inventory and low interest rates pushed prices up again on homes in December. While overall inventory of homes for sale is down in our area, there continue to be pockets across that are seeing increases. 2014 was a year of lower sales, lower interest rates, lower homes for sale and higher prices.
• December single-family home sales – UP 1.3% over last year
• December Single-family median prices were UP +3.8% at $519,000
• December condo sales DOWN -4.1% and median prices UP +4.7% at $440,000
• Inventory in December DOWN -12.2% to 1,700 and Condominiums Down -28.8% to 940
• SF listings added to the market in December UP +5.6% over last year. (418 from 396 in 2013)
• Condo listings added to the DOWN -1.4% over last year. (357 from 362 in 2013)
November 2014 Greater Boston Real Estate Market Trends ReportUnit Realty Group
Here’s November 2014’s Monthly Indicators report from the Greater Boston Association of Realtors®
Strong buyer activity and low interest rates have pushed prices up on the homes that did close in November. While overall inventory of homes for sale is down statewide, there continues to be pockets across the state that are seeing increases. As the holiday season got under way in November, the number of new listings added to the market went down.
• November single-family home sales – Down 6.7% over last year.
• November Single-family median prices were UP 4.4% at $330,000
• November condo sales Down 10.2% and median prices UP 1.0% ($302,000)
• Inventory in November Down 13.2% to 19,068 and Condominiums Down 23.9% to 4,588
• SF listings added to the market in October Down 9.7% over last year. (3,575 from 3,958 in 2013)
• Condo listings added to the market Down 3.3% over last year. (1,343 from 1,389 in 2013)
April 2013's Monthly Indicators report - Boston Real Estate Market TrendsUnit Realty Group
Here's April 2013's Monthly Indicators report from the Greater Boston Association of Realtors®. What's going on in the Boston real estate market?
• Shortage of homes to buy has pushed sales down in April as buyer interest remains high.
• Prices continue to move up because demand for available homes to buy is outpacing supply.
• Sellers are gaining confidence as new listings added to the market jumped in April.
July 2013's Monthly Indicators report - Boston Real Estate Market TrendsUnit Realty Group
Here's July 2013's Monthly Indicators report from the Greater Boston Association of Realtors.
What's going on in the Boston real estate market?
• July volume of closed sales (all property types) UP +17.2% over July, 2012
• July single-family market median sales price UP 4.5% over July, 2012
• July condo market median sales price UP 4% over July, 2012
The document provides a monthly inventory analysis for August 2013 from the Oklahoma Association of REALTORS. It summarizes that active inventory decreased 9.57% from the previous year to 22,141 homes, representing a 6.18 month supply. Average sale prices increased 5.32% to $170,617 while average days on market decreased 5.97% to 72.92 days. Overall, the market saw increases in closed listings, pending listings, and average prices along with decreases in inventory levels and days on market, indicating positive sales conditions in August. The document recommends working with a local REALTOR when buying or selling real estate.
October 2015 Greater Boston Real Estate Market Trends ReportUnit Realty Group
Here’s October 2015’s Monthly Indicators report from the Greater Boston Association of Realtors®
October closed home sales up on strong buyer activity over the late summer/early fall. Low supply in October and ongoing buyer demand pushed home prices higher. Seven straight months of new listings added to the market are giving buyers more options.
• September single-family home sales – UP +13.0% over last year
September Single-family median prices were UP +1.1% at $440,000
• September condo sales DOWN -7.3% and median prices were UP +15.5% at $454,950
• Inventory in September DOWN -12.1% to 3,688 and Condominiums DOWN -10.0% to 1,773
• SF listings added to the market in September UP +2.6% over last year. (1,586 from 1,546 in 2014)
• Condo listings added to the market UP +5.3% over last year. (1,137 from 1,080 in 2014)
GBAR Monthly Housing Market Data November 2016Joe Schutt
The document summarizes real estate market indicators for November 2016 in the Greater Boston area. It shows that closed home sales increased 16.8% for single-family homes and 7.2% for condominiums compared to November 2015. Inventory decreased 30.4% for single-family homes and 27.4% for condominiums over the same period. The median sales price rose 1.5% for single-family homes to $524,500 and increased 10.2% for condominiums to $496,500 in November 2016 compared to the previous year.
Greater Boston Association of Realtors Monthly Housing Data: October 2016Joe Schutt
- Closed sales decreased 15.0% for single-family homes and 1.3% for condominium homes in October 2016 compared to October 2015. Inventory decreased 26.4% for single-family homes and 21.2% for condominium homes.
- The median sales price was up 10.8% to $526,300 for single-family homes and 5.3% to $479,238 for condominium homes in October 2016 compared to the previous year.
- Low inventory continues to be a drag on the acceleration of the housing market, and there are no signs that the low inventory situation will be resolved soon.
The document provides housing market statistics for San Francisco for the month of June 2013. It notes that median sales prices increased 22.4% for single family homes and 9.5% for condos from the previous year. New listings decreased slightly while pending sales increased 16% for single family and decreased 10% for condos. The housing market remains very strong despite low inventory and interest rates rising slightly from previous lows.
September 2015 Greater Boston Real Estate Market Trends ReportUnit Realty Group
The real estate market in the Greater Boston region experienced positive trends in the third quarter of 2015. New listings increased 10.9% for single-family homes and 11.3% for condominiums. Closed sales rose 15% for single-family homes and 4.1% for condominiums. Median sales prices increased 7.5% for single-family homes to $455,000 and 3.4% for condominiums to $428,500. Months of inventory decreased significantly. Overall, the housing market remains healthy with continued job growth and low interest rates.
This monthly snapshot summarizes real estate activity in San Francisco for May 2013. Key points include:
- Median home sales prices increased 35.6% for single family homes and 18.2% for condos year-over-year.
- New listings rose 20.1% for single family but fell 5.1% for condos. Pending sales were up for both.
- Inventory levels decreased with months supply down 23.1% for single family and 36.4% for condos.
- The market remains heated with strong demand and constrained supply driving prices higher.
Greater Baton Rouge Home Sales December 2017 Update provided by GBRAR. Bill Cobb, Appraiser
- Housing market activity in Greater Baton Rouge decreased in December 2017 compared to the previous year, with new listings down 11.2%, pending sales down 11.7%, and closed sales down 16%.
- The median sales price increased 17.1% to $205,000 in December 2017 compared to the previous year.
- Inventory levels grew 9.1% in December 2017, leading to an 8.8% increase in months of inventory.
September 2016 Boston Real Estate Market TrendsJoe Schutt
- Closed home sales decreased for single-family homes but increased for condominiums in September 2016 compared to the previous year. Median home prices increased for both single-family homes and condominiums. Inventory levels decreased substantially for both housing types.
Charlotte region -monthly indicators - feb 2018Scott Browder
The Charlotte region housing market report for February 2018 showed:
- Closed sales were up 3.4% year-over-year while median sales price rose 12.9% and inventory fell 16.4%.
- Pending sales increased 8.3% and inventory dropped further to 8,035 homes.
- Months supply of homes fell 23.1% to 2.0 months indicating strong buyer demand relative to limited supply.
- Mortgage rates rose to their highest since 2014, reducing affordability, though higher prices reflect strong demand.
- Residential real estate activity in San Francisco increased in July 2013, with median home prices rising 15.2% for single family homes and 24.6% for condos over the previous year.
- Pending home sales rose 6.6% for single family and 10.1% for condos.
- The number of new listings declined for single family homes but increased for condos, while inventory levels decreased for both property types compared to a year ago.
- Housing market indicators in the Charlotte region generally improved in September 2017 compared to September 2016, with new listings, pending sales, and median sales price increasing while months supply of homes and inventory decreased.
- Key metrics such as new listings were up 3.3%, pending sales increased 16.4%, median sales price rose 9.2%, and months supply of homes fell 24.2%. Inventory dropped 17.5%.
- The document analyzed housing market data for the Charlotte region in September 2017 and year-to-date 2017, finding mostly positive trends compared to the same periods in 2016.
The document provides a monthly snapshot of real estate activity in San Francisco for June 2017. Some key points:
- Median sales prices for single-family homes increased 10.8% year-over-year while median prices for condos decreased 2.6%.
- New listings were down 18.1% for single family homes and 36% for condos compared to the previous year. Pending sales rose for both single family homes and condos.
- Inventory levels decreased significantly with months of supply dropping 30.4% for single family homes and 40% for condos.
The document is a monthly real estate snapshot for San Francisco County that provides key metrics and year-over-year comparisons. It reports that in May 2017:
- Median home prices rose 12% for single-family homes and 10.9% for condos from a year ago.
- New listings declined 7.4% for single-family homes and 18.4% for condos from a year ago.
- Inventory levels decreased with months supply of inventory falling 24% for single-family homes and 25% for condos from a year ago.
Residential real estate activity in San Francisco saw decreases in new listings and pending sales in April 2017 compared to the previous year. The median sales price for single-family homes increased slightly by 1.6% to $1,402,500, while the median price for condos decreased by 4.3% to $1,100,000. Inventory levels also dropped, with months of supply decreasing by 30.8% for single-family homes and 25.8% for condos. Overall, the real estate market remains strong with high demand, though affordability issues persist for some buyers.
The document is a monthly real estate snapshot for San Francisco County that provides key metrics and year-over-year comparisons. It summarizes that:
- Median home sale prices increased 9.9% for single family homes and 8.0% for condos year-over-year.
- New listings were down 22.2% for single family and 12.0% for condos compared to the previous year.
- Inventory levels decreased with months supply down 31.0% for single family homes and 20.0% for condos.
The document summarizes real estate statistics for the Sarasota, Florida area in May 2013. It provides data on single family homes and condominiums including the number of properties listed and sold, median sale prices, months of inventory, and other metrics. Single family homes had 737 sales in May with a median price of $220,000, while condos had 283 sales and a $194,250 median price. Both property types showed an increase in sales compared to the previous year.
The document provides statistics on real estate listings and sales in Sarasota, Florida for June 2013. Single-family home sales increased compared to last month and last year, with median sale prices of $200,000, up from $188,637 last month and $178,500 last year. Condo sales also rose compared to last month and year-ago levels, with median prices of $190,000, up from $194,250 last month and $195,000 last year. Both single-family homes and condos have fewer than 5 months of inventory on average.
The document provides statistics on real estate listings and sales in the Sarasota, Florida area for April 2013. Single-family home median sale prices were $217,015, up from $210,000 the prior month. Condo median sale prices were $185,000, up from $182,000 the prior month. Both single-family home and condo inventory levels and pending sales decreased compared to the prior month and year.
The document discusses Indonesia's political landscape, noting that voters are increasingly demographically diverse and digitally connected but weakly politically associated. Political parties share burdens and lack differentiation while suffering from public distrust. Public figures feature a lack of new faces and fresh ideas instead focusing on partial interests over ideology. Civil society sees new groupings, ethics, behaviors and communication. Overall, Indonesia faces political trends of increased public inclusiveness but stronger political oligopolies, resistance to good governance reforms, and unfinished development agendas impacting social and economic progress.
RELIGIOUS DEMOCRATS: DEMOCRATIC CULTURE AND MUSLIM POLITICAL PARTICIPATION IN...Oyon08
Most theories about the negative relationship between Islam and democracy rely
on an interpretation of the Islamic political tradition. More positive accounts are also
anchored in the same tradition, interpreted in a different way. While some scholarship
relies on more empirical observation and analysis, there is no single work which
systematically demonstrates the relationship between Islam and democracy.
This study is an attempt to fill this gap by defining Islam empirically in terms of
several components and democracy in terms of the components of democratic culture—
social capital, political tolerance, political engagement, political trust, and support for the
democratic system—and political participation. The theories which assert that Islam is
inimical to democracy are tested by examining the extent to which the Islamic and
democratic components are negatively associated.
Indonesia was selected for this research as it is the most populous Muslim country
in the world, with considerable variation among Muslims in belief and practice. Two
national mass surveys were conducted in 2001 and 2002.
This study found that Islam defined by two sets of rituals, the networks of Islamic
civic engagement, Islamic social identity, and Islamist political orientations (Islamism)
does not have a negative association with the components of democracy. The only
negative relationship is found between Islamism and tolerance toward Christians.
iii
However, intolerant Islamism is not a real threat to democratic stability because
intolerant Islamists tends to be passive, not active, political participants. There is no
association between intolerant Islamism and protest activity that might have the potential
to destabilize the democratic system.
On the contrary, almost all components of Islam have a positive and significant
relationship with secular civic engagement, with political engagement, and with political
participation. These three components of democracy reinforce support for the democratic
system as whole. Therefore, Islam helps Muslim citizens to be active in politics and this
activity is congruent with the democratic system as a whole. What emerges is not
religious Muslims who are against democracy, nor non-religious democrats, but rather
religious Muslims who contribute to strengthening democracy. They are religious
democrats.
This document is a special report from the Indonesian news weekly Tempo about the 1965 massacre of Indonesian Communist Party (PKI) members. It provides historical context for the killings, noting that estimates of the death toll range from 78,000 to 3 million. It profiles Anwar Congo, a ticket scalper who openly admitted to killing hundreds of PKI members in Medan, describing his killing methods. The report aims to understand the perspective of the killers at that time, when anti-communist sentiment was widespread amid political conflict and the media was controlled by the military. It acknowledges this was a serious case of human rights violations and that reconciliation efforts are still ongoing decades later.
The Hajj and Politics in Contemporary Turkey and IndonesiaRobert R. Bianchi
This document discusses how politics influences the Hajj pilgrimage in Turkey and Indonesia. It notes that both countries have large Muslim populations and have helped expand the modern Hajj. However, their political systems differ - Turkey has a dominant Islamic party while Indonesia has weak parties with ambiguous religious positions. This affects how Hajj quotas are distributed. In Turkey, participation rates have remained stable by region and correlate with support for Islamic parties. In Indonesia, rates have shifted dramatically between regions as democratic reforms took hold after Suharto. Political factors thus strongly shape each country's Hajj patterns.
Politics and Government of Indonesia (Politik dan Pemerintahan Indonesia)Devindra Oktaviano
This document provides an overview of Indonesia, including its capital, population, GDP, and official symbols. It discusses Indonesia's history from early Hindu-Buddhist and Islamic kingdoms through colonization by Portugal, Britain, and the Netherlands. The key principles of Indonesia's ideology and constitution are outlined. Details are given on Indonesia's provinces, decentralized system of government, executive branch led by the president, and bicameral legislative branch. The roles of the judicial system and key political parties are summarized. Brief descriptions of domestic issues like corruption and communal conflicts are also included.
This document provides an overview of Islam and its presence in Indonesia. It states that Indonesia has the largest Muslim population in the world, with Islam being the dominant religion practiced by 86.1% of Indonesians. It then covers key topics in Islam such as the five pillars, six articles of faith, common practices and beliefs, important figures and texts, and the role of women. It aims to educate about Islamic concepts in a brief and straightforward manner.
The document summarizes key aspects of religion and politics in Indonesia. It notes that Indonesia recognizes six official religions - Islam, Protestantism, Catholicism, Hinduism, Buddhism, and Confucianism. Islam is the most widely practiced religion in Indonesia, with 87% of citizens identifying as Muslim. The government system is a presidential representative democratic republic, with an elected president who appoints a cabinet. Key reforms were implemented following the 1998 riots, decentralizing some powers.
- Housing prices in San Francisco increased substantially in 2014, with median sales prices rising 14% for single family homes and 25% for condos.
- While the market saw rising prices and stable inventory in 2014, price gains were less robust than in 2013 as the market shifted from being undersupplied to approaching equilibrium.
- Key metrics to watch in 2015 like days on market, percent of list price received, and absorption rates can provide insights into the future direction of the housing market.
The document provides housing market statistics for San Francisco County for June 2014. Median home sale prices increased 27.8% for single family homes and 25% for condos over the previous year. New property listings declined 17.1% for single family homes and 18.7% for condos compared to June 2013. Pending home sales decreased 29.1% for single family properties but rose 4.1% for condos. Interest rates were generally lower than a year prior and housing demand was picking up in higher price tiers while inventory levels rose slowly in some areas.
The real estate market in Oklahoma saw improvements in May 2013 compared to May 2012. Closed home sales increased 1.9% while average home prices rose 5.9% and average days on market decreased by over 10%. Total housing inventory declined 14.9% from the previous May. These positive trends indicate a strengthening market with increasing home values and a decreasing housing surplus. The report recommends contacting a local REALTOR for help navigating the real estate market.
January 2014 Greater Boston Real Estate Market Trends ReportUnit Realty Group
The document provides an overview of the Greater Boston housing market in January 2014. It finds that closed sales of single-family homes decreased 6.0% year-over-year while condo sales increased 0.8%. The median sales price rose 12.8% for single-family homes and 13.9% for condos. Inventory levels fell substantially, with months supply of inventory decreasing 24.9% for single-family homes and 30.9% for condos. The housing market is continuing its recovery, though growth may moderate in 2014 with increases in seller activity, new construction, and fewer foreclosures expected.
The document provides a monthly snapshot of real estate activity in San Francisco for July 2014. Key metrics show that median home prices rose substantially over the past year, with the median single-family home price increasing 23.5% and the median condo price rising 11.1%. Inventory levels declined for both single-family and condo properties. While low supply and high prices continue, job and wage growth have not kept pace with price increases, lowering housing affordability.
The document provides an overview of the San Francisco residential real estate market in February 2014. Key metrics showed that new listings were down 17.1% for single family homes and 18.4% for condos from the previous year. Pending sales increased 13.4% for single family homes and 11.5% for condos. Median sales prices rose sharply, increasing 35.7% for single family homes to $1,086,500 and 24.9% for condos to $937,000. Months of inventory decreased significantly. The report concludes that while some volatility is expected, the spring market is anticipated to be strong.
The monthly snapshot report summarizes real estate activity in San Francisco for January 2014. Key points include:
- Median home sale prices increased 24.6% for both single family and condo/co-op properties compared to January 2013.
- New property listings decreased 11.3% for single family homes and 7.8% for condos/co-ops from the previous year.
- Inventory levels dropped with months supply of housing falling 20% for single family and 31.6% for condos/co-ops.
Residential real estate activity in San Francisco County saw increases in 2013 according to monthly indicators. Key metrics for single family homes and condos/co-ops in December 2013 show:
- New listings were down 7.8% for single family homes and 22.8% for condos/co-ops.
- Pending sales remained flat for single family homes but decreased 4.9% for condos/co-ops.
- The median sales price increased 15.3% to $962,500 for single family homes and 10.2% to $770,000 for condos/co-ops.
- Months supply of inventory decreased 28.6% for single family units and 43.8
The document provides monthly real estate market statistics for Walton County for January 2014. Some key figures include:
- Closed sales increased 35.8% year-over-year to 110 homes in January 2014.
- Cash sales increased 16.1% year-over-year to 36 homes.
- New pending sales were unchanged at 162 homes compared to January 2013.
- New listings increased 18.3% year-over-year to 252 homes.
- The median sale price rose 1.7% to $385,000 while the average sale price increased 22.4% to $556,049.
The document provides a monthly real estate market analysis for Oklahoma from April 2013. It summarizes key metrics such as closed and pending home sales, new listings, inventory levels and average sale prices. The following trends are highlighted:
- Closed home sales in April 2013 increased 12.12% from the previous year while average sale prices rose 5.42%. Inventory levels and months of supply decreased compared to April 2012.
- Pending home sales and new listings also increased year-over-year in April. Average days on market for homes to sell shortened slightly.
- Overall, the real estate market showed positive signs in April 2013 with higher sales, rising prices and falling inventory despite a small rise in average days on
Residential real estate activity in San Francisco County saw encouraging signs in November 2013, though some metrics moderated from multiyear highs. New listings and pending sales decreased month-over-month for both single family homes and condos/co-ops. However, median sales prices continued rising sharply with a 20.4% increase for single family homes and 6.5% for condos/co-ops compared to November 2012. Strong economic data and job growth are supporting the housing recovery. Watch for further tapering of the Federal Reserve's stimulus program in March 2014.
This document provides a monthly snapshot of residential real estate activity in San Francisco County for September 2014. It finds that the median sales price for single family homes increased 11.7% compared to the previous year, while the median sales price for condos increased 11.4%. Overall real estate markets appear to be continuing their recovery, with new construction reaching six-year highs and rising inventory providing more options for buyers. However, factors like student debt and wage growth are slowing the transition to homeownership for some.
San Francisco Real Estate Market Report August 2014Ronny Budiutama
- Residential real estate activity in San Francisco saw a 4.4% increase in the median sales price for single family homes and a 14.8% increase for condos from the previous year in August 2014.
- New listings were down 28.3% for single family homes and 36.7% for condos compared to August 2013, while pending sales decreased 14.4% and 14.2% respectively.
- Sustained job growth, lower mortgage rates, and a slow rise in home inventory have helped drive increased housing demand despite some monthly fluctuations in the market.
The document summarizes housing market data from the Austin Board of Realtors for April 2013. Key points include:
- New listings increased 9.4% year-over-year while pending sales were up 30.4% and inventory levels fell 30.1%.
- Median and average sales prices both rose around 10% from the previous year. Days on market decreased nearly 30%.
- Inventory and listing activity remain low compared to previous years, causing bidding wars in some neighborhoods. However, housing is one of the strongest parts of the local economy.
In September 2013:
- San Francisco's housing market remained very strong with high demand from buyers and low inventory.
- The median sales price for single family homes increased 29.0% year-over-year to $935,000, while the median price for condos rose 6.8% to $829,044.
- Pending sales were up 14.1% for single family homes and 11.9% for condos, reflecting continued high buyer demand, while new listings declined slightly, exacerbating the low inventory.
October 2014 Greater Boston Real Estate Market Trends ReportUnit Realty Group
The document provides an overview of housing market indicators for the Greater Boston region in October 2014. It summarizes that new single-family home listings were up 4.0% year-over-year while condo listings were down 0.2%. Closed sales decreased 3.6% for single-family homes but increased 4.6% for condos. The median sales price was up 5.8% for single-family homes but down 0.7% for condos, while months of inventory increased for single-family homes but decreased for condos.
The document provides an analysis of the real estate market in Oklahoma for January 2014. It shows that total housing inventory decreased 6.61% compared to the previous year. The months supply of inventory also decreased from 5.99 to 5.27. Average home sale prices rose 2.04% while average days on market increased slightly. Overall sales success was positive with prices up and more homes pending sale, though new listings declined slightly year-over-year.
For the week ending April 19th:
- New listings decreased 2.8% to 1,571.
- Pending sales decreased 5.3% to 1,227.
- Inventory decreased 0.5% to 14,148.
For the month of March:
- Median sales price increased 7.6% to $189,950.
- Days on market decreased 12% to 95.
- Months supply of inventory decreased 6.1% to 3.1.
Similar to Georgia Home prices up 25.4% since last January! (20)
Living in an UBER World - June '24 Sales MeetingTom Blefko
June 2024 Lancaster County Sales Meeting for Berkshire Hathaway HomeServices Homesale Realty covering the following topics: 1. VA Suspends Buyer Agent Payment Plan (article), 2. Frequently Used Terms in title, 3. Zillow Showcase Overview, 4. QuickBuy commission promotion, 5. Documenting Cooperative Compensation, 6. NAR's Code of Ethics - Mass Media Solicitations, 7. Is it really cheaper to rent? 8. Do's and Don't's when Terminating the Agreement of Sale, 9. Living in an UBER World
The SVN® organization shares a portion of their new weekly listings via their SVN Live® Weekly Property Broadcast. Visit https://svn.com/svn-live/ if you would like to attend our weekly call, which we open up to the brokerage community.
Stark Builders: Where Quality Meets Craftsmanship!shuilykhatunnil
At Stark Builders our vision is to redefine the renovation experience by combining both stunning design and high quality construction skills. We believe that by delivering both these key aspects together we are able to achieve incredible results for our clients and ensure every project reflects their vision and enhances their lifestyle.
Although we are not all related by blood we have created a team of highly professional and hardworking individuals who share the common goal of delivering beautiful and functional renovated spaces. Our tight nit team are able to work together in a way where we pour our passion into each and every project as we have a love for what we do. Building is our life.
36,778 sq. ft. building; Zoning: SE (Suburban Employment): The (SE) District allows numerous commercial site uses; Passenger elevator; Private and common restrooms; Fully sprinkled; Data center with a grounded floor and a specialized HVAC system; 60 KVA back-up generator; Building/pylon signage; Potential to purchase adjacent parcels; Sale Price: $4,413,360
Anilesh Ahuja Pioneering a Paradigm Shift in Real Estate Success.pptxneilahuja668
Anilesh Ahuja journey is a testament to the power of vision, resilience, and unwavering determination. As a visionary leader, he continues to inspire and empower others to dream big and challenge the status quo. His legacy extends far beyond the realm of real estate, leaving an indelible mark on the industry and the world at large.
Listing Turkey - Piyalepasa Istanbul CatalogListing Turkey
We are working around the clock to transform a long-time dream into reality. As a result, Piyalepasa Istanbul will be the largest privately developed urban regeneration project in Turkey.
THE NEIGHBORHOOD WE HAVE BEEN LONGING FOR IS COMING TO LIFE
The good old days of the Piyalepasa neighborhood are being brought back to life with Piyalepasa Istanbul houses, residences, offices, hotels and a pedestrianized shopping avenue.
The wide streets of this 82.000 square meter development conveniently face the main boulevard in a prime Beyoglu location. “Piyalepaşa İstanbul” stands out as the only project designed to offer a neighborhood lifestyle, complete with its grocers, bagel sellers and greengrocer. Piyalepasa Istanbul has all the values to make it an authentic neighborhood, our very own community.
A NEIGHBORHOOD FULL OF LIFE, IN THE HEART OF THE CITY!
“Piyalepaşa İstanbul” is a “mixed-use” concept containing all the elements for a vibrant social life with houses, residences, offices, hotels and high street shopping.
“Piyalepaşa İstanbul” will take the liveliness of Istanbul into its heart. The elegant sparkle of Nisantasi, the young and colorful Besiktas, the variety and multicultural heritage of Istiklal Street will all be contained within the streets of this neighborhood.
“Piyalepaşa İstanbul” bears traces of the most beautiful examples of Turkish architecture from the Seljuks to the Ottomans and from Anatolia to Rumelia. With its graded facades, wide eaves, bay windows, pools, and interior courtyard systems, it offers a new living space without disrupting the city’s silhouette and neighborhood.
“Piyalepaşa İstanbul” is the new attraction of this splendid city.
TO BE AT THE CENTER OF ISTANBUL… THIS IS REAL LUXURY!
With its proximity to D-100 highway, connecting roads and tunnels, “Piyalepaşa İstanbul” is only minutes away from Kabatas, Besiktas, the Golden Horn and Karakoy.
“Piyalepaşa İstanbul” is close to the prestigious new Istanbul Court House, a major hospital, the Perpa trade center and the city’s most lively neighborhoods. With its shuttle service to Okmeydani Metrobus station, Sishane and the Court House subway stations, “Piyalepaşa İstanbul” will provide you with the most convenient transport connections.
https://listingturkey.com/property/piyalepasa-istanbul/
Kumar Codename Fireworks at Hadapsar Link Road, Pune - PDF.pdfmonikasharma630
Codename Fireworks developed by Kumar Properties is a new residential development that offers 2/3 BHK premium residences with easy access to proposed ring road, airport, metro station.
For More Details:
Visit Here: kumar.developerprojects.com
Introduction to Dubai Real Estate | HJ Real Estatesalisholve901
Dubai, a global hub of innovation and luxury, is renowned for its dynamic real estate market, offering a blend of iconic skyscrapers, lavish residential communities, and state-of-the-art commercial spaces. HJ Real Estates is your gateway to navigating this vibrant landscape, providing expert guidance and comprehensive services to help you find the perfect property. Whether you are seeking a high-end apartment in the heart of the city, a serene villa in a tranquil neighborhood, or a prime location for your business, HJ Real Estates ensures a seamless experience tailored to your unique needs. Discover the unparalleled opportunities in Dubai real estate with us.
Andhra Pradesh, known for its strategic location on the southeastern coast of India, has emerged as a key player in India’s industrial landscape. Over the decades, the state has witnessed significant growth across various sectors,
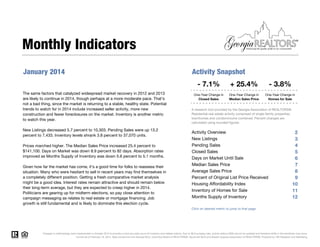
1. Monthly Indicators
January 2014
Activity Snapshot
- 7.1%
The same factors that catalyzed widespread market recovery in 2012 and 2013
are likely to continue in 2014, though perhaps at a more moderate pace. That's
not a bad thing, since the market is returning to a stable, healthy state. Potential
trends to watch for in 2014 include increased seller activity, more new
construction and fewer foreclosures on the market. Inventory is another metric
to watch this year.
New Listings decreased 5.7 percent to 10,303. Pending Sales were up 13.2
percent to 7,433. Inventory levels shrank 3.8 percent to 37,070 units.
Prices marched higher. The Median Sales Price increased 25.4 percent to
$141,100. Days on Market was down 8.9 percent to 82 days. Absorption rates
improved as Months Supply of Inventory was down 5.6 percent to 5.1 months.
Given how far the market has come, it's a good time for folks to reassess their
situation. Many who were hesitant to sell in recent years may find themselves in
a completely different position. Getting a fresh comparative market analysis
might be a good idea. Interest rates remain attractive and should remain below
their long-term average, but they are expected to creep higher in 2014.
Politicians are gearing up for midterm elections, so pay close attention to
campaign messaging as relates to real estate or mortgage financing. Job
growth is still fundamental and is likely to dominate this election cycle.
+ 25.4%
- 3.8%
One-Year Change in
Closed Sales
One-Year Change in
Median Sales Price
One-Year Change in
Homes for Sale
A research tool provided by the Georgia Association of REALTORS®.
Residential real estate activity comprised of single-family properties,
townhomes and condominiums combined. Percent changes are
calculated using rounded figures.
Activity Overview
New Listings
Pending Sales
Closed Sales
Days on Market Until Sale
Median Sales Price
Average Sales Price
Percent of Original List Price Received
Housing Affordability Index
Inventory of Homes for Sale
Months Supply of Inventory
2
3
4
5
6
7
8
9
10
11
12
Click on desired metric to jump to that page.
Changes in methodology were implemented in October 2012 to provide a more accurate count of inventory and related metrics. Due to MLS purging rules, activity before 2008 cannot be updated and therefore shifts in the trendlines may occur.
Current as of February 16, 2014. Data comes from the Georgia MLS, Columbus Board of REALTORS®, Savannah MLS and Greater Augusta Association of REALTORS®. Powered by 10K Research and Marketing.
2. Activity Overview
Key metrics by report month and for year-to-date (YTD) starting from the first of the year.
Key Metrics
Historical Sparkbars
1-2013
1-2012
1-2013
1-2012
1-2013
1-2012
1-2013
1-2012
1-2013
1-2012
1-2013
1-2012
1-2013
- 8.9%
90
82
- 8.9%
$141,100
+ 25.4%
$112,500
$141,100
+ 25.4%
$183,834
+ 22.6%
$150,007
$183,834
+ 22.6%
93.6%
+ 0.3%
93.3%
93.6%
+ 0.3%
236
- 24.8%
314
236
- 24.8%
37,070
- 3.8%
--
--
--
5.1
- 5.6%
--
--
--
1-2014
Months Supply of Inventory
1-2011
82
1-2014
Inventory of Homes for Sale
1-2011
- 7.1%
1-2014
Affordability Index
1-2011
4,976
1-2014
Pct. of Orig. Price Received
1-2011
5,356
1-2014
Average Sales Price
1-2011
- 7.1%
1-2014
Median Sales Price
1-2011
4,976
5.4
1-2013
+ 13.2%
38,545
1-2012
7,433
1-2014
Days on Market Until Sale
1-2011
6,564
314
1-2013
+ 13.2%
93.3%
1-2012
7,433
Percent Change
1-2014
Closed Sales
1-2011
- 5.7%
$150,007
1-2013
10,303
$112,500
1-2012
YTD 2013 YTD 2014
1-2014
Pending Sales
1-2011
10,922
90
1-2013
- 5.7%
5,356
1-2012
10,303
6,564
1-2011
Percent Change
10,922
New Listings
1-2014
1-2014
Current as of February 16, 2014. Data comes from the Georgia MLS, Columbus Board of REALTORS®, Savannah MLS and Greater Augusta Association of REALTORS®. Powered by 10K Research and Marketing. | Click for Cover Page | 2
3. New Listings
A count of the properties that have been newly listed on the market in a given month.
January
New Listings
Year to Date
Prior Year
Percent Change
February 2013
-4.3%
12,530
11,931
+5.0%
11,843
11,564
+2.4%
11,958
10,853
+10.2%
11,336
10,936
+3.7%
10,551
9,318
+13.2%
October 2013
10,303
12,881
September 2013
10,303
12,332
May 2013
August 2013
10,922
-6.3%
April 2013
11,801
-10.7%
13,239
July 2013
10,922
11,566
12,399
June 2013
11,801
10,329
March 2013
11,215
10,186
+10.1%
November 2013
9,113
7,947
+14.7%
December 2013
2012
- 7.4%
2013
- 5.7%
- 12.7%
2014
2012
- 7.4%
2013
- 5.7%
+9.6%
2014
7,228
6,596
January 2014
- 12.7%
10,303
10,922
-5.7%
12-Month Avg
10,928
10,662
+2.5%
Historical New Listings by Month
25,000
20,000
15,000
10,000
5,000
1-2004
1-2005
1-2006
1-2007
1-2008
1-2009
1-2010
1-2011
1-2012
1-2013
1-2014
Current as of February 16, 2014. Data comes from the Georgia MLS, Columbus Board of REALTORS®, Savannah MLS and Greater Augusta Association of REALTORS®. Powered by 10K Research and Marketing. | Click for Cover Page | 3
4. Pending Sales
A count of the properties on which offers have been accepted in a given month.
January
Pending Sales
Year to Date
Prior Year
Percent Change
February 2013
2012
2013
2014
2012
2013
+ 13.2%
2014
8,258
8,237
+0.3%
7,877
7,971
-1.2%
7,675
7,499
+2.3%
7,543
7,483
+0.8%
6,548
5,861
+11.7%
7,136
7,028
+1.5%
6,107
6,137
-0.5%
December 2013
5,776
5,384
+7.3%
January 2014
- 1.6%
+6.1%
November 2013
+ 25.6%
7,944
October 2013
+ 13.2%
8,428
September 2013
- 1.6%
-5.9%
August 2013
+ 25.6%
-10.0%
8,130
April 2013
6,564
7,357
7,648
July 2013
6,668
6,564
6,623
June 2013
6,668
7,433
March 2013
May 2013
7,433
7,433
6,564
+13.2%
12-Month Avg
7,254
7,133
+1.7%
Historical Pending Sales by Month
11,000
10,000
9,000
8,000
7,000
6,000
5,000
4,000
1-2004
1-2005
1-2006
1-2007
1-2008
1-2009
1-2010
1-2011
1-2012
1-2013
1-2014
Current as of February 16, 2014. Data comes from the Georgia MLS, Columbus Board of REALTORS®, Savannah MLS and Greater Augusta Association of REALTORS®. Powered by 10K Research and Marketing. | Click for Cover Page | 4
5. Closed Sales
A count of the actual sales that closed in a given month.
January
Closed Sales
Year to Date
Prior Year
Percent Change
February 2013
2012
2013
+ 35.7%
2014
2012
- 1.6%
2013
- 7.1%
2014
8,555
7,982
+7.2%
8,105
8,457
-4.2%
8,369
8,081
+3.6%
8,065
8,412
-4.1%
6,731
6,701
+0.4%
6,960
7,287
-4.5%
6,158
6,555
-6.1%
December 2013
6,683
6,266
+6.7%
January 2014
- 7.1%
+0.7%
November 2013
- 1.6%
7,183
October 2013
+ 35.7%
7,231
September 2013
4,976
April 2013
August 2013
4,976
5,356
-7.3%
July 2013
5,445
-6.5%
7,596
June 2013
5,356
6,130
7,045
May 2013
5,445
5,730
March 2013
4,976
5,356
-7.1%
12-Month Avg
7,051
7,167
-1.6%
Historical Closed Sales by Month
12,000
10,000
8,000
6,000
4,000
1-2004
1-2005
1-2006
1-2007
1-2008
1-2009
1-2010
1-2011
1-2012
1-2013
1-2014
Current as of February 16, 2014. Data comes from the Georgia MLS, Columbus Board of REALTORS®, Savannah MLS and Greater Augusta Association of REALTORS®. Powered by 10K Research and Marketing. | Click for Cover Page | 5
6. Days on Market Until Sale
Average number of days between when a property is listed and when an offer is accepted in a given month.
January
Days on Market
Year to Date
Prior Year
Percent Change
February 2013
2012
- 8.9%
2013
- 4.7%
2014
2012
- 10.9%
2013
- 8.9%
2014
77
91
-15.4%
June 2013
76
89
-14.6%
72
90
-20.0%
74
92
-19.6%
71
90
-21.1%
76
96
-20.8%
76
93
-18.3%
December 2013
82
95
-13.7%
January 2014
- 10.9%
-14.6%
November 2013
- 4.7%
96
October 2013
82
82
May 2013
September 2013
82
-13.0%
August 2013
90
-13.7%
100
April 2013
101
90
102
87
July 2013
101
88
March 2013
82
90
-8.9%
12-Month Avg*
78
94
-17.0%
* Average Days on Market of all properties from February 2013 through January
2014. This is not the average of the individual figures above.
Historical Days on Market Until Sale by Month
120
110
100
90
80
70
1-2004
1-2005
1-2006
1-2007
1-2008
1-2009
1-2010
1-2011
1-2012
1-2013
1-2014
Current as of February 16, 2014. Data comes from the Georgia MLS, Columbus Board of REALTORS®, Savannah MLS and Greater Augusta Association of REALTORS®. Powered by 10K Research and Marketing. | Click for Cover Page | 6
7. Median Sales Price
Point at which half of the sales sold for more and half sold for less, not accounting for seller concessions, in a given month.
January
Median Sales Price
Year to Date
Prior Year
Percent Change
February 2013
2012
2013
+ 25.4%
- 18.6%
2014
2012
+ 29.3%
2013
+ 25.4%
2014
$147,500
$109,100
+35.2%
$155,000
$114,000
+36.0%
$159,900
$116,000
+37.8%
$153,450
$112,550
+36.3%
$145,000
$112,500
+28.9%
$147,000
$110,000
+33.6%
$143,000
$116,000
+23.3%
December 2013
$149,900
$120,050
+24.9%
January 2014
+ 29.3%
+31.4%
November 2013
- 18.6%
$105,000
October 2013
$87,000
$138,000
September 2013
$87,000
April 2013
July 2013
$112,500
+35.6%
August 2013
$112,500
+37.6%
$98,090
May 2013
$141,100
$86,500
$133,000
June 2013
$141,100
$119,000
March 2013
$141,100
$112,500
+25.4%
12-Month Med*
$145,000
$110,000
+31.8%
* Median Sales Price of all properties from February 2013 through January 2014.
This is not the average of the individual figures above.
Historical Median Sales Price by Month
$180,000
$160,000
$140,000
$120,000
$100,000
$80,000
1-2004
1-2005
1-2006
1-2007
1-2008
1-2009
1-2010
1-2011
1-2012
1-2013
1-2014
Current as of February 16, 2014. Data comes from the Georgia MLS, Columbus Board of REALTORS®, Savannah MLS and Greater Augusta Association of REALTORS®. Powered by 10K Research and Marketing. | Click for Cover Page | 7
8. Average Sales Price
Average sales price for all closed sales, not accounting for seller concessions, in a given month.
January
Average Sales Price
Year to Date
Prior Year
Percent Change
February 2013
2012
2013
- 13.3%
2014
2012
+ 18.8%
2013
+ 22.6%
2014
+25.8%
$158,895
+26.1%
$200,449
$159,798
+25.4%
$196,077
$151,920
+29.1%
$184,580
$152,671
+20.9%
$186,149
$151,839
+22.6%
$181,285
$154,535
+17.3%
December 2013
$194,136
$164,515
+18.0%
January 2014
+ 22.6%
$152,407
$200,410
November 2013
+ 18.8%
$191,721
October 2013
- 13.3%
+21.6%
September 2013
$126,224
$147,373
August 2013
$126,224
$179,243
June 2013
$150,007
+24.5%
July 2013
$150,007
+24.2%
$138,996
May 2013
$183,834
$127,280
$173,039
April 2013
$183,834
$158,107
March 2013
$183,834
$150,007
+22.6%
12-Month Avg*
$186,881
$151,166
+23.6%
* Average Sales Price of all properties from February 2013 through January 2014.
This is not the average of the individual figures above.
Historical Average Sales Price by Month
$240,000
$220,000
$200,000
$180,000
$160,000
$140,000
$120,000
1-2004
1-2005
1-2006
1-2007
1-2008
1-2009
1-2010
1-2011
1-2012
1-2013
1-2014
Current as of February 16, 2014. Data comes from the Georgia MLS, Columbus Board of REALTORS®, Savannah MLS and Greater Augusta Association of REALTORS®. Powered by 10K Research and Marketing. | Click for Cover Page | 8
9. Percent of Original List Price Received
Percentage found when dividing a property’s sales price by its original list price, then taking the average for all properties sold
in a given month, not accounting for seller concessions.
January
Pct. of Orig. Price Received
Year to Date
Prior Year
Percent Change
February 2013
2012
2013
2014
2012
2013
2014
95.5%
92.5%
+3.2%
95.5%
92.9%
+2.8%
95.5%
93.1%
+2.6%
95.5%
93.2%
+2.5%
94.9%
93.3%
+1.7%
94.5%
93.7%
+0.9%
94.2%
93.8%
+0.4%
December 2013
93.9%
93.8%
+0.1%
January 2014
+ 0.3%
+4.0%
November 2013
+ 4.5%
91.5%
October 2013
+ 2.3%
95.2%
September 2013
+ 0.3%
+4.9%
August 2013
+ 4.5%
+6.0%
90.3%
July 2013
+ 2.3%
89.0%
94.7%
June 2013
89.3%
93.6%
94.3%
May 2013
93.3%
March 2013
April 2013
89.3%
93.6%
93.3%
93.6%
93.3%
+0.3%
12-Month Avg*
94.9%
92.5%
+2.6%
* Average Pct. of Orig. Price Received for all properties from February 2013 through
January 2014. This is not the average of the individual figures above.
Historical Percent of Original List Price Received by Month
98%
96%
94%
92%
90%
88%
86%
84%
1-2004
1-2005
1-2006
1-2007
1-2008
1-2009
1-2010
1-2011
1-2012
1-2013
1-2014
Current as of February 16, 2014. Data comes from the Georgia MLS, Columbus Board of REALTORS®, Savannah MLS and Greater Augusta Association of REALTORS®. Powered by 10K Research and Marketing. | Click for Cover Page | 9
10. Housing Affordability Index
This index measures housing affordability for the region. An index of 120 means the median household income is 120% of what is
necessary to qualify for the median-priced home under prevailing interest rates. A higher number means greater affordability.
January
Affordability Index
Year to Date
Prior Year
Percent Change
February 2013
- 14.7%
2012
- 24.8%
2013
+ 26.0%
2014
2012
- 14.7%
2013
- 24.8%
2014
246
320
-23.1%
June 2013
224
312
-28.2%
July 2013
220
311
-29.3%
225
317
-29.0%
239
322
-25.8%
236
326
-27.6%
254
315
-19.4%
December 2013
235
309
-23.9%
January 2014
+ 26.0%
-17.8%
November 2013
236
326
October 2013
236
268
May 2013
314
-19.8%
September 2013
314
-20.7%
338
April 2013
368
372
271
August 2013
368
295
March 2013
236
314
-24.8%
12-Month Avg
246
246
0.0%
Historical Housing Affordability Index by Month
400
350
300
250
200
150
100
1-2004
1-2005
1-2006
1-2007
1-2008
1-2009
1-2010
1-2011
1-2012
1-2013
1-2014
Current as of February 16, 2014. Data comes from the Georgia MLS, Columbus Board of REALTORS®, Savannah MLS and Greater Augusta Association of REALTORS®. Powered by 10K Research and Marketing. | Click for Cover Page | 10
11. Inventory of Homes for Sale
The number of properties available for sale in active status at the end of a given month.
Homes for Sale
January
Prior Year
Percent Change
February 2013
-17.4%
49,186
-13.6%
43,006
47,870
-10.2%
42,881
46,205
-7.2%
43,060
45,077
-4.5%
42,833
44,351
-3.4%
41,858
42,067
-0.5%
December 2013
39,280
39,497
-0.5%
January 2014
37,070
38,545
-3.8%
12-Month Avg
2014
50,415
42,506
November 2013
2013
41,626
October 2013
2012
-20.1%
September 2013
- 3.8%
51,050
August 2013
- 24.3%
40,777
July 2013
- 21.7%
-20.2%
June 2013
37,070
-22.5%
50,515
May 2013
38,545
50,383
40,304
April 2013
50,931
39,033
March 2013
41,186
46,263
-11.0%
* Homes for Sale for all properties from February 2013 through January 2014. This
is not the average of the individual figures above.
Historical Inventory of Homes for Sale by Month
120,000
100,000
80,000
60,000
40,000
20,000
1-2004
1-2005
1-2006
1-2007
1-2008
1-2009
1-2010
1-2011
1-2012
1-2013
1-2014
Current as of February 16, 2014. Data comes from the Georgia MLS, Columbus Board of REALTORS®, Savannah MLS and Greater Augusta Association of REALTORS®. Powered by 10K Research and Marketing. | Click for Cover Page | 11
12. Months Supply of Inventory
The inventory of homes for sale at the end of a given month, divided by the average monthly pending sales from the last 12 months.
Months Supply
January
Prior Year
Percent Change
February 2013
-16.9%
6.9
-13.0%
6.1
6.6
-7.6%
6.1
6.4
-4.7%
6.0
6.4
-6.3%
6.0
6.2
-3.2%
5.9
5.9
0.0%
December 2013
5.5
5.5
0.0%
January 2014
5.1
5.4
-5.6%
12-Month Avg
2014
7.1
6.0
November 2013
2013
5.9
October 2013
2012
-19.4%
September 2013
- 5.6%
7.2
August 2013
- 27.0%
5.8
July 2013
- 31.5%
-20.8%
June 2013
5.1
-23.6%
7.2
May 2013
5.4
7.2
5.7
April 2013
7.4
5.5
March 2013
5.8
6.5
-10.8%
* Months Supply for all properties from February 2013 through January 2014. This
is not the average of the individual figures above.
Historical Months Supply of Inventory by Month
20.0
17.5
15.0
12.5
10.0
7.5
5.0
2.5
1-2004
1-2005
1-2006
1-2007
1-2008
1-2009
1-2010
1-2011
1-2012
1-2013
1-2014
Current as of February 16, 2014. Data comes from the Georgia MLS, Columbus Board of REALTORS®, Savannah MLS and Greater Augusta Association of REALTORS®. Powered by 10K Research and Marketing. | Click for Cover Page | 12