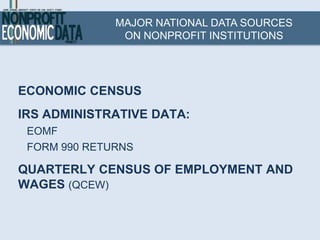
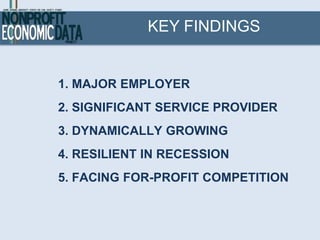
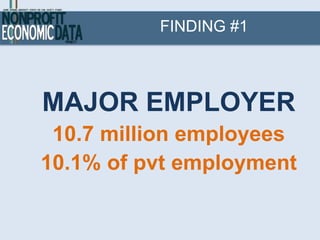
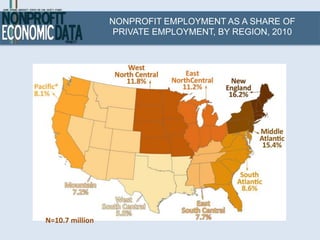
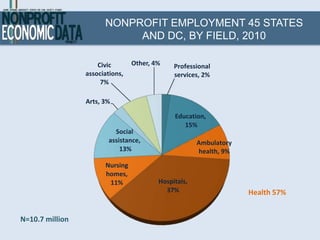
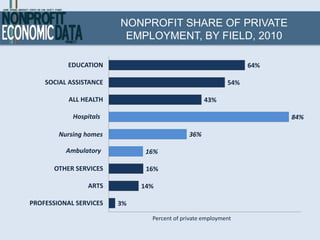
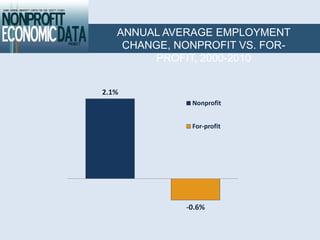
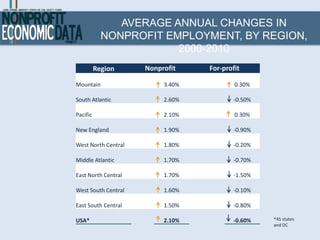
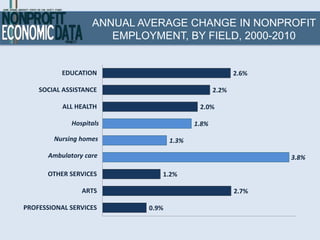
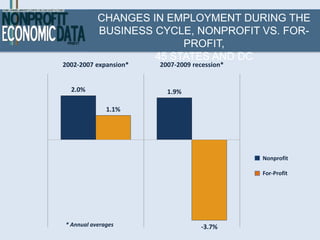
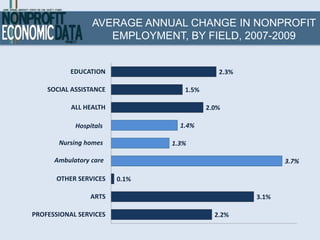
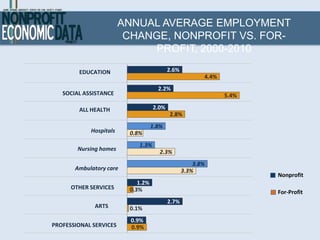
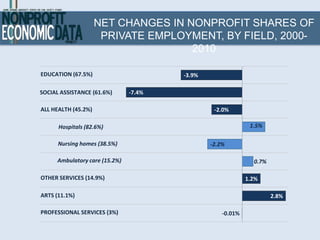
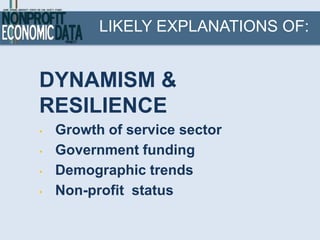
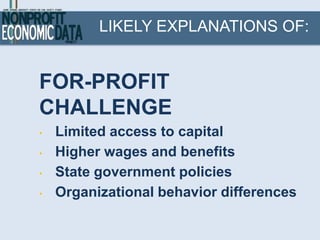
SlideShare a Scribd company logo
HOLDING THE FORT: NONPROFIT
   EMPLOYMENT DURING A
    DECADE OF TURMOIL

         S. Wojciech Sokolowski
        Johns Hopkins University


           March 28, 2012
MAJOR NATIONAL DATA SOURCES
               ON NONPROFIT INSTITUTIONS


ECONOMIC CENSUS
IRS ADMINISTRATIVE DATA:
 EOMF
 FORM 990 RETURNS

QUARTERLY CENSUS OF EMPLOYMENT AND
WAGES (QCEW)
OUR DATA ASSEMBLY STRATEGY


   QCEW             IRS
MICRODATA         RECORDS


    NONPROFIT ECONOMIC
        DATA (NED)
KEY FINDINGS


1. MAJOR EMPLOYER
2. SIGNIFICANT SERVICE PROVIDER
3. DYNAMICALLY GROWING
4. RESILIENT IN RECESSION
5. FACING FOR-PROFIT COMPETITION
FINDING #1


MAJOR EMPLOYER
 10.7 million employees
10.1% of pvt employment
EMPLOYMENT IN THE NONPROFIT SECTOR
                VS. SELECTED INDUSTRIES, 2010

             Retail trade                                                        14.5

         Manufacturing                                                    11.5

  NONPROFIT SECTOR*                                                     10.7

           Construction                           5.5

   Finance & insurance                            5.5

       Wholesale trade                            5.5

         Transportation                     3.9

             Real estate              1.9

             Agriculture          1.1

                    Mining      0.7

                    Utilities   0.6
                                                  millions of persons
*50 states and DC
NONPROFIT EMPLOYMENT AS A SHARE OF
                  PRIVATE EMPLOYMENT, BY REGION, 2010


N=10.7 million
FINDING #2


SIGNIFICANT
  SERVICE
 PROVIDER
NONPROFIT EMPLOYMENT 45 STATES
                            AND DC, BY FIELD, 2010

                     Civic       Other, 4%    Professional
                 associations,                services, 2%
                      7%

                 Arts, 3%

                                              Education,
                                                 15%
                          Social
                        assistance,                   Ambulatory
                            13%                       health, 9%
                       Nursing
                       homes,
                        11%              Hospitals,
                                           37%                     Health 57%


N=10.7 million
NONPROFIT SHARE OF PRIVATE
                         EMPLOYMENT, BY FIELD, 2010

           EDUCATION                                            64%

    SOCIAL ASSISTANCE                                     54%

           ALL HEALTH                             43%

            Hospitals                                                 84%

        Nursing homes                       36%

          Ambulatory          16%

       OTHER SERVICES         16%

                 ARTS        14%

PROFESSIONAL SERVICES   3%

                               Percent of private employment
FINDING #3


DYNAMICALLY
  GROWING
ANNUAL AVERAGE EMPLOYMENT
    CHANGE, NONPROFIT VS. FOR-
         PROFIT, 2000-2010


2.1%
              Nonprofit


              For-profit


             -0.6%
ANNUAL CHANGES IN EMPLOYMENT
                                                  NONPROFIT VS. FOR-PROFIT, 2000-2010

                 2000-          2001-          2002-          2003-       2004-     2005-    2006-         2007-          2008-          2009-
                 2001           2002           2003           2004        2005      2006     2007          2008           2009           2010
                 3.3%


                                2.8%


                                                                                                           2.6%
                                                                                             2.5%
percent change


                                                                                      2.2%
                                                                          2.0%
                                                                          1.9%


                                                                                    1.9%
                                                                 1.8%
                                               1.6%


                                                              1.3%


                                                                                                                          1.2%
                                                                                                    1.0%


                                                                                                                                         0.8%
                        -1.0%


                                                                                                                  -1.1%
                                                      -0.6%
                                       -1.9%


                                                                                                                                                -0.9%
                                                                        Nonprofit      For-profit


                                                                                                                                 -6.2%
AVERAGE ANNUAL CHANGES IN
            NONPROFIT EMPLOYMENT, BY REGION,
                        2000-2010
          Region     Nonprofit    For-profit

Mountain                  3.40%           0.30%

South Atlantic            2.60%           -0.50%

Pacific                   2.10%           0.30%

New England               1.90%           -0.90%

West North Central        1.80%           -0.20%

Middle Atlantic           1.70%           -0.70%

East North Central        1.70%           -1.50%

West South Central        1.60%           -0.10%

East South Central        1.50%           -0.80%

USA*                      2.10%          -0.60%    *45 states
                                                   and DC
ANNUAL AVERAGE CHANGE IN NONPROFIT
                       EMPLOYMENT, BY FIELD, 2000-2010


           EDUCATION                                    2.6%

    SOCIAL ASSISTANCE                            2.2%

           ALL HEALTH                      2.0%

              Hospitals                   1.8%

        Nursing homes              1.3%

       Ambulatory care                                         3.8%

      OTHER SERVICES           1.2%

                 ARTS                                   2.7%

PROFESSIONAL SERVICES       0.9%
FINDING #4


RESILIENT IN
RECESSION
CHANGES IN EMPLOYMENT DURING THE
           BUSINESS CYCLE, NONPROFIT VS. FOR-
                         PROFIT,
                    45 STATES AND DC
2002-2007 expansion*   2007-2009 recession*


  2.0%                   1.9%

              1.1%


                                              Nonprofit

                                              For-Profit


* Annual averages                  -3.7%
AVERAGE ANNUAL CHANGE IN NONPROFIT
                    EMPLOYMENT, BY FIELD, 2007-2009


           EDUCATION                        2.3%

    SOCIAL ASSISTANCE             1.5%

           ALL HEALTH                    2.0%

            Hospitals            1.4%

       Nursing homes           1.3%

      Ambulatory care                                     3.7%

       OTHER SERVICES   0.1%

                ARTS                               3.1%

PROFESSIONAL SERVICES                      2.2%
FINDING #5


FACING FOR-
  PROFIT
COMPETITION
ANNUAL AVERAGE EMPLOYMENT
                         CHANGE, NONPROFIT VS. FOR-
                              PROFIT, 2000-2010

        EDUCATION                         2.6%
                                                        4.4%
                                     2.2%
   SOCIAL ASSISTANCE                                           5.4%

        ALL HEALTH                 2.0%
                                          2.8%
                                   1.8%
            Hospitals    0.8%
                            1.3%
        Nursing homes                 2.3%
                                                     3.8%
       Ambulatory care                           3.3%
                                                                      Nonprofit
                            1.2%
      OTHER SERVICES     0.3%                                         For-Profit
                                          2.7%
             ARTS        0.1%
                          0.9%
PROFESSIONAL SERVICES     0.9%
NET CHANGES IN NONPROFIT SHARES OF
                      PRIVATE EMPLOYMENT, BY FIELD, 2000-
                                     2010

EDUCATION (67.5%)                       -3.9%

SOCIAL ASSISTANCE (61.6%)       -7.4%

ALL HEALTH (45.2%)                               -2.0%

      Hospitals (82.6%)                                       1.5%

      Nursing homes (38.5%)                     -2.2%

      Ambulatory care (15.2%)                                  0.7%

OTHER SERVICES (14.9%)                                       1.2%

ARTS (11.1%)                                                          2.8%

PROFESSIONAL SERVICES (3%)                          -0.01%
LIKELY EXPLANATIONS OF:


DYNAMISM &
RESILIENCE
•   Growth of service sector
•   Government funding
•   Demographic trends
•   Non-profit status
LIKELY EXPLANATIONS OF:


FOR-PROFIT
CHALLENGE
•   Limited access to capital
•   Higher wages and benefits
•   State government policies
•   Organizational behavior differences
THANK YOU
For more information &
  publications, visit
www.ccss.jhu.edu

More Related Content

What's hot

2012 State of the Vending Industry Report - Automatic Merchandiser - June / J...
2012 State of the Vending Industry Report - Automatic Merchandiser - June / J...2012 State of the Vending Industry Report - Automatic Merchandiser - June / J...
2012 State of the Vending Industry Report - Automatic Merchandiser - June / J...
Steven Duque
 
Wealth Teams Primer
Wealth Teams PrimerWealth Teams Primer
Wealth Teams Primer
guybee
 
Economic summary092010
Economic summary092010Economic summary092010
Economic summary092010
State of Utah, Salt Lake City
 
Antonio Donini - Civ-mil and the future of Humanitarian Action
Antonio Donini - Civ-mil and the future of Humanitarian ActionAntonio Donini - Civ-mil and the future of Humanitarian Action
Antonio Donini - Civ-mil and the future of Humanitarian Action
Australian Civil-Military Centre
 
Outsourcing Deal Activity - February 2011
Outsourcing Deal Activity - February 2011Outsourcing Deal Activity - February 2011
Outsourcing Deal Activity - February 2011
Everest Group
 
Pakistan Newspaper Industry Report 2011
Pakistan Newspaper Industry Report 2011Pakistan Newspaper Industry Report 2011
Pakistan Newspaper Industry Report 2011
Ejaz Asi
 
Latin Energy 12/2005
Latin Energy 12/2005Latin Energy 12/2005
Latin Energy 12/2005
AES Eletropaulo
 
Englewood 2013 forecast_022613
Englewood 2013 forecast_022613Englewood 2013 forecast_022613
Englewood 2013 forecast_022613
Jordan2CO
 
Assessing the Economics of Obesity and Obesity Interventions by Michael J. O'...
Assessing the Economics of Obesity and Obesity Interventions by Michael J. O'...Assessing the Economics of Obesity and Obesity Interventions by Michael J. O'...
Assessing the Economics of Obesity and Obesity Interventions by Michael J. O'...
Wisconsin Women's Health Foundation
 
St. Lucia - Trade Profile [UWI's Shridath Ramphal Centre]
St. Lucia - Trade Profile [UWI's Shridath Ramphal Centre]St. Lucia - Trade Profile [UWI's Shridath Ramphal Centre]
St. Lucia - Trade Profile [UWI's Shridath Ramphal Centre]
Office of Trade Negotiations (OTN), CARICOM Secretariat
 
Outsourcing deal activity november 2011
Outsourcing deal activity  november 2011Outsourcing deal activity  november 2011
Outsourcing deal activity november 2011
Everest Group
 
Sample 1
Sample 1Sample 1
Sample 1
Arnaud F
 
Outsourcing Deal Activity – February 2012
Outsourcing Deal Activity – February 2012Outsourcing Deal Activity – February 2012
Outsourcing Deal Activity – February 2012
Everest Group
 
Barb vankerkhove 2012 presentation
Barb vankerkhove 2012 presentationBarb vankerkhove 2012 presentation
Barb vankerkhove 2012 presentation
Elyk Venture Management
 
Electrolux Capital Markets Day 2012 - Presentation Alberto Zanata
Electrolux Capital Markets Day 2012 - Presentation Alberto ZanataElectrolux Capital Markets Day 2012 - Presentation Alberto Zanata
Electrolux Capital Markets Day 2012 - Presentation Alberto Zanata
Electrolux Group
 
Variaciones Merval 1993 - 2008
Variaciones Merval 1993 - 2008Variaciones Merval 1993 - 2008
Variaciones Merval 1993 - 2008
Cityblog
 
O'Shaughnessy's Four Value Factors
O'Shaughnessy's Four Value FactorsO'Shaughnessy's Four Value Factors
O'Shaughnessy's Four Value Factors
Justin Case
 
Hispanic Labor in the Swine Industry… a Thing of the Past?
Hispanic Labor in the Swine Industry…  a Thing of the Past?Hispanic Labor in the Swine Industry…  a Thing of the Past?
Hispanic Labor in the Swine Industry… a Thing of the Past?
John Blue
 
Understanding and Using Labor Market Information
Understanding and Using Labor Market InformationUnderstanding and Using Labor Market Information
Understanding and Using Labor Market Information
Michele Martin
 
Economia global
Economia globalEconomia global
Economia global
Gabriela Otto
 

What's hot (20)

2012 State of the Vending Industry Report - Automatic Merchandiser - June / J...
2012 State of the Vending Industry Report - Automatic Merchandiser - June / J...2012 State of the Vending Industry Report - Automatic Merchandiser - June / J...
2012 State of the Vending Industry Report - Automatic Merchandiser - June / J...
 
Wealth Teams Primer
Wealth Teams PrimerWealth Teams Primer
Wealth Teams Primer
 
Economic summary092010
Economic summary092010Economic summary092010
Economic summary092010
 
Antonio Donini - Civ-mil and the future of Humanitarian Action
Antonio Donini - Civ-mil and the future of Humanitarian ActionAntonio Donini - Civ-mil and the future of Humanitarian Action
Antonio Donini - Civ-mil and the future of Humanitarian Action
 
Outsourcing Deal Activity - February 2011
Outsourcing Deal Activity - February 2011Outsourcing Deal Activity - February 2011
Outsourcing Deal Activity - February 2011
 
Pakistan Newspaper Industry Report 2011
Pakistan Newspaper Industry Report 2011Pakistan Newspaper Industry Report 2011
Pakistan Newspaper Industry Report 2011
 
Latin Energy 12/2005
Latin Energy 12/2005Latin Energy 12/2005
Latin Energy 12/2005
 
Englewood 2013 forecast_022613
Englewood 2013 forecast_022613Englewood 2013 forecast_022613
Englewood 2013 forecast_022613
 
Assessing the Economics of Obesity and Obesity Interventions by Michael J. O'...
Assessing the Economics of Obesity and Obesity Interventions by Michael J. O'...Assessing the Economics of Obesity and Obesity Interventions by Michael J. O'...
Assessing the Economics of Obesity and Obesity Interventions by Michael J. O'...
 
St. Lucia - Trade Profile [UWI's Shridath Ramphal Centre]
St. Lucia - Trade Profile [UWI's Shridath Ramphal Centre]St. Lucia - Trade Profile [UWI's Shridath Ramphal Centre]
St. Lucia - Trade Profile [UWI's Shridath Ramphal Centre]
 
Outsourcing deal activity november 2011
Outsourcing deal activity  november 2011Outsourcing deal activity  november 2011
Outsourcing deal activity november 2011
 
Sample 1
Sample 1Sample 1
Sample 1
 
Outsourcing Deal Activity – February 2012
Outsourcing Deal Activity – February 2012Outsourcing Deal Activity – February 2012
Outsourcing Deal Activity – February 2012
 
Barb vankerkhove 2012 presentation
Barb vankerkhove 2012 presentationBarb vankerkhove 2012 presentation
Barb vankerkhove 2012 presentation
 
Electrolux Capital Markets Day 2012 - Presentation Alberto Zanata
Electrolux Capital Markets Day 2012 - Presentation Alberto ZanataElectrolux Capital Markets Day 2012 - Presentation Alberto Zanata
Electrolux Capital Markets Day 2012 - Presentation Alberto Zanata
 
Variaciones Merval 1993 - 2008
Variaciones Merval 1993 - 2008Variaciones Merval 1993 - 2008
Variaciones Merval 1993 - 2008
 
O'Shaughnessy's Four Value Factors
O'Shaughnessy's Four Value FactorsO'Shaughnessy's Four Value Factors
O'Shaughnessy's Four Value Factors
 
Hispanic Labor in the Swine Industry… a Thing of the Past?
Hispanic Labor in the Swine Industry…  a Thing of the Past?Hispanic Labor in the Swine Industry…  a Thing of the Past?
Hispanic Labor in the Swine Industry… a Thing of the Past?
 
Understanding and Using Labor Market Information
Understanding and Using Labor Market InformationUnderstanding and Using Labor Market Information
Understanding and Using Labor Market Information
 
Economia global
Economia globalEconomia global
Economia global
 

Similar to Nonprofit employment in recession

Tv Industry Report 2012
Tv Industry Report 2012Tv Industry Report 2012
Tax Reforms in Georgia
Tax Reforms in GeorgiaTax Reforms in Georgia
Tax Reforms in Georgia
Sergey
 
Mohr - Recessionary Impact on Unemployment Taxes
Mohr - Recessionary Impact on Unemployment TaxesMohr - Recessionary Impact on Unemployment Taxes
Mohr - Recessionary Impact on Unemployment Taxes
HR Florida State Council, Inc.
 
Manufacturing Economic Update
Manufacturing Economic UpdateManufacturing Economic Update
Manufacturing Economic Update
Council of Manufacturing Associations
 
Report Marketing Networking - 24.10.12
Report Marketing Networking - 24.10.12Report Marketing Networking - 24.10.12
Report Marketing Networking - 24.10.12
KingBee Media
 
Economic Outlook Conference 2012: Maryland's Economic Outlook
Economic Outlook Conference 2012: Maryland's Economic OutlookEconomic Outlook Conference 2012: Maryland's Economic Outlook
Economic Outlook Conference 2012: Maryland's Economic Outlook
Towson University's Division of Innovation & Applied Research
 
Natalie Gochnour - Ivory institute 2011
Natalie Gochnour - Ivory institute 2011Natalie Gochnour - Ivory institute 2011
Natalie Gochnour - Ivory institute 2011
Salt Lake Chamber
 
Spatial-temporal analysis of the risk of Rift Valley fever in Kenya
Spatial-temporal analysis of the risk of Rift Valley fever in KenyaSpatial-temporal analysis of the risk of Rift Valley fever in Kenya
Spatial-temporal analysis of the risk of Rift Valley fever in Kenya
ILRI
 
Third point-exposure-report
Third point-exposure-reportThird point-exposure-report
Third point-exposure-report
Frank Ragol
 
Apresentacao renda fixa_final.v2
Apresentacao renda fixa_final.v2Apresentacao renda fixa_final.v2
Apresentacao renda fixa_final.v2
risantander
 
Apresentacao renda fixa_final.v2.11.02.11
Apresentacao renda fixa_final.v2.11.02.11Apresentacao renda fixa_final.v2.11.02.11
Apresentacao renda fixa_final.v2.11.02.11
risantander
 
Bill Handel Discusses Loan Growth at Raddon’s CEO Forum
Bill Handel Discusses Loan Growth at Raddon’s CEO ForumBill Handel Discusses Loan Growth at Raddon’s CEO Forum
Bill Handel Discusses Loan Growth at Raddon’s CEO Forum
Raddon Financial Group
 
Israel’s Economic Highlights Presentation, Q4 2011
Israel’s Economic Highlights Presentation, Q4 2011Israel’s Economic Highlights Presentation, Q4 2011
Israel’s Economic Highlights Presentation, Q4 2011
Assaf Luxembourg
 
Population Volumes & Finance
Population Volumes & FinancePopulation Volumes & Finance
Population Volumes & Finance
Ron_Janzen
 
BIG Call June 2012 Sneak Peek
BIG Call June 2012 Sneak PeekBIG Call June 2012 Sneak Peek
BIG Call June 2012 Sneak Peek
Prosper Business Development
 
IHC -- Health reform: What it means and what's next
IHC -- Health reform: What it means and what's nextIHC -- Health reform: What it means and what's next
IHC -- Health reform: What it means and what's next
Galen Institute
 
Israel’s Economic Highlights Presentation, Q1 2012
Israel’s Economic Highlights Presentation, Q1 2012Israel’s Economic Highlights Presentation, Q1 2012
Israel’s Economic Highlights Presentation, Q1 2012
Assaf Luxembourg
 
Governor's Economic Council Utah Report 10-11-12
Governor's Economic Council Utah Report 10-11-12Governor's Economic Council Utah Report 10-11-12
Governor's Economic Council Utah Report 10-11-12
Salt Lake Chamber
 
Top12 health issues
Top12 health issuesTop12 health issues
Top12 health issues
Envision Technology Advisors
 
The Economy: How Are We Really Doing?
The Economy: How Are We Really Doing?The Economy: How Are We Really Doing?
The Economy: How Are We Really Doing?
State of Utah, Salt Lake City
 

Similar to Nonprofit employment in recession (20)

Tv Industry Report 2012
Tv Industry Report 2012Tv Industry Report 2012
Tv Industry Report 2012
 
Tax Reforms in Georgia
Tax Reforms in GeorgiaTax Reforms in Georgia
Tax Reforms in Georgia
 
Mohr - Recessionary Impact on Unemployment Taxes
Mohr - Recessionary Impact on Unemployment TaxesMohr - Recessionary Impact on Unemployment Taxes
Mohr - Recessionary Impact on Unemployment Taxes
 
Manufacturing Economic Update
Manufacturing Economic UpdateManufacturing Economic Update
Manufacturing Economic Update
 
Report Marketing Networking - 24.10.12
Report Marketing Networking - 24.10.12Report Marketing Networking - 24.10.12
Report Marketing Networking - 24.10.12
 
Economic Outlook Conference 2012: Maryland's Economic Outlook
Economic Outlook Conference 2012: Maryland's Economic OutlookEconomic Outlook Conference 2012: Maryland's Economic Outlook
Economic Outlook Conference 2012: Maryland's Economic Outlook
 
Natalie Gochnour - Ivory institute 2011
Natalie Gochnour - Ivory institute 2011Natalie Gochnour - Ivory institute 2011
Natalie Gochnour - Ivory institute 2011
 
Spatial-temporal analysis of the risk of Rift Valley fever in Kenya
Spatial-temporal analysis of the risk of Rift Valley fever in KenyaSpatial-temporal analysis of the risk of Rift Valley fever in Kenya
Spatial-temporal analysis of the risk of Rift Valley fever in Kenya
 
Third point-exposure-report
Third point-exposure-reportThird point-exposure-report
Third point-exposure-report
 
Apresentacao renda fixa_final.v2
Apresentacao renda fixa_final.v2Apresentacao renda fixa_final.v2
Apresentacao renda fixa_final.v2
 
Apresentacao renda fixa_final.v2.11.02.11
Apresentacao renda fixa_final.v2.11.02.11Apresentacao renda fixa_final.v2.11.02.11
Apresentacao renda fixa_final.v2.11.02.11
 
Bill Handel Discusses Loan Growth at Raddon’s CEO Forum
Bill Handel Discusses Loan Growth at Raddon’s CEO ForumBill Handel Discusses Loan Growth at Raddon’s CEO Forum
Bill Handel Discusses Loan Growth at Raddon’s CEO Forum
 
Israel’s Economic Highlights Presentation, Q4 2011
Israel’s Economic Highlights Presentation, Q4 2011Israel’s Economic Highlights Presentation, Q4 2011
Israel’s Economic Highlights Presentation, Q4 2011
 
Population Volumes & Finance
Population Volumes & FinancePopulation Volumes & Finance
Population Volumes & Finance
 
BIG Call June 2012 Sneak Peek
BIG Call June 2012 Sneak PeekBIG Call June 2012 Sneak Peek
BIG Call June 2012 Sneak Peek
 
IHC -- Health reform: What it means and what's next
IHC -- Health reform: What it means and what's nextIHC -- Health reform: What it means and what's next
IHC -- Health reform: What it means and what's next
 
Israel’s Economic Highlights Presentation, Q1 2012
Israel’s Economic Highlights Presentation, Q1 2012Israel’s Economic Highlights Presentation, Q1 2012
Israel’s Economic Highlights Presentation, Q1 2012
 
Governor's Economic Council Utah Report 10-11-12
Governor's Economic Council Utah Report 10-11-12Governor's Economic Council Utah Report 10-11-12
Governor's Economic Council Utah Report 10-11-12
 
Top12 health issues
Top12 health issuesTop12 health issues
Top12 health issues
 
The Economy: How Are We Really Doing?
The Economy: How Are We Really Doing?The Economy: How Are We Really Doing?
The Economy: How Are We Really Doing?
 

Nonprofit employment in recession

  • 1. HOLDING THE FORT: NONPROFIT EMPLOYMENT DURING A DECADE OF TURMOIL S. Wojciech Sokolowski Johns Hopkins University March 28, 2012
  • 2. MAJOR NATIONAL DATA SOURCES ON NONPROFIT INSTITUTIONS ECONOMIC CENSUS IRS ADMINISTRATIVE DATA: EOMF FORM 990 RETURNS QUARTERLY CENSUS OF EMPLOYMENT AND WAGES (QCEW)
  • 3. OUR DATA ASSEMBLY STRATEGY QCEW IRS MICRODATA RECORDS NONPROFIT ECONOMIC DATA (NED)
  • 4. KEY FINDINGS 1. MAJOR EMPLOYER 2. SIGNIFICANT SERVICE PROVIDER 3. DYNAMICALLY GROWING 4. RESILIENT IN RECESSION 5. FACING FOR-PROFIT COMPETITION
  • 5. FINDING #1 MAJOR EMPLOYER 10.7 million employees 10.1% of pvt employment
  • 6. EMPLOYMENT IN THE NONPROFIT SECTOR VS. SELECTED INDUSTRIES, 2010 Retail trade 14.5 Manufacturing 11.5 NONPROFIT SECTOR* 10.7 Construction 5.5 Finance & insurance 5.5 Wholesale trade 5.5 Transportation 3.9 Real estate 1.9 Agriculture 1.1 Mining 0.7 Utilities 0.6 millions of persons *50 states and DC
  • 7. NONPROFIT EMPLOYMENT AS A SHARE OF PRIVATE EMPLOYMENT, BY REGION, 2010 N=10.7 million
  • 8. FINDING #2 SIGNIFICANT SERVICE PROVIDER
  • 9. NONPROFIT EMPLOYMENT 45 STATES AND DC, BY FIELD, 2010 Civic Other, 4% Professional associations, services, 2% 7% Arts, 3% Education, 15% Social assistance, Ambulatory 13% health, 9% Nursing homes, 11% Hospitals, 37% Health 57% N=10.7 million
  • 10. NONPROFIT SHARE OF PRIVATE EMPLOYMENT, BY FIELD, 2010 EDUCATION 64% SOCIAL ASSISTANCE 54% ALL HEALTH 43% Hospitals 84% Nursing homes 36% Ambulatory 16% OTHER SERVICES 16% ARTS 14% PROFESSIONAL SERVICES 3% Percent of private employment
  • 12. ANNUAL AVERAGE EMPLOYMENT CHANGE, NONPROFIT VS. FOR- PROFIT, 2000-2010 2.1% Nonprofit For-profit -0.6%
  • 13. ANNUAL CHANGES IN EMPLOYMENT NONPROFIT VS. FOR-PROFIT, 2000-2010 2000- 2001- 2002- 2003- 2004- 2005- 2006- 2007- 2008- 2009- 2001 2002 2003 2004 2005 2006 2007 2008 2009 2010 3.3% 2.8% 2.6% 2.5% percent change 2.2% 2.0% 1.9% 1.9% 1.8% 1.6% 1.3% 1.2% 1.0% 0.8% -1.0% -1.1% -0.6% -1.9% -0.9% Nonprofit For-profit -6.2%
  • 14. AVERAGE ANNUAL CHANGES IN NONPROFIT EMPLOYMENT, BY REGION, 2000-2010 Region Nonprofit For-profit Mountain 3.40% 0.30% South Atlantic 2.60% -0.50% Pacific 2.10% 0.30% New England 1.90% -0.90% West North Central 1.80% -0.20% Middle Atlantic 1.70% -0.70% East North Central 1.70% -1.50% West South Central 1.60% -0.10% East South Central 1.50% -0.80% USA* 2.10% -0.60% *45 states and DC
  • 15. ANNUAL AVERAGE CHANGE IN NONPROFIT EMPLOYMENT, BY FIELD, 2000-2010 EDUCATION 2.6% SOCIAL ASSISTANCE 2.2% ALL HEALTH 2.0% Hospitals 1.8% Nursing homes 1.3% Ambulatory care 3.8% OTHER SERVICES 1.2% ARTS 2.7% PROFESSIONAL SERVICES 0.9%
  • 17. CHANGES IN EMPLOYMENT DURING THE BUSINESS CYCLE, NONPROFIT VS. FOR- PROFIT, 45 STATES AND DC 2002-2007 expansion* 2007-2009 recession* 2.0% 1.9% 1.1% Nonprofit For-Profit * Annual averages -3.7%
  • 18. AVERAGE ANNUAL CHANGE IN NONPROFIT EMPLOYMENT, BY FIELD, 2007-2009 EDUCATION 2.3% SOCIAL ASSISTANCE 1.5% ALL HEALTH 2.0% Hospitals 1.4% Nursing homes 1.3% Ambulatory care 3.7% OTHER SERVICES 0.1% ARTS 3.1% PROFESSIONAL SERVICES 2.2%
  • 19. FINDING #5 FACING FOR- PROFIT COMPETITION
  • 20. ANNUAL AVERAGE EMPLOYMENT CHANGE, NONPROFIT VS. FOR- PROFIT, 2000-2010 EDUCATION 2.6% 4.4% 2.2% SOCIAL ASSISTANCE 5.4% ALL HEALTH 2.0% 2.8% 1.8% Hospitals 0.8% 1.3% Nursing homes 2.3% 3.8% Ambulatory care 3.3% Nonprofit 1.2% OTHER SERVICES 0.3% For-Profit 2.7% ARTS 0.1% 0.9% PROFESSIONAL SERVICES 0.9%
  • 21. NET CHANGES IN NONPROFIT SHARES OF PRIVATE EMPLOYMENT, BY FIELD, 2000- 2010 EDUCATION (67.5%) -3.9% SOCIAL ASSISTANCE (61.6%) -7.4% ALL HEALTH (45.2%) -2.0% Hospitals (82.6%) 1.5% Nursing homes (38.5%) -2.2% Ambulatory care (15.2%) 0.7% OTHER SERVICES (14.9%) 1.2% ARTS (11.1%) 2.8% PROFESSIONAL SERVICES (3%) -0.01%
  • 22. LIKELY EXPLANATIONS OF: DYNAMISM & RESILIENCE • Growth of service sector • Government funding • Demographic trends • Non-profit status
  • 23. LIKELY EXPLANATIONS OF: FOR-PROFIT CHALLENGE • Limited access to capital • Higher wages and benefits • State government policies • Organizational behavior differences
  • 24. THANK YOU For more information & publications, visit www.ccss.jhu.edu