
Recommended
More Related Content
What's hot
What's hot (20)
Similar to Variaciones Merval 1993 - 2008
Similar to Variaciones Merval 1993 - 2008 (20)
More from Cityblog
More from Cityblog (20)
Recently uploaded
Recently uploaded (20)
Variaciones Merval 1993 - 2008
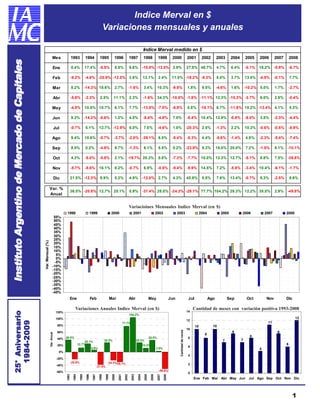
- 1. Indice Merval en $ Variaciones mensuales y anuales Indice Merval medido en $ Mes 1993 1994 1995 1996 1997 1998 1999 2000 2001 2002 2003 2004 2005 2006 2007 2008 Capitales Instituto Argentino de Mercado de Capitales 0.4% 17.4% -5.5% 8.5% 6.6% -10.9% -13.5% 2.9% 27.8% 48.7% 4.7% 6.4% -0.1% 16.2% -0.9% -6.7% Ene -9.2% -4.6% -25.9% -12.0% 3.6% 12.1% 2.4% 11.5% -18.2% -9.3% 8.0% 3.7% 13.5% -4.5% -0.1% 7.7% Feb 8.2% -14.3% 18.6% 2.7% -1.6% 3.4% 10.3% -9.9% 1.8% 9.5% -4.6% 1.6% -10.2% 5.0% 1.7% -2.7% Mar -5.6% -2.3% 2.5% 11.1% 2.3% -1.6% 34.3% -10.5% -1.8% -11.1% 12.3% -10.3% -3.7% 6.0% 2.5% -0.4% Abr -4.9% 10.9% 10.7% 6.1% 7.7% -13.9% -7.0% -8.9% 0.8% -18.1% 6.7% -11.6% 10.2% -13.4% 4.1% 5.3% May 9.3% -14.2% -6.6% 1.2% 4.0% -8.6% -4.8% 7.0% -8.4% 10.4% 12.9% -0.8% -8.0% 3.5% -2.3% -4.4% Jun Mercado -0.7% 5.1% 12.7% -12.9% 5.0% 7.0% -4.6% 1.0% -20.3% 2.5% -1.3% 2.2% 10.3% -0.6% -0.5% -8.9% Jul 9.4% 10.6% -0.7% -3.7% -2.0% -39.1% 6.5% -5.4% -0.3% 4.4% -5.6% -1.4% 4.9% -2.3% -5.4% -7.4% Ago 8.5% 0.2% -4.9% 9.7% -1.3% 6.1% 5.5% 0.2% -23.9% 5.3% 16.0% 20.0% 7.2% -1.5% 6.1% -10.1% Sep 4.3% -5.0% -5.8% 2.1% -19.7% 20.3% 0.8% -7.3% -7.7% 10.0% 12.3% 12.7% -5.1% 8.8% 7.5% -36.8% Oct -5.7% -8.6% 16.1% 8.2% -0.7% 6.9% -0.5% -9.4% -9.9% 14.5% 7.2% -5.8% -3.4% 10.4% -6.1% -1.7% Nov 21.5% -12.3% 9.9% 5.2% 4.9% -12.0% 2.7% 4.3% 45.9% 5.5% 7.6% 13.4% -0.7% 6.3% -2.5% 8.6% Dic Var. % 36.5% -20.9% 12.7% 25.1% 5.9% -37.4% 28.0% -24.3% -29.1% 77.7% 104.2% 28.3% 12.2% 35.5% 2.9% -49.8% Anual Variacioines Mensuales Indice Merval (en $) 1998 1999 2000 2001 2002 2003 2004 2005 2006 2007 2008 55% Arg 50% 45% 40% 35% 30% 25% Var. Mensual (%) 20% 15% 10% 5% 0% -5% -10% -15% -20% -25% -30% -35% -40% -45% Ene Feb Mar Abr May Jun Jul Ago Sep Oct Nov Dic Variaciones Anuales Indice Merval (en $) Cantidad de meses con variación positiva 1993-2008 14 25° Aniversario 120% 104.2% 12 100% 12 1984-2009 11 77.7% 80% 10 10 10 Cantidad de veces 9 9 60% Var. Anual 8 8 40% 36.5% 35.5% 8 7 28.0% 28.3% 7 25.1% 6 12.7% 20% 12.2% 6 5.9% 2.9% 5 0% 4 -20% -20.9% -24.3%-29.1% 2 -40% -37.4% -49.8% -60% 0 1993 1994 1995 1996 1997 1998 1999 2000 2001 2002 2003 2004 2005 2006 2007 2008 Ene Feb Mar Abr May Jun Jul Ago Sep Oct Nov Dic 1
- 2. Indice Merval en U$S Variaciones mensuales y anuales Indice Merval medido en U$S Mes 1993 1994 1995 1996 1997 1998 1999 2000 2001 2002 2003 2004 2005 2006 2007 2008 Capitales Instituto Argentino de Mercado de Capitales 0.4% 17.4% -5.5% 8.5% 6.6% -10.9% -13.5% 2.9% 27.8% -24.9% 10.0% 6.8% 1.7% 8.5% -2.1% -7.0% Ene -9.2% -4.6% -25.9% -12.0% 3.6% 12.1% 2.4% 11.5% -18.2% -16.9% 8.3% 3.8% 12.8% 0.9% 0.1% 7.7% Feb 8.2% -14.3% 18.6% 2.7% -1.6% 3.4% 10.3% -9.9% 1.8% -20.4% 2.4% 3.8% -9.4% 4.7% 1.7% -3.0% Mar -5.6% -2.3% 2.5% 11.1% 2.3% -1.6% 34.3% -10.5% -1.8% -11.7% 18.2% -9.5% -3.5% 7.1% 2.8% -0.2% Abr -4.9% 10.9% 10.7% 6.1% 7.7% -13.9% -7.0% -8.9% 0.8% -32.2% 5.5% -15.4% 11.2% -14.4% 4.5% 7.5% May 9.3% -14.2% -6.6% 1.2% 4.0% -8.6% -4.8% 7.0% -8.4% 3.3% 15.3% -0.6% -8.1% 3.5% -2.8% -2.1% Jun Mercado -0.7% 5.1% 12.7% -12.9% 5.0% 7.0% -4.6% 1.0% -20.3% 6.3% -5.4% 1.7% 11.2% -0.1% -1.4% -9.4% Jul 9.4% 10.6% -0.7% -3.7% -2.0% -39.1% 6.5% -5.4% -0.3% 7.0% -6.8% -2.2% 3.1% -3.1% -6.5% -7.1% Ago 8.5% 0.2% -4.9% 9.7% -1.3% 6.1% 5.5% 0.2% -23.9% 2.2% 17.6% 20.6% 7.2% -1.8% 6.4% -13.0% Sep 4.3% -5.0% -5.8% 2.1% -19.7% 20.3% 0.8% -7.3% -7.7% 16.9% 13.9% 13.1% -8.0% 9.3% 7.7% -41.5% Oct -5.7% -8.6% 16.1% 8.2% -0.7% 6.9% -0.5% -9.4% -9.9% 11.0% 3.2% -5.0% -2.2% 11.1% -6.2% -1.2% Nov 21.5% -12.3% 9.9% 5.2% 4.9% -12.0% 2.7% 4.3% 45.9% 13.6% 9.4% 12.2% -2.8% 6.2% -2.7% 6.2% Dic Var. % 36.5% -20.9% 12.7% 25.1% 5.9% -37.4% 28.0% -24.3% -29.1% -47.3% 134.1% 26.7% 10.2% 33.6% 0.4% -54.2% Anual Variacioines Mensuales Indice Merval (en U$S) 1998 1999 2000 2001 2002 2003 2004 2005 2006 2007 2008 55% 50% Arg 45% 40% 35% 30% 25% Var. Mensual (%) 20% 15% 10% 5% 0% -5% -10% -15% -20% -25% -30% -35% -40% -45% -50% Ene Feb Mar Abr May Jun Jul Ago Sep Oct Nov Dic Variaciones Anuales Indice Merval (en U$S) Cantidad de meses con variación positiva 1993-2008 25° Aniversario 150% 14 134.1% 12 125% 1984-2009 12 11 100% 10 10 10 10 Cantidad de veces 75% 9 Var. Anual 9 8 50% 36.5% 8 7 26.7% 33.6% 7 28.0% 25.1% 6 25% 12.7% 10.2% 6 5.9% 0.4% 5 0% 4 -25% -20.9% -24.3% -29.1% -50% 2 -37.4% -47.3% -54.2% -75% 0 1993 1994 1995 1996 1997 1998 1999 2000 2001 2002 2003 2004 2005 2006 2007 2008 Ene Feb Mar Abr May Jun Jul Ago Sep Oct Nov Dic 2