Download to read offline

![2
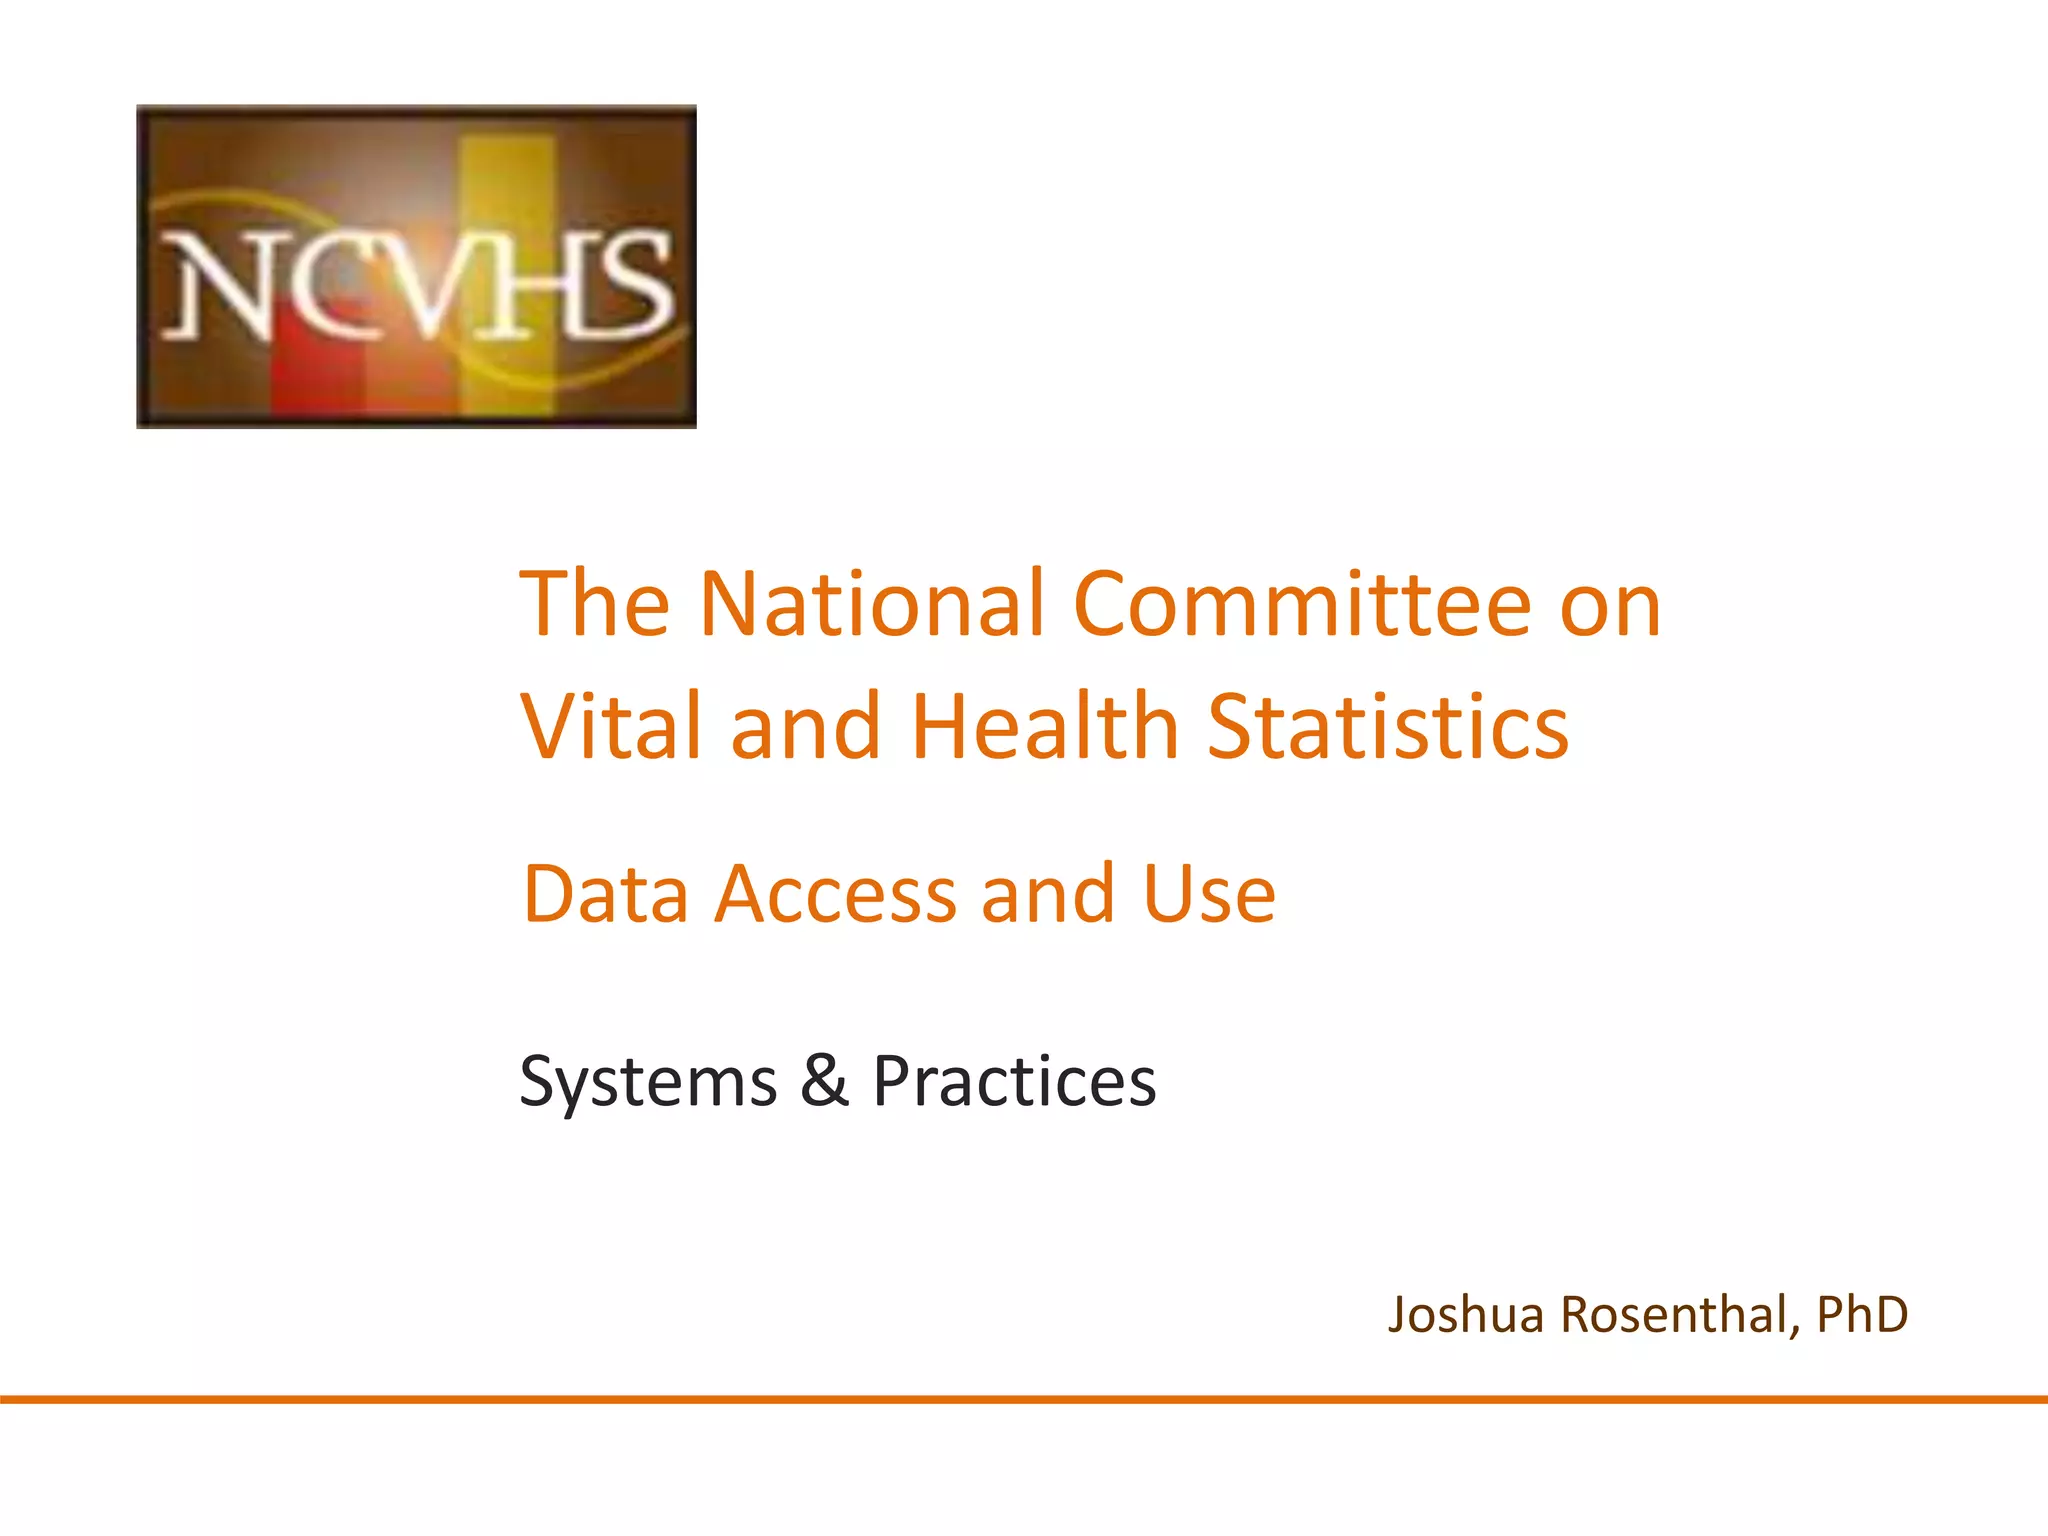
SYSTEMS & PRACTICES
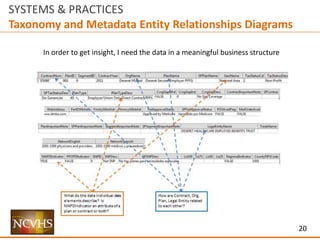
Structure
Ecosystem Interaction
How does someone find a site / delivery mechanism
or information within a site / delivery mechanism
via another channel?
UI / UX
[User Interaction / User Experience]
How does someone use and experience
a site / delivery mechanism?
Information Architecture
How does someone find information within
a site / delivery mechanism?
Data
How useful and usable is the data within
a site / delivery system?](https://image.slidesharecdn.com/nchvsdataaccessanduserosenthalwithappendix02-160407195351/85/NCVHS-Data-Access-and-Use-Joshua-Rosenthal-2-320.jpg)
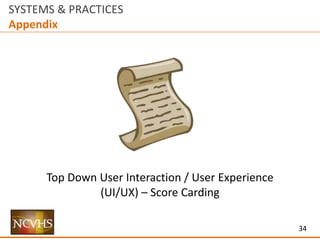
![3
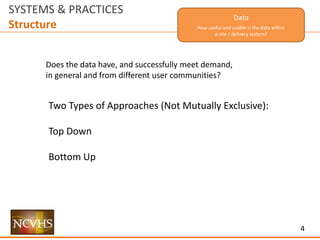
SYSTEMS & PRACTICES
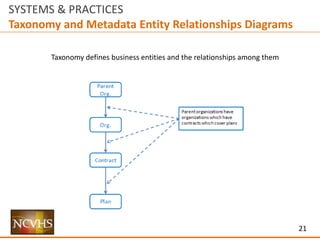
Structure
Ecosystem Interaction
How does someone find a site / delivery mechanism
or information within a site / delivery mechanism
via another channel?
UI / UX
[User Interaction / User Experience]
How does someone use and experience
a site / delivery mechanism?
Information Architecture
How does someone find information within
a site / delivery mechanism?
Data
How useful and usable is the data within
a site / delivery system?](https://image.slidesharecdn.com/nchvsdataaccessanduserosenthalwithappendix02-160407195351/85/NCVHS-Data-Access-and-Use-Joshua-Rosenthal-3-320.jpg)
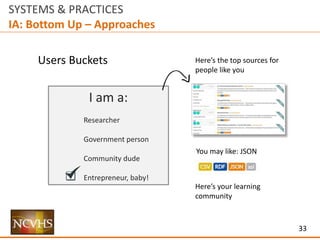
![6
SYSTEMS & PRACTICES
Structure
Ecosystem Interaction
How does someone find a site / delivery mechanism
or information within a site / delivery mechanism
via another channel?
UI / UX
[User Interaction / User Experience]
How does someone use and experience
a site / delivery mechanism?
Information Architecture
How does someone find information within
a site / delivery mechanism?
Data
How useful and usable is the data within
a site / delivery system?](https://image.slidesharecdn.com/nchvsdataaccessanduserosenthalwithappendix02-160407195351/85/NCVHS-Data-Access-and-Use-Joshua-Rosenthal-6-320.jpg)
![8
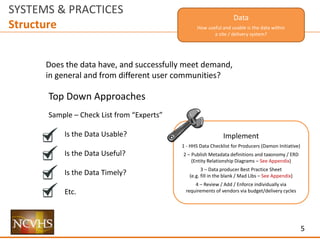
SYSTEMS & PRACTICES
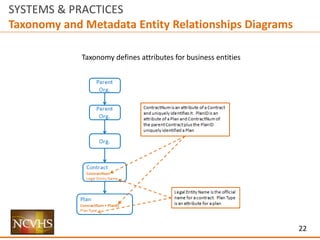
Structure
Information Architecture
How does someone find information within
a site / delivery mechanism?
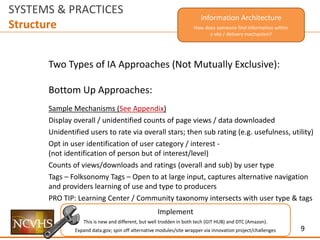
Two Types of IA Approaches (Not Mutually Exclusive):
Top Down Approaches:
Sample Mechanisms (See Appendix for sample schema)
Site Map (structured around IA Taxonomy)
[PRO TIP / V2: this should intersect with metadata taxonomy]
Source vs./and Topics – Parallel navigation (supports different users / use cases)
Tags – Taxonomy Tags - Expert assigned / objective [e.g. file format; publisher]
Navigation/Exploration: Search, filter, sort, Bread Crumbs to taxonomy/site map
Implement
Data.gov has most of this (needs ERDs, bread crumbs beyond publishing org); expand and extend
Where not be possible in specific sites via security / privacy, consider in meta sites (data.gov, etc.)
Review / Add / Enforce individually via requirements of vendors via budget/delivery cycles –
(copy specs from data.gov)](https://image.slidesharecdn.com/nchvsdataaccessanduserosenthalwithappendix02-160407195351/85/NCVHS-Data-Access-and-Use-Joshua-Rosenthal-8-320.jpg)
![10
SYSTEMS & PRACTICES
Structure
Ecosystem Interaction
How does someone find a site / delivery mechanism
or information within a site / delivery mechanism
via another channel?
UI / UX
[User Interaction / User Experience]
How does someone use and experience
a site / delivery mechanism?
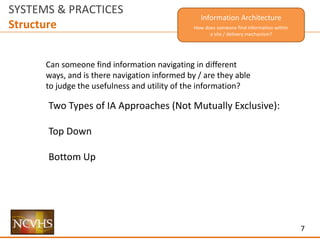
Information Architecture
How does someone find information within
a site / delivery mechanism?
Data
How useful and usable is the data within
a site / delivery system?](https://image.slidesharecdn.com/nchvsdataaccessanduserosenthalwithappendix02-160407195351/85/NCVHS-Data-Access-and-Use-Joshua-Rosenthal-10-320.jpg)
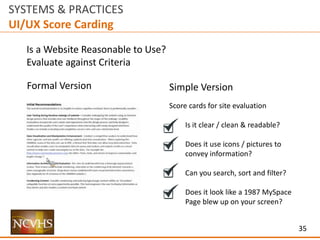
![11
SYSTEMS & PRACTICES
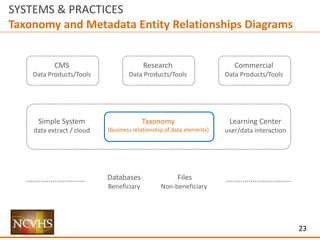
Structure
UI / UX
[User Interaction / User Experience]
How does someone use and experience
a site / delivery mechanism?
User Interaction / User Experience
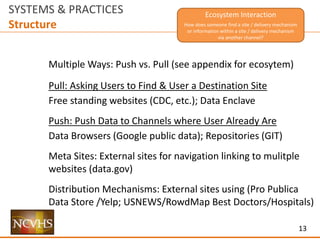
Two Types of Approaches (Not Mutually Exclusive):
Score Carding (See Appendix for example)
Work from checklist, score instance and offer improvements
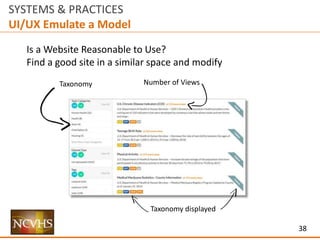
Emulate Model (See Appendix for example
Work from example of what already works within a similar context and modify
UI / UX
[User Interaction / User Experience]
How does someone use and experience
a site / delivery mechanism?
Implement
Copy data.gov as model for individual HHS sites/instances; modify based on constraints of individual
instance; expand, extend and improve based on users, goals and priorities of instance.
Review / Add / Enforce individually via requirements of vendors via budget/delivery cycles](https://image.slidesharecdn.com/nchvsdataaccessanduserosenthalwithappendix02-160407195351/85/NCVHS-Data-Access-and-Use-Joshua-Rosenthal-11-320.jpg)
![12
SYSTEMS & PRACTICES
Structure
Ecosystem Interaction
How does someone find a site / delivery mechanism
or information within a site / delivery mechanism
via another channel?
UI / UX
[User Interaction / User Experience]
How does someone use and experience
a site / delivery mechanism?
Information Architecture
How does someone find information within
a site / delivery mechanism?
Data
How useful and usable is the data within
a site / delivery system?](https://image.slidesharecdn.com/nchvsdataaccessanduserosenthalwithappendix02-160407195351/85/NCVHS-Data-Access-and-Use-Joshua-Rosenthal-12-320.jpg)
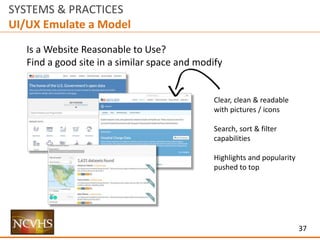
![28
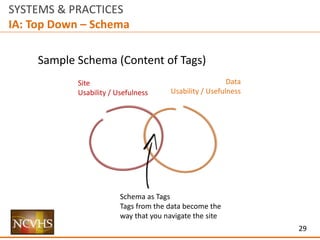
SYSTEMS & PRACTICES
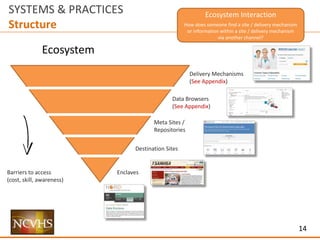
IA: Top Down – Schema
Sample Schema (Content of Tags)
File format
JSON
XML
PDF
Etc.
Geographic grain
Country
State
County
PUMA
HRR
HSA
Zip
Neighborhood Block
Etc.
Dates
[Range]
Dates Frequency
Topic
Agency
Producer
Etc.
Etc.](https://image.slidesharecdn.com/nchvsdataaccessanduserosenthalwithappendix02-160407195351/85/NCVHS-Data-Access-and-Use-Joshua-Rosenthal-28-320.jpg)


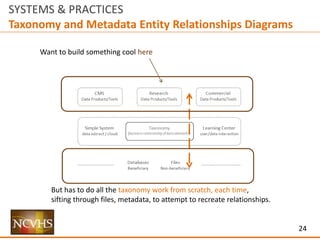
The document outlines frameworks for improving data access and usability within health systems, focusing on user interaction, information architecture, and data management. It discusses various approaches to structuring data presentation, including top-down and bottom-up methodologies, to facilitate better user experience and engagement. Additionally, it emphasizes the importance of publishing metadata and entity relationship diagrams to enhance data understanding and usability for different user communities.


