Downloaded 38 times
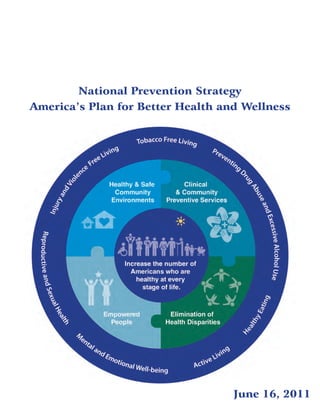
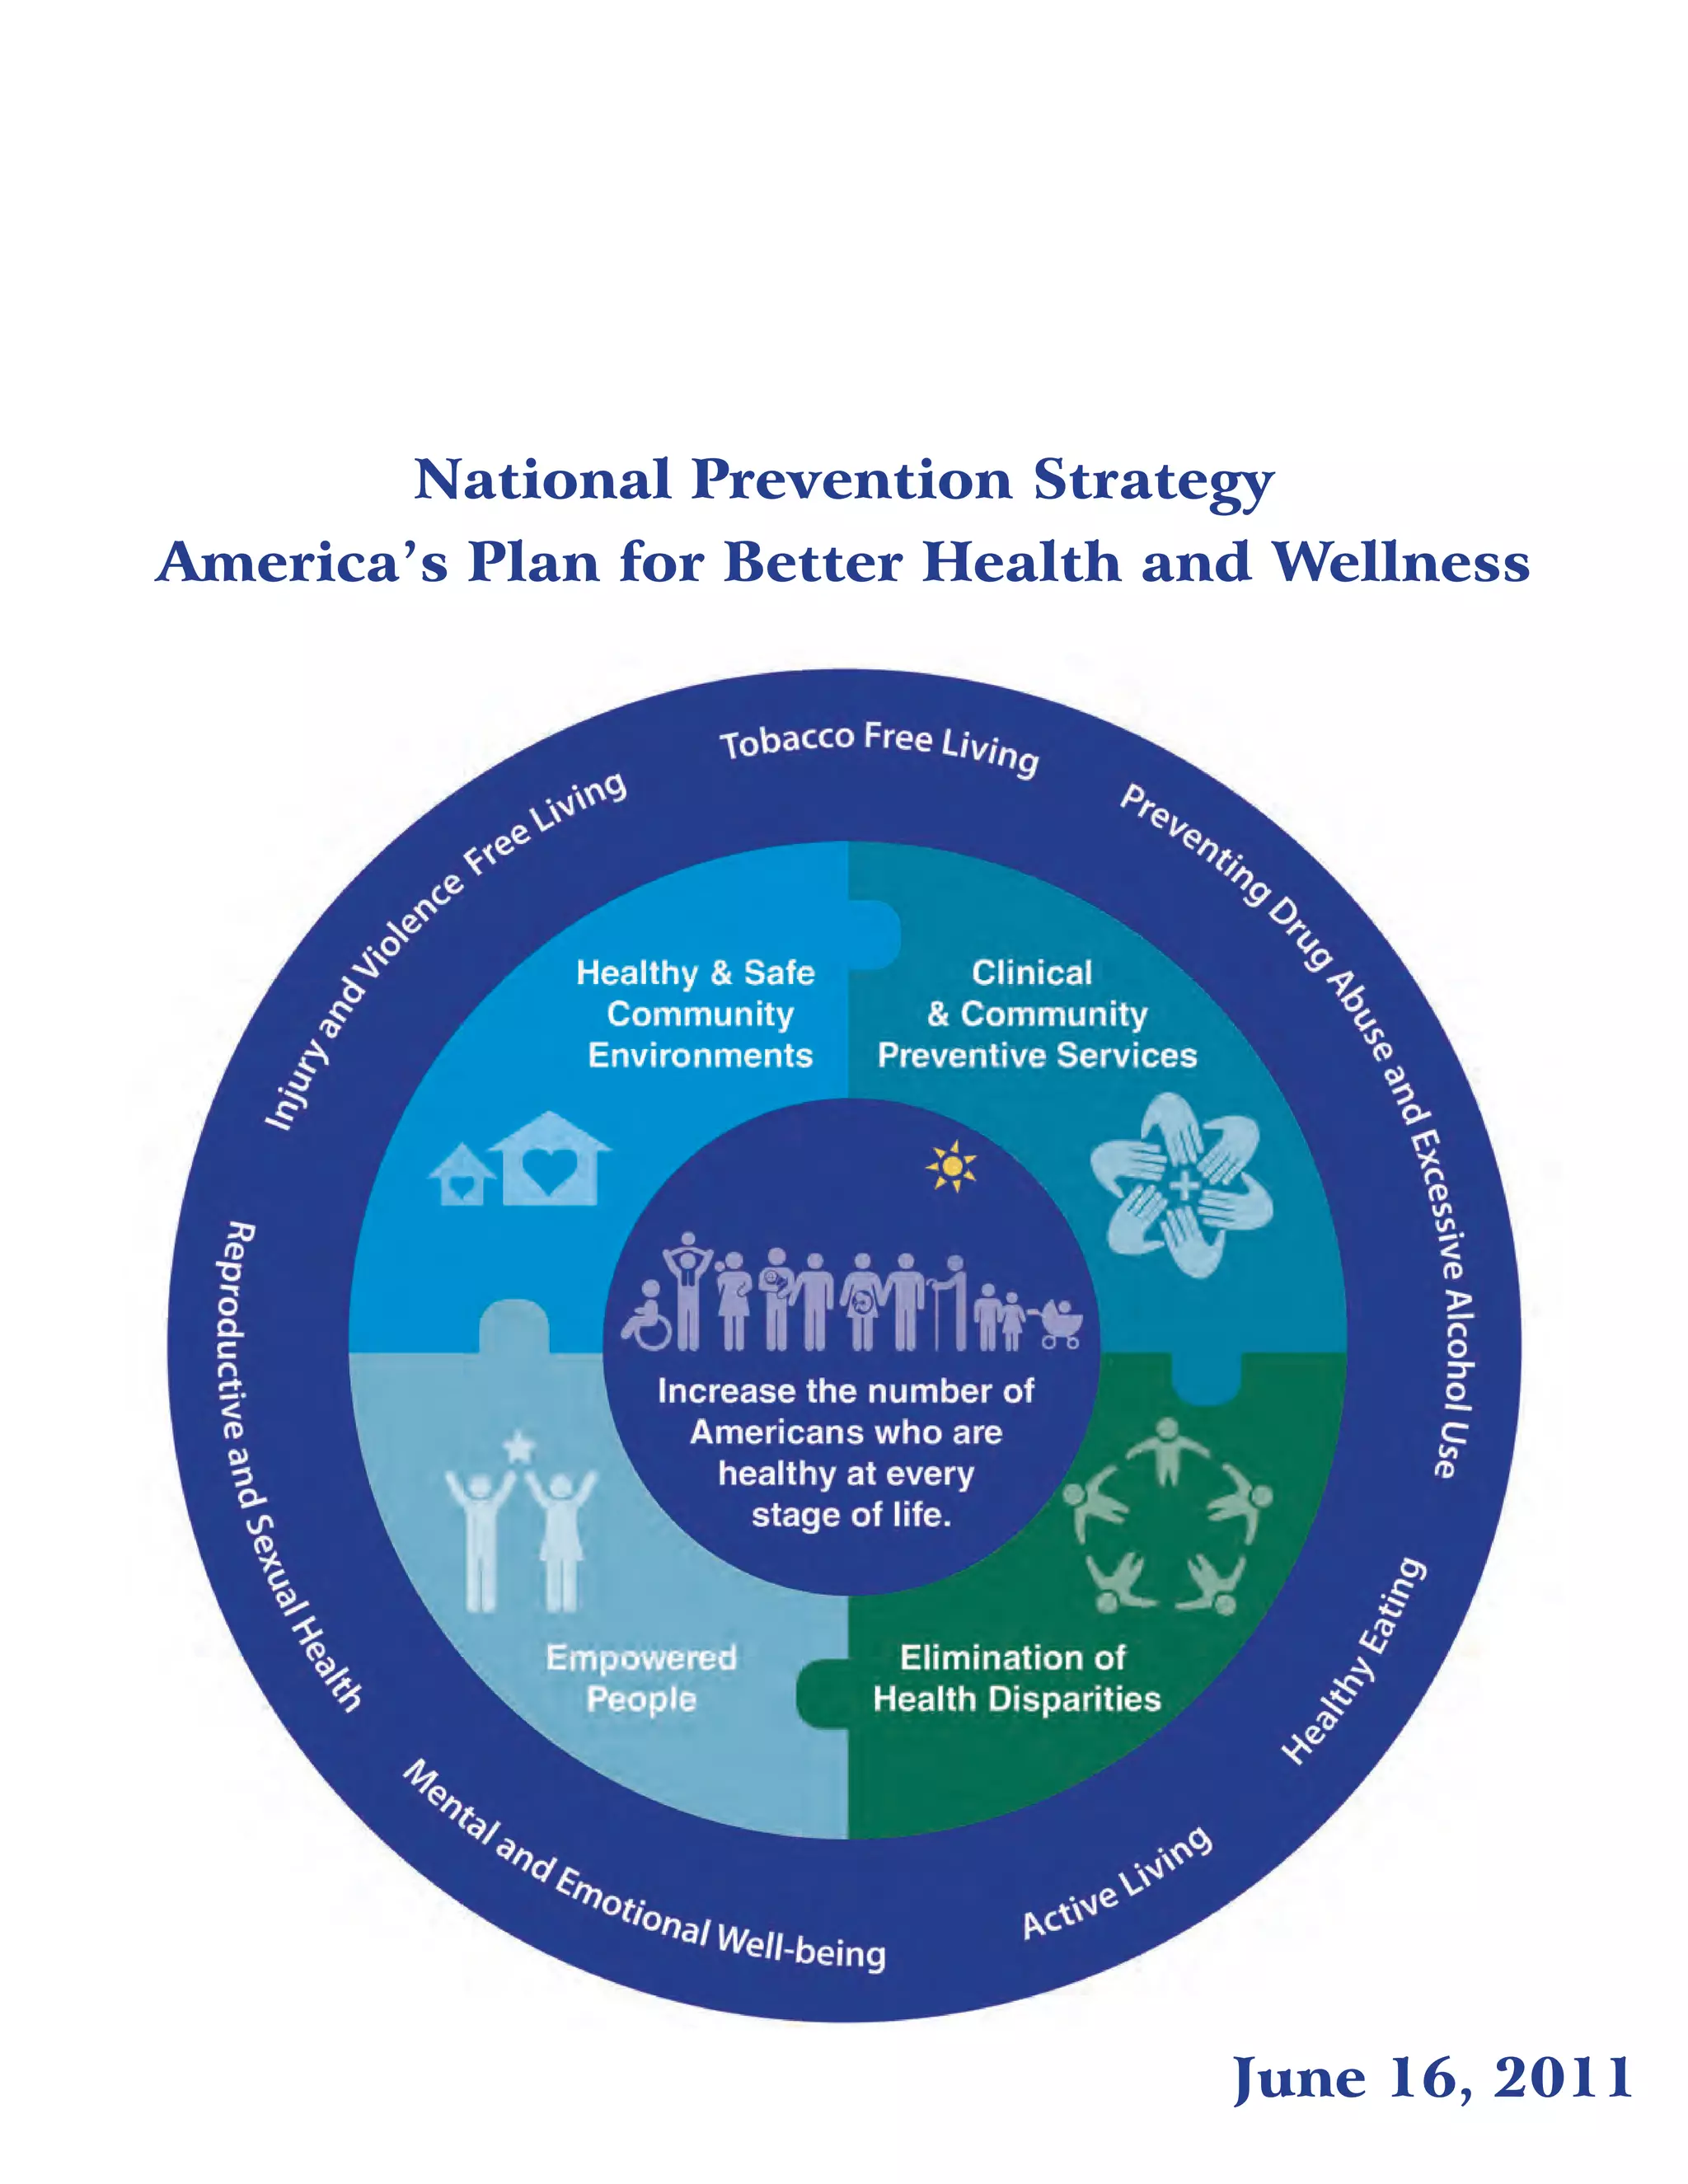


The National Prevention Strategy aims to improve Americans' health through a focus on prevention. It identifies 4 strategic directions and 7 priorities to guide national prevention efforts. The strategic directions include creating healthy community environments, expanding preventive services, empowering individuals, and eliminating health disparities. Key priorities address issues like tobacco use, substance abuse, nutrition, physical activity, injury/violence prevention, sexual health and mental wellness. The National Prevention Council will provide leadership and coordinate federal efforts. Success requires engaging partners across all sectors of society to implement prevention strategies at all levels. Progress will be tracked through an annual report.


