Download to read offline


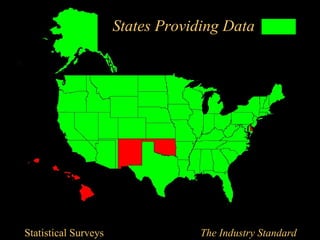
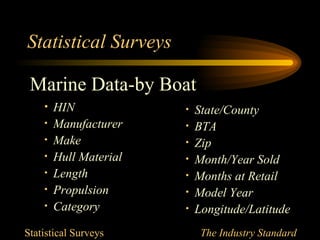

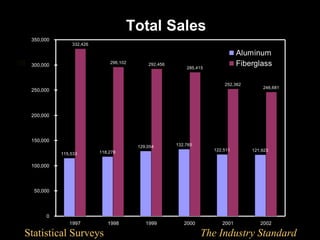
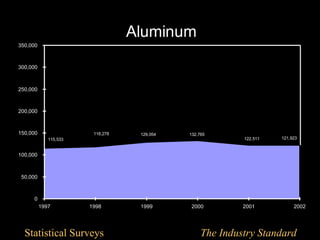
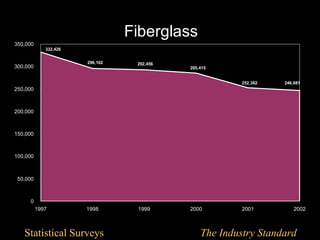
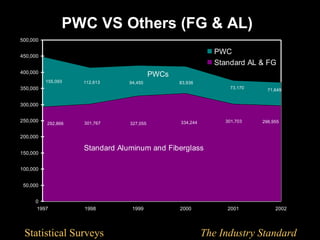
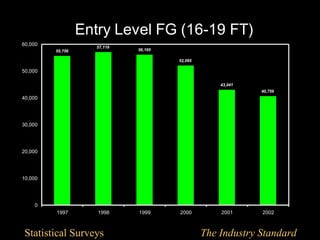

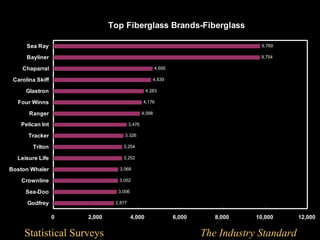
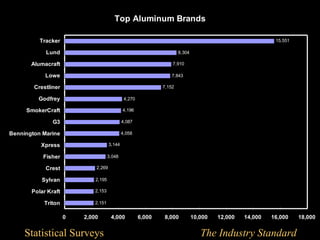
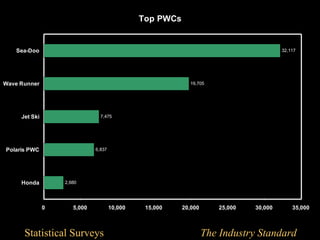


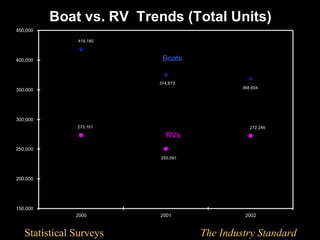


Statistical Surveys is a company founded in 1957 that provides data and analytics on the marine, manufactured housing, recreational vehicle, and associated industries. It collects and cleans data from manufacturer production records, warranty records, websites, and its own database to provide dependable industry statistics and trends. It serves leading manufacturers and industry associations in these sectors. The document provides various charts and data on units sold, material trends, popular brands, and comparisons between boats and recreational vehicles.


