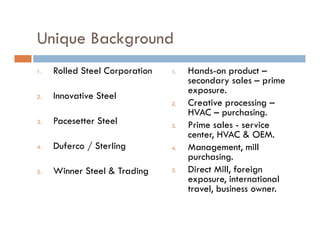
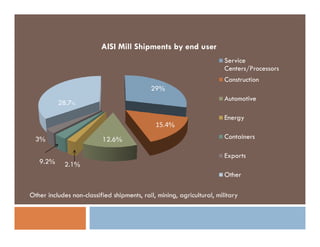
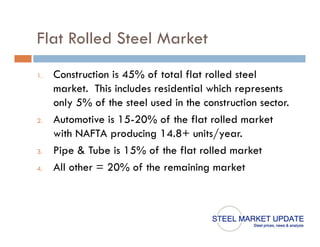
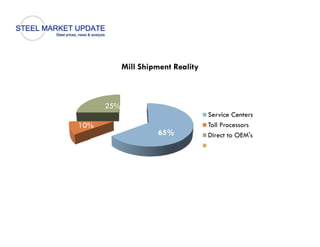
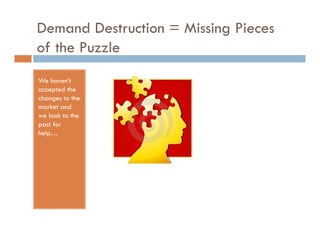
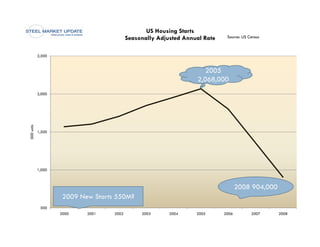
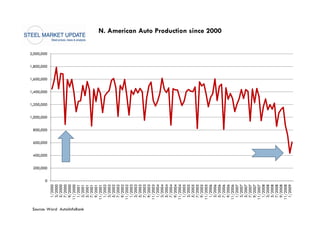
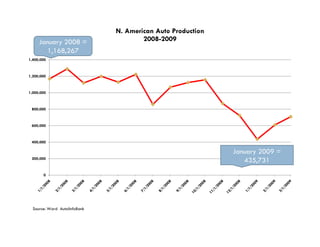
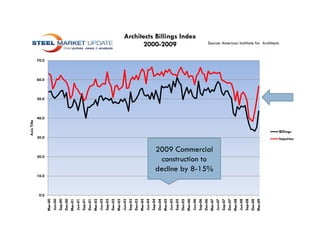
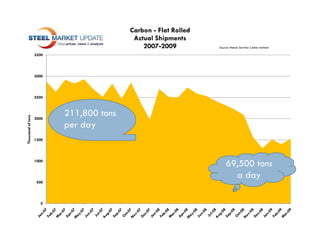
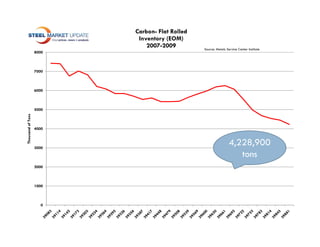
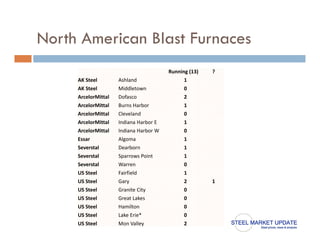
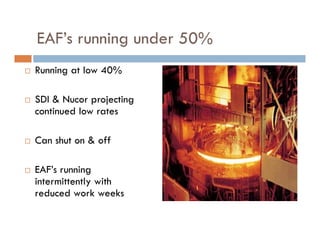
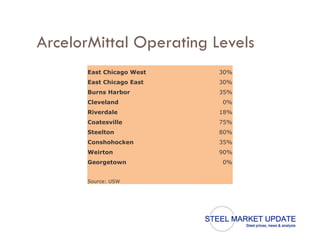
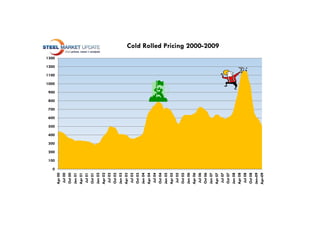
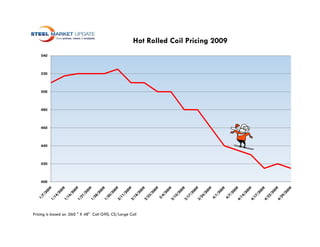
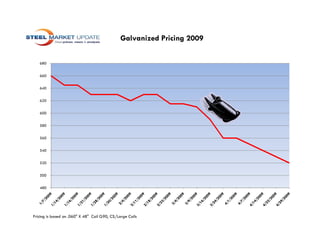
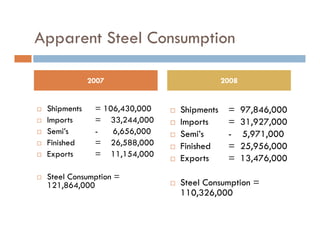
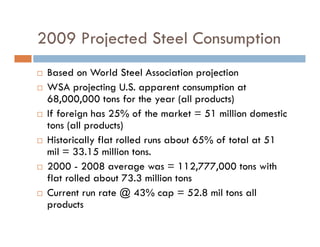
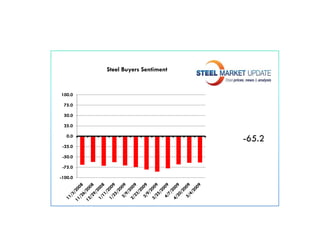
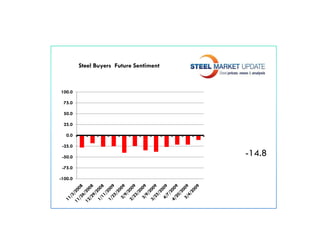
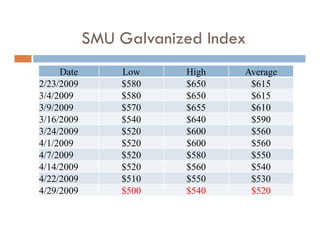
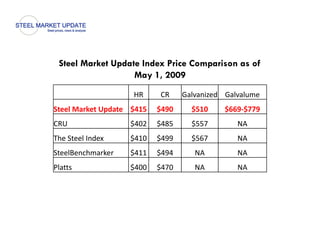
INSTITUTE FOR SUPPLY
MANAGEMENT STEEL FORUM
MAY 5, 2009
John Packard – Steel Market Update
Who is John Packard?


  Why is he here?


 What’s in it for me?
You know what? I think
  I’ll go into the steel
         business
WHO IS JOHN PACKARD?
And what happened to his hair…?
Rolled Steel
                              (1977)

     Novosteel /                                   Innovative
       PN Ent                                     Steel (1980)
       (2003)


Winner St l
Wi     Steel                                            Pacesetter
                                                        P     tt
   (1997)                                                 (1982)


               Pacesetter                  Duferco /
                (1994)                      Sterling
                                            (1991)
Unique Background
   q       g
1.   Rolled Steel Corporation   1.   Hands-on product –
                                     secondary sales – prime
                                     exposure.
2.   Innovative Steel
                                2.   Creative processing –
                                     HVAC – purchasing.
3.   Pacesetter Steel           3.   Prime sales - service
                                     center, HVAC & OEM.
                                           ,
4.   Duferco / Sterling         4.   Management, mill
                                     purchasing.
5.
5    Winner Steel & Trading     5.
                                5    Direct Mill, foreign
                                             Mill
                                     exposure, international
                                     travel, business owner.
August 2008
STEEL MARKET UPDATE
STEEL MARKET UPDATE                                              www.steelmarketupdate.com
                                                                 www steelmarketupdate com


Welcome John Packard                                                              Volume 4, #52


                                Monday, May 4, 2009
IN THIS ISSUE:
ArcelorMittal Warns of Need to Shutter Capacity in U.S. Market
ISM Index Improves to 40.1
Inventory Write-Downs Hurt California Steel & Olympic Steel
March Raw Steel Production
Quick Note on China Market
U.S. Auto Sales Worse than Expected
Chrysler Bankruptcy Facts
NYMEX Hot Rolled Futures Contracts
What to Watch this Week
Final Thoughts
WHY AM I HERE?
Student of the steel business
AISI Mill Shipments by end user
                                                                        Service
                                                                        Centers/Processors
                                                                        Construction
                                            29%
                                                                        Automotive
          28.7%

                                                                        Energy
                                              15.4%
  3%                      12.6%
                          12 6%                                         Containers

                                                                        Exports
   9.2%     2.1%
                                                                        Other

Other includes non-classified shipments, rail, mining, agricultural, military
Flat Rolled Steel Market
1.
1    Construction is 45% of total flat rolled steel
     market. This includes residential which represents
     only 5% of the steel used in the construction sector.
        y
2.   Automotive is 15-20% of the flat rolled market
     with NAFTA producing 14.8+ units/year.
                  p       g              /y
3.   Pipe & Tube is 15% of the flat rolled market
4.   All other = 20% of the remaining market
Mill Shipment Reality


      25%
                                    Service Centers
10%                                 Toll Processors
                     65%            Direct to OEM's
“MAY YOU LIVE IN INTERESTING
TIMES”


      Chinese Curse
Demand Destruction = Missing Pieces
of the P le
       Puzzle
We haven’t
accepted the
changes to the
market and
we look to the
past for
help…
US Housing Starts
                                           Seasonally Adjusted Annual Rate    Source: US Census


            2,500


                                                                     2005
                                                                   2,068,000
                                                                      6
            2,000
000 units


            1,500
0


            1,000
            1 000


                                                                                    2008 904,000
                     2009 New Starts 550M?
             500
                    2000    2001    2002        2003      2004     2005      2006         2007     2008
0
                                           200,000
                                                     400,000
                                                               600,000
                                                                         800,000
                                                                                   1,000,000
                                                                                               1,200,000
                                                                                                           1,400,000
                                                                                                                       1,600,000
                                                                                                                                   1,800,000
                              1/2000                                                                                                           2,000,000
                              3/2000
                              5/2000
                              7/2000
                              9/2000
                             11/2000
                              1/2001


Source: Ward AutoiInfoBank
                              3/2001
                              5/2001
                              7/2001
                              9/2001
                             11/2001
                              1/2002
                              3/2002
                              5/2002
                              7/2002
                              9/2002
                             11/2002
                              1/2003
                              3/2003
                              5/2003
                              7/2003
                              9/2003
                             11/2003
                              1/2004
                              3/2004
                              5/2004
                              7/2004
                              9/2004
                             11/2004
                              1/2005
                              3/2005
                              5/2005
                              7/2005
                              9/2005
                             11/2005
                              1/2006
                              3/2006
                                                                                                                                                           N. American Auto Production since 2000


                              5/2006
                              7/2006
                              9/2006
                             11/2006
                              1/2007
                              3/2007
                              5/2007
                              7/2007
                              9/2007
                             11/2007
                              1/2008
                              3/2008
                              5/2008
                              7/2008
                              9/2008
                             11/2008
                              1/2009
N. American Auto Production
     January 2008 =                    2008-2009
        1,168,267
1,400,000


1,200,000
1 200 000


1,000,000


 800,000
 800 000


 600,000


 400,000

                                                             January 2009 =
 200,000
                                                                435,731
       0


  Source: Ward AutoiInfoBank
Axis Title


         0.0
               10.0
                              20.0
                                            30.0
                                                                  40.0
                                                                         50.0
                                                                                60.0
                                                                                       70.0
Mar-0
    00
Jun-0
    00
Sep-0
    00
Dec-0
    00
Mar-0
    01
Jun-0
    01
Sep-0
    01
Dec-0
    01
Mar-0
    02
Jun-0
    02
Sep-0
    02
Dec-0
    02
Mar-0
    03
Jun-0
    03
Sep-0
    03
Dec-0
    03
Mar-0
    04
Jun-0
    04
Sep-0
    04
Dec-0
    04
Mar-0
    05
Jun-0
    05
                                                                                                    2000 2009
                                                                                                    2000-2009


Sep-0
    05
Dec-0
    05
Mar-0
    06
                                                                                              Architects Billings Index


Jun-0
    06
Sep-0
    06
                        construction to


Dec-0
    06
                      2009 Commercial

                      decline by 8-15%
                                  8 15%


Mar-0
    07
Jun-0
    07
Sep-0
    07
Dec-0
    07
Mar-0
    08
Jun-0
    08
Sep-0
    08
Dec-0
    08
Mar-0
    09
                                                                                                  Source: American Insititute for Architects


                                                       Billings
                                          Inquiries
Carbon - Flat Rolled
                                          Actual Shipments
                                             2007-2009
                                             2007 2009          Source: Metals Serviice Center Institute

                   3500


                   3000


                   2500


                          211,800 tons
  ousand of tons


                   2000
                          per day
Tho


                   1500


                   1000
                                                                     69,500 tons
                                                                       a day
                    500


                      0
Carbon- Flat Rolled
                           Inventory (EOM)
                              2007-2009
                              2007 2009         Source: Metals Service Center Institute
                   8000


                   7000


                   6000


                   5000
  ousand of Tons


                   4000


                                                                 4,228,900
                                                                   228 900
Tho


                   3000
                                                                    tons
                   2000


                   1000


                      0
IN RESPONSE - U S MILLS ARE
              U.S.
TAKING OUT CAPACITY
Whether they want to or not…
North American Blast Furnaces
                                        Running (13)   ?
     AK Steel        Ashland                  1
     AK Steel        Middletown               0
     ArcelorMittal   Dofasco                  2
     ArcelorMittal   Burns Harbor             1
     ArcelorMittal   Cleveland                0
     ArcelorMittal   Indiana Harbor E         1
     ArcelorMittal   Indiana Harbor W         0
     Essar 
     Essar           Algoma                   1
     Severstal       Dearborn                 1
     Severstal       Sparrows Point           1
     Severstal       Warren                   0
     US Steel        Fairfield                1
     US Steel        Gary                     2        1
     US Steel        Granite City             0
     US Steel        Great Lakes              0
     US Steel        Hamilton                 0
     US Steel        Lake Erie*               0
     US Steel        Mon Valley               2
EAF’s running under 50%
                g
   Running at low 40%

   SDI & Nucor projecting
    continued l rates
        i d low

   Can h t
    C shut on & off
                 ff

   EAF s
    EAF’s running
    intermittently with
    reduced work weeks
ArcelorMittal Operating Levels
       East Chicago West   30%
       East Chicago East   30%
       Burns Harbor        35%
       Cleveland           0%
       Riverdale           18%
       Coatesville         75%
       Steelton            80%
       Conshohocken        35%
       Weirton             90%
       Georgetown          0%


       Source: USW
WHAT GETS LOST IS PRICE
DISCIPLINE…
Can the U.S. mills turn back the tide?
0
              100
                    200
                          300
                                400
                                      500
                                            600
                                                  700
                                                        800
                                                              900
                                                                    1000
                                                                           1100
                                                                                  1200
Apr 00                                                                                   1300
 Jul 00
Oct 00
Jan 01
Apr 01
 Jul 01
Oct 01
Jan 02
Apr 02
 Jul 02
Oct 02
Jan 03
Apr 03
 Jul 03
Oct 03
Jan 04
Apr 04
 Jul 04
Oct 04
Jan 05
Apr 05
 Jul 05
Oct 05
Jan 06
Apr 06
 Jul 06
Oct 06
Jan 07
Apr 07
                                                                                                Cold Rolled Pricing 2000 2009
                                                                                                                    2000-2009


 Jul 07
Oct 07
Jan 08
Apr 08
 Jul 08
Oct 08
Jan-09
Apr-09
Hot Rolled Coil Pricing 2009
    540


    520


    500


    480


    460


    440


    420


    400


Pricing is based on .060 " X 48" Coil G90, CS/Large Coil
Galvanized Pricing 2009

   680


   660


   640


   620


   600


   580


   560


   540


   520


   500


   480


Pricing is based on .060" X 48" Coil G90, CS/Large Coils
We’re Trying to Figure “it” Out
        y g       g

Business has
changed!

Where are
we now and
where do we
go from here?
Apparent Steel Consumption
 pp                  p

                2007                              2008


   Shipments    = 106 430 000
                   106,430,000      Shipments
                                     Shi      t    =     97,846,000
                                                         97 846 000
   Imports      = 33,244,000       Imports       =     31,927,000
   Semi’s       -   6,656,000      Semi’s        -     5,971,000
   Finished     = 26,588,000       Finished      =     25,956,000
   Exports      = 11,154,000
                                    Exports       =     13,476,000
   Steel Consumption =
    121,864,000                     Steel Consumption =
                                     110,326,000
2009 Projected Steel Consumption
        j                  p
   Based on World Steel Association projection
                                         p j
   WSA projecting U.S. apparent consumption at
    68,000,000 tons for the year (all products)
   If foreign has 25% of the market = 51 million domestic
    tons (all products)
   Historically flat rolled runs about 65% of total at 51
    mil = 33.15 million tons.
   2000 - 2008 average was = 112,777,000 tons with
                           g             ,   ,
    flat rolled about 73.3 million tons
   Current run rate @ 43% cap = 52.8 mil tons all
    products
        d
WHAT DO I DO – AND
WHAT’S IN IT FOR YOU?
    Sentiment, Momentum, Real Time Pricing
          Relevant News & Analysis
it


               News
               N

              Prices


           Trends
Momentum       Missing
                info
Steel Buyers Sentiment


100.0

 75.0

 50.0

 25.0

   0.0
                                  -65.2
                                  -65 2
 -25.0

 -50.0

 -75.0

-100.0
Steel Buyers Future Sentiment


100.0

 75.0

 50.0

 25.0

   0.0

 -25.0

 -50.0
                                         -14.8
 -75.0

-100.0
Price Momentum
SMU Galvanized Index
     Date       Low     High
                          g    Average
                                    g
2/23/2009       $580    $650    $615
3/4/2009        $580    $650    $615
3/9/2009        $570    $655    $610
3/16/2009       $540    $640    $590
3/24/2009       $520    $600    $560
4/1/2009        $520    $600    $560
4/7/2009        $520    $580    $550
4/14/2009
 / / 9          $
                $520    $
                        $560    $
                                $540
4/22/2009       $510    $550    $530
4/29/2009       $500    $540    $520
Steel Market Update Index Price Comparison as of
                   May 1, 2009
                     HR      CR     Galvanized Galvalume
Steel Market Update $415 
Steel Market Update $415    $490 
                            $490      $510 
                                      $510     $669‐$779
                                               $669 $779
CRU                 $402    $485      $557        NA
The Steel Index
The Steel Index     $410 
                    $410    $499 
                            $499      $567 
                                      $567        NA
SteelBenchmarker    $411    $494       NA         NA
Platts              $
                    $400    $
                            $470       NA         NA
Steel Price Calculator


  Hot Rolled, Cold
  Rolled,
  Rolled Galvanized &
  Galvalume


   Based on SMU
   Average Prime Spot
   Price Indexes
Some Keys to Watch
                   y
   MSCI – carbon flat rolled under 2.5 mos
   Mill capacity utilization at, or above, 60%
   Reduction in initial jobless claims
                         j
   AIA Billings Index over 50.0
   Oil over $60 barrel
              $
   SMU Buyers Sentiment in + territory
   SMU Market Momentum
   SMU Price Indexes stable and then moving higher
   Housing inventory and foreclosures decreasing
           g          y                         g

                                   Read my newsletter….
Thank You for your time as it is truly appreciated

Ism Presentation

  • 2.
    INSTITUTE FOR SUPPLY MANAGEMENTSTEEL FORUM MAY 5, 2009 John Packard – Steel Market Update
  • 3.
    Who is JohnPackard? Why is he here? What’s in it for me?
  • 4.
    You know what?I think I’ll go into the steel business
  • 5.
    WHO IS JOHNPACKARD? And what happened to his hair…?
  • 6.
    Rolled Steel (1977) Novosteel / Innovative PN Ent Steel (1980) (2003) Winner St l Wi Steel Pacesetter P tt (1997) (1982) Pacesetter Duferco / (1994) Sterling (1991)
  • 7.
    Unique Background q g 1. Rolled Steel Corporation 1. Hands-on product – secondary sales – prime exposure. 2. Innovative Steel 2. Creative processing – HVAC – purchasing. 3. Pacesetter Steel 3. Prime sales - service center, HVAC & OEM. , 4. Duferco / Sterling 4. Management, mill purchasing. 5. 5 Winner Steel & Trading 5. 5 Direct Mill, foreign Mill exposure, international travel, business owner.
  • 8.
  • 9.
    STEEL MARKET UPDATE STEEL MARKET UPDATE www.steelmarketupdate.com www steelmarketupdate com Welcome John Packard Volume 4, #52 Monday, May 4, 2009 IN THIS ISSUE: ArcelorMittal Warns of Need to Shutter Capacity in U.S. Market ISM Index Improves to 40.1 Inventory Write-Downs Hurt California Steel & Olympic Steel March Raw Steel Production Quick Note on China Market U.S. Auto Sales Worse than Expected Chrysler Bankruptcy Facts NYMEX Hot Rolled Futures Contracts What to Watch this Week Final Thoughts
  • 10.
    WHY AM IHERE? Student of the steel business
  • 11.
    AISI Mill Shipmentsby end user Service Centers/Processors Construction 29% Automotive 28.7% Energy 15.4% 3% 12.6% 12 6% Containers Exports 9.2% 2.1% Other Other includes non-classified shipments, rail, mining, agricultural, military
  • 12.
    Flat Rolled SteelMarket 1. 1 Construction is 45% of total flat rolled steel market. This includes residential which represents only 5% of the steel used in the construction sector. y 2. Automotive is 15-20% of the flat rolled market with NAFTA producing 14.8+ units/year. p g /y 3. Pipe & Tube is 15% of the flat rolled market 4. All other = 20% of the remaining market
  • 13.
    Mill Shipment Reality 25% Service Centers 10% Toll Processors 65% Direct to OEM's
  • 14.
    “MAY YOU LIVEIN INTERESTING TIMES” Chinese Curse
  • 15.
    Demand Destruction =Missing Pieces of the P le Puzzle We haven’t accepted the changes to the market and we look to the past for help…
  • 16.
    US Housing Starts Seasonally Adjusted Annual Rate Source: US Census 2,500 2005 2,068,000 6 2,000 000 units 1,500 0 1,000 1 000 2008 904,000 2009 New Starts 550M? 500 2000 2001 2002 2003 2004 2005 2006 2007 2008
  • 17.
    0 200,000 400,000 600,000 800,000 1,000,000 1,200,000 1,400,000 1,600,000 1,800,000 1/2000 2,000,000 3/2000 5/2000 7/2000 9/2000 11/2000 1/2001 Source: Ward AutoiInfoBank 3/2001 5/2001 7/2001 9/2001 11/2001 1/2002 3/2002 5/2002 7/2002 9/2002 11/2002 1/2003 3/2003 5/2003 7/2003 9/2003 11/2003 1/2004 3/2004 5/2004 7/2004 9/2004 11/2004 1/2005 3/2005 5/2005 7/2005 9/2005 11/2005 1/2006 3/2006 N. American Auto Production since 2000 5/2006 7/2006 9/2006 11/2006 1/2007 3/2007 5/2007 7/2007 9/2007 11/2007 1/2008 3/2008 5/2008 7/2008 9/2008 11/2008 1/2009
  • 18.
    N. American AutoProduction January 2008 = 2008-2009 1,168,267 1,400,000 1,200,000 1 200 000 1,000,000 800,000 800 000 600,000 400,000 January 2009 = 200,000 435,731 0 Source: Ward AutoiInfoBank
  • 19.
    Axis Title 0.0 10.0 20.0 30.0 40.0 50.0 60.0 70.0 Mar-0 00 Jun-0 00 Sep-0 00 Dec-0 00 Mar-0 01 Jun-0 01 Sep-0 01 Dec-0 01 Mar-0 02 Jun-0 02 Sep-0 02 Dec-0 02 Mar-0 03 Jun-0 03 Sep-0 03 Dec-0 03 Mar-0 04 Jun-0 04 Sep-0 04 Dec-0 04 Mar-0 05 Jun-0 05 2000 2009 2000-2009 Sep-0 05 Dec-0 05 Mar-0 06 Architects Billings Index Jun-0 06 Sep-0 06 construction to Dec-0 06 2009 Commercial decline by 8-15% 8 15% Mar-0 07 Jun-0 07 Sep-0 07 Dec-0 07 Mar-0 08 Jun-0 08 Sep-0 08 Dec-0 08 Mar-0 09 Source: American Insititute for Architects Billings Inquiries
  • 20.
    Carbon - FlatRolled Actual Shipments 2007-2009 2007 2009 Source: Metals Serviice Center Institute 3500 3000 2500 211,800 tons ousand of tons 2000 per day Tho 1500 1000 69,500 tons a day 500 0
  • 21.
    Carbon- Flat Rolled Inventory (EOM) 2007-2009 2007 2009 Source: Metals Service Center Institute 8000 7000 6000 5000 ousand of Tons 4000 4,228,900 228 900 Tho 3000 tons 2000 1000 0
  • 22.
    IN RESPONSE -U S MILLS ARE U.S. TAKING OUT CAPACITY Whether they want to or not…
  • 23.
    North American BlastFurnaces Running (13) ? AK Steel Ashland 1 AK Steel Middletown 0 ArcelorMittal Dofasco 2 ArcelorMittal Burns Harbor 1 ArcelorMittal Cleveland 0 ArcelorMittal Indiana Harbor E 1 ArcelorMittal Indiana Harbor W 0 Essar  Essar Algoma 1 Severstal Dearborn 1 Severstal Sparrows Point 1 Severstal Warren 0 US Steel Fairfield 1 US Steel Gary 2 1 US Steel Granite City 0 US Steel Great Lakes 0 US Steel Hamilton 0 US Steel Lake Erie* 0 US Steel Mon Valley 2
  • 24.
    EAF’s running under50% g  Running at low 40%  SDI & Nucor projecting continued l rates i d low  Can h t C shut on & off ff  EAF s EAF’s running intermittently with reduced work weeks
  • 25.
    ArcelorMittal Operating Levels East Chicago West 30% East Chicago East 30% Burns Harbor 35% Cleveland 0% Riverdale 18% Coatesville 75% Steelton 80% Conshohocken 35% Weirton 90% Georgetown 0% Source: USW
  • 26.
    WHAT GETS LOSTIS PRICE DISCIPLINE… Can the U.S. mills turn back the tide?
  • 27.
    0 100 200 300 400 500 600 700 800 900 1000 1100 1200 Apr 00 1300 Jul 00 Oct 00 Jan 01 Apr 01 Jul 01 Oct 01 Jan 02 Apr 02 Jul 02 Oct 02 Jan 03 Apr 03 Jul 03 Oct 03 Jan 04 Apr 04 Jul 04 Oct 04 Jan 05 Apr 05 Jul 05 Oct 05 Jan 06 Apr 06 Jul 06 Oct 06 Jan 07 Apr 07 Cold Rolled Pricing 2000 2009 2000-2009 Jul 07 Oct 07 Jan 08 Apr 08 Jul 08 Oct 08 Jan-09 Apr-09
  • 28.
    Hot Rolled CoilPricing 2009 540 520 500 480 460 440 420 400 Pricing is based on .060 " X 48" Coil G90, CS/Large Coil
  • 29.
    Galvanized Pricing 2009 680 660 640 620 600 580 560 540 520 500 480 Pricing is based on .060" X 48" Coil G90, CS/Large Coils
  • 30.
    We’re Trying toFigure “it” Out y g g Business has changed! Where are we now and where do we go from here?
  • 31.
    Apparent Steel Consumption pp p 2007 2008  Shipments = 106 430 000 106,430,000  Shipments Shi t = 97,846,000 97 846 000  Imports = 33,244,000  Imports = 31,927,000  Semi’s - 6,656,000  Semi’s - 5,971,000  Finished = 26,588,000  Finished = 25,956,000  Exports = 11,154,000  Exports = 13,476,000  Steel Consumption = 121,864,000  Steel Consumption = 110,326,000
  • 32.
    2009 Projected SteelConsumption j p  Based on World Steel Association projection p j  WSA projecting U.S. apparent consumption at 68,000,000 tons for the year (all products)  If foreign has 25% of the market = 51 million domestic tons (all products)  Historically flat rolled runs about 65% of total at 51 mil = 33.15 million tons.  2000 - 2008 average was = 112,777,000 tons with g , , flat rolled about 73.3 million tons  Current run rate @ 43% cap = 52.8 mil tons all products d
  • 33.
    WHAT DO IDO – AND WHAT’S IN IT FOR YOU? Sentiment, Momentum, Real Time Pricing Relevant News & Analysis
  • 34.
    it News N Prices Trends Momentum Missing info
  • 35.
    Steel Buyers Sentiment 100.0 75.0 50.0 25.0 0.0 -65.2 -65 2 -25.0 -50.0 -75.0 -100.0
  • 36.
    Steel Buyers FutureSentiment 100.0 75.0 50.0 25.0 0.0 -25.0 -50.0 -14.8 -75.0 -100.0
  • 37.
  • 38.
    SMU Galvanized Index Date Low High g Average g 2/23/2009 $580 $650 $615 3/4/2009 $580 $650 $615 3/9/2009 $570 $655 $610 3/16/2009 $540 $640 $590 3/24/2009 $520 $600 $560 4/1/2009 $520 $600 $560 4/7/2009 $520 $580 $550 4/14/2009 / / 9 $ $520 $ $560 $ $540 4/22/2009 $510 $550 $530 4/29/2009 $500 $540 $520
  • 39.
    Steel Market UpdateIndex Price Comparison as of May 1, 2009 HR CR Galvanized Galvalume Steel Market Update $415  Steel Market Update $415 $490  $490 $510  $510 $669‐$779 $669 $779 CRU $402  $485  $557  NA The Steel Index The Steel Index $410  $410 $499  $499 $567  $567 NA SteelBenchmarker $411  $494  NA NA Platts $ $400  $ $470  NA NA
  • 40.
    Steel Price Calculator Hot Rolled, Cold Rolled, Rolled Galvanized & Galvalume Based on SMU Average Prime Spot Price Indexes
  • 42.
    Some Keys toWatch y  MSCI – carbon flat rolled under 2.5 mos  Mill capacity utilization at, or above, 60%  Reduction in initial jobless claims j  AIA Billings Index over 50.0  Oil over $60 barrel $  SMU Buyers Sentiment in + territory  SMU Market Momentum  SMU Price Indexes stable and then moving higher  Housing inventory and foreclosures decreasing g y g Read my newsletter….
  • 43.
    Thank You foryour time as it is truly appreciated