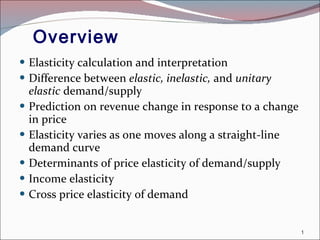
1. Elasticity is a measure of how responsive quantity is to price changes. It compares percentage changes in quantity and price.
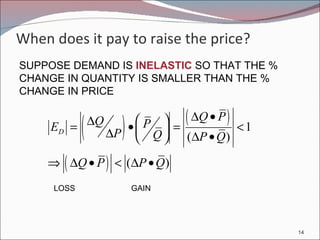
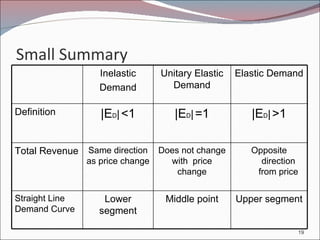
2. Demand can be inelastic (|ED| < 1), unitary (|ED| = 1), or elastic (|ED| > 1). Inelastic demand leads to higher total revenue from a price rise.
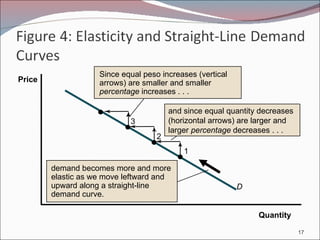
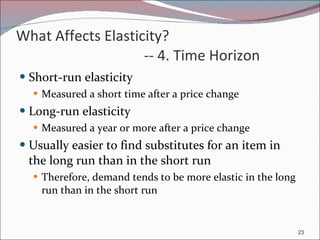
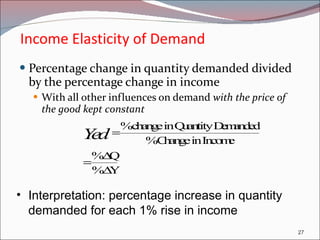
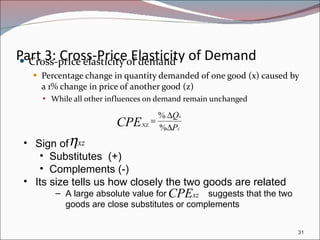
3. Factors like availability of substitutes, importance of the good, and time horizon affect price elasticity of demand. Income elasticity measures responsiveness to income changes.