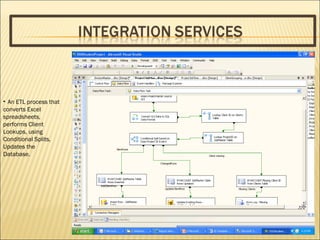
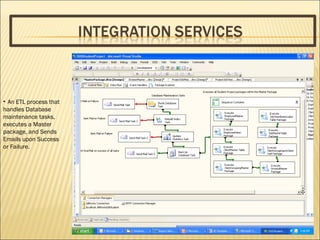
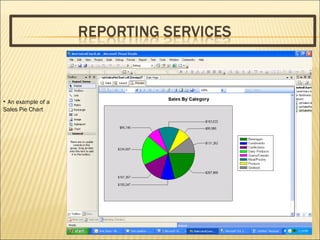
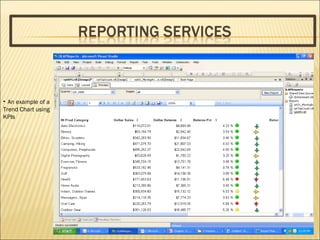
This document provides a summary of the author's experience with Microsoft business intelligence tools including data modeling, ETL processes, MDX queries, KPIs, and dashboard visualizations. The author has skills in SQL Server Integration Services, SQL Server Analysis Services, SQL Server Reporting Services, and Performance Point Server. Projects aim to increase revenue, boost sales, and optimize performance through business intelligence solutions.
![Business Intelligence Portfolio Marlboro, NJ [email_address] Ph: 732.598.2703 Lenny Finkel Business Intelligence Professional](https://image.slidesharecdn.com/lennyfinkel-bipptportfolio-090804212945-phpapp01/85/My-Business-Intelligence-Portfolio-1-320.jpg)
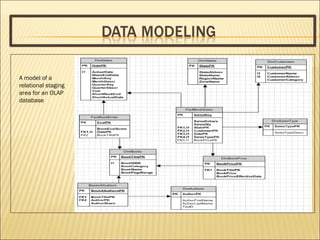
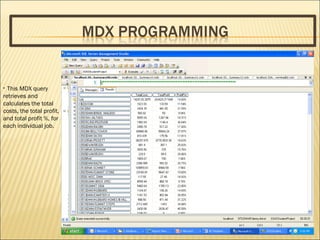
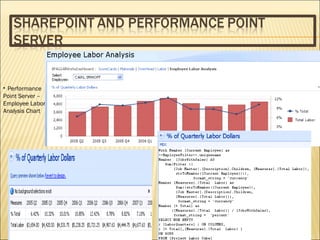
![With member [TotalCosts] as Sum( {[Total Labor Cost], [Total Material Cost], [Total Overhead]} ) member [TotalProfit] as Sum( { [Total Labor Profit], [Total Material Profit], [Additional Labor Profit] } ) member [ProfitPct] as ([TotalProfit] / ([TotalCosts] + [TotalProfit] ) ), format_string = 'percent' Select { [TotalCosts], [TotalProfit], [ProfitPct]} on columns, nonempty ( {[Job Master].[Description], [Job Master].[Description].children } ) on Rows From [All Works Cube] MDX code to retrieve and calculate the total costs, the total profit, and total profit %, for each individual job.](https://image.slidesharecdn.com/lennyfinkel-bipptportfolio-090804212945-phpapp01/85/My-Business-Intelligence-Portfolio-9-320.jpg)


![5G Explained! A High Level Overview [Introduction]](https://cdn.slidesharecdn.com/ss_thumbnails/5gexplainedahighleveloverview-260119165306-cc137a3e-thumbnail.jpg?width=640&height=640&fit=bounds)


