Download as PDF, PPTX
![40 60 80 100 120
40
60
80
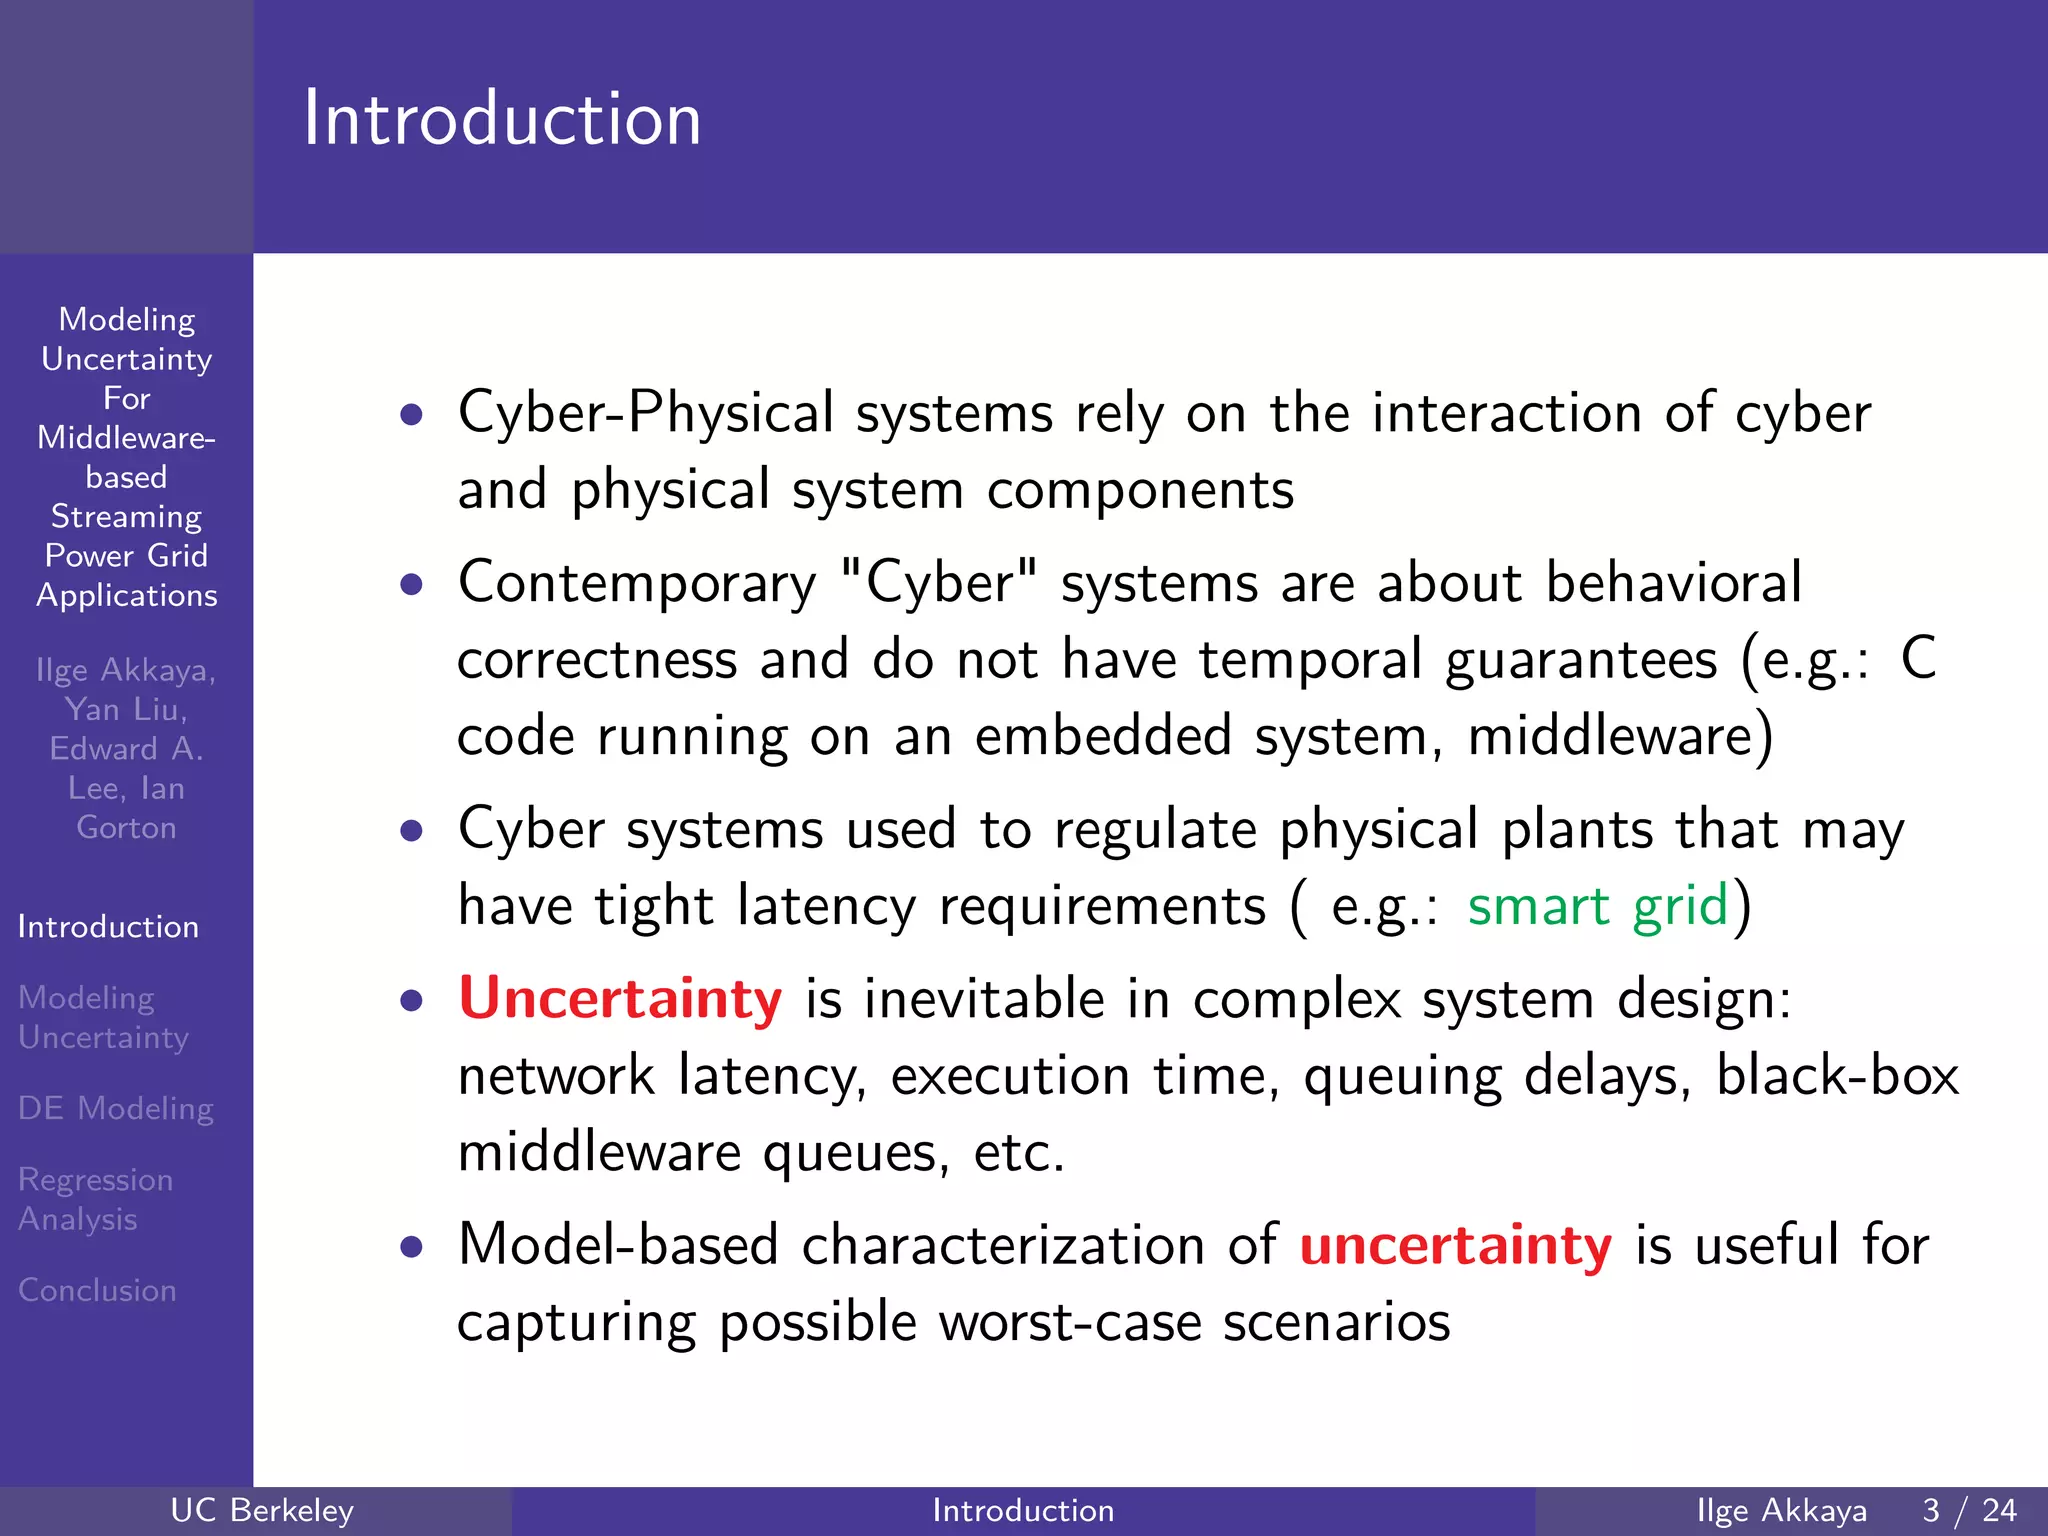
mmModeling
Uncertainty
For
Middleware-
based
Streaming
Power Grid
Applications
Ilge Akkaya,
Yan Liu,
Edward A.
Lee, Ian
Gorton
Introduction
Modeling
Uncertainty
DE Modeling
Regression
Analysis
Conclusion
Heterogeneous Modeling in Ptolemy II
[Edward A. Lee et al., 2010]
UC Berkeley Introduction Ilge Akkaya 5 / 24](https://image.slidesharecdn.com/mw4ngpaper4-140509123359-phpapp01/75/Modeling-Uncertainty-For-Middleware-based-Streaming-Power-Grid-Applications-5-2048.jpg)
![40 60 80 100 120
40
60
80
mmModeling
Uncertainty
For
Middleware-
based
Streaming
Power Grid
Applications
Ilge Akkaya,
Yan Liu,
Edward A.
Lee, Ian
Gorton
Introduction
Modeling
Uncertainty
DE Modeling
Regression
Analysis
Conclusion
Modeling Middleware Architecture
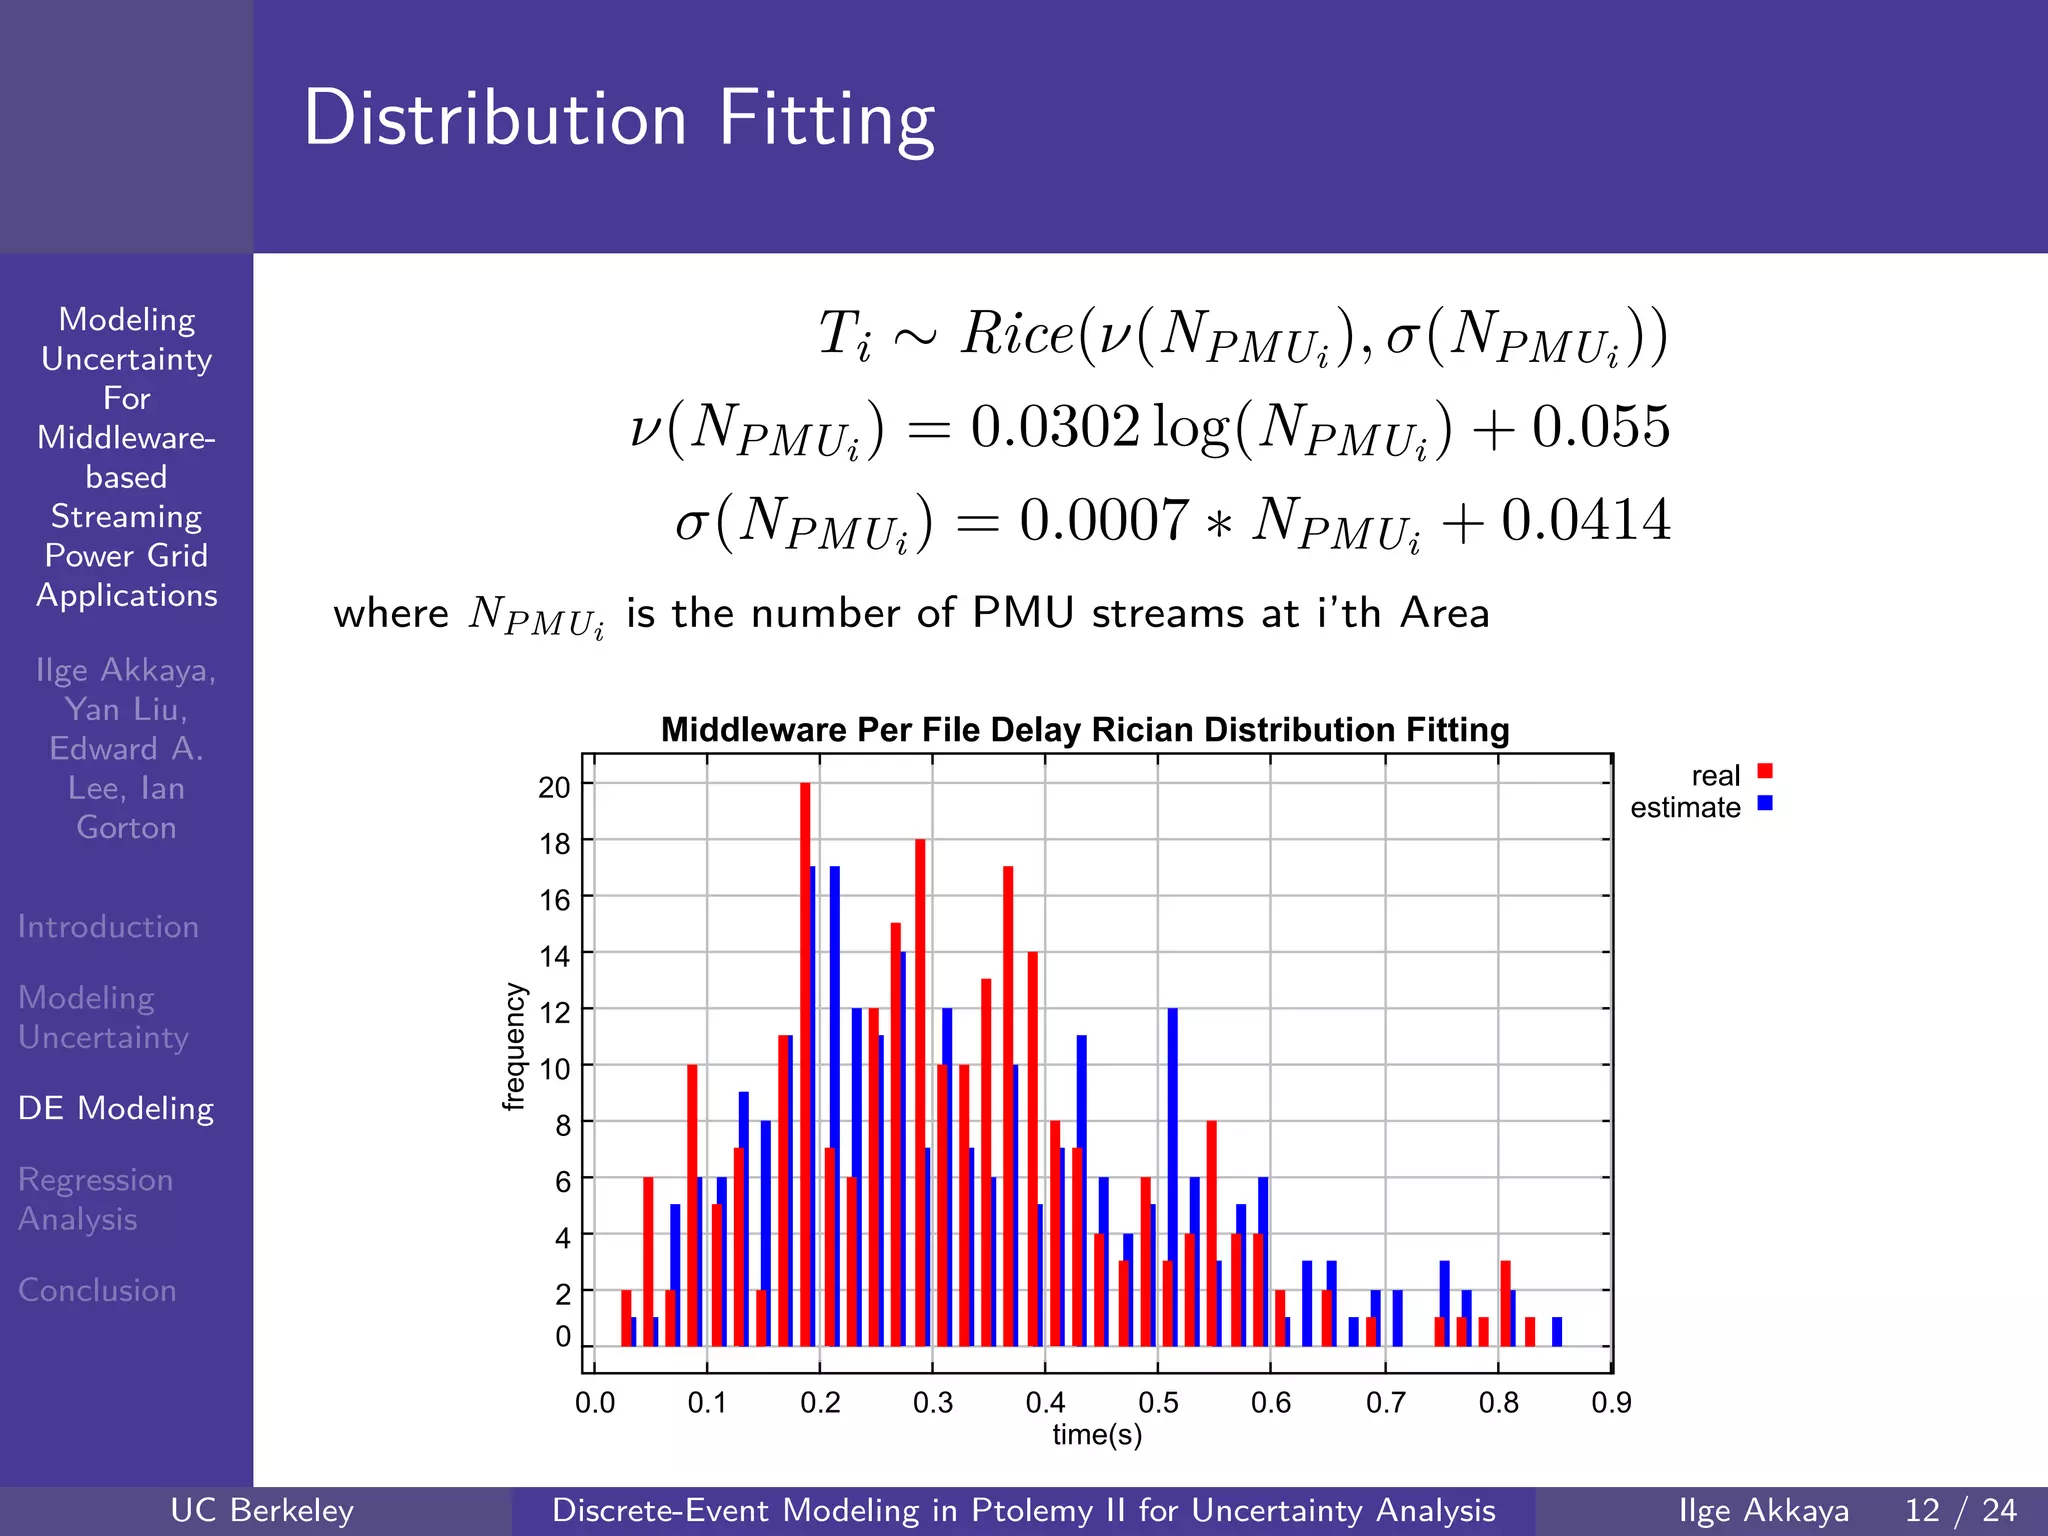
• Middleware modeled
as a thread pool
• Thread pool size is an
uncertainty parameter
• Stochastic delay per
thread processing
[Rician]
• Model trained using
Apache ActiveMQ
TM
benchmark results
UC Berkeley Discrete-Event Modeling in Ptolemy II for Uncertainty Analysis Ilge Akkaya 11 / 24](https://image.slidesharecdn.com/mw4ngpaper4-140509123359-phpapp01/75/Modeling-Uncertainty-For-Middleware-based-Streaming-Power-Grid-Applications-11-2048.jpg)
![40 60 80 100 120
40
60
80
mmModeling
Uncertainty
For
Middleware-
based
Streaming
Power Grid
Applications
Ilge Akkaya,
Yan Liu,
Edward A.
Lee, Ian
Gorton
Introduction
Modeling
Uncertainty
DE Modeling
Regression
Analysis
Conclusion
Sample Simulation Traces: Distribution
sensor-to-concentrator
concentrator-to-MW
iteration runtime
0
5
10
15
20
25
30
35
40
45
50
55
60
65
70
75
80
85
0.0 10.0 20.0 122.5
Sample Latency Distribution
time(ms)
EventID
per packet MW delay
0
2
4
6
8
10
12
14
16
18
20
22
24
-0.2 -0.1 0.0 0.1 0.2 0.3 0.4 0.5 0.6 0.7 0.8 0.9 1.0 1.1 1.2 1.3
Middleware Processing Delay
time(ms)
EventID
Partial Latency Distri-
butions for one sam-
ple run of the DE
model. Captures the un-
certainty in HPC com-
putation [green], sen-
sor network [red], mid-
dleware network [blue]
and middleware process-
ing [black]
UC Berkeley Discrete-Event Modeling in Ptolemy II for Uncertainty Analysis Ilge Akkaya 15 / 24](https://image.slidesharecdn.com/mw4ngpaper4-140509123359-phpapp01/75/Modeling-Uncertainty-For-Middleware-based-Streaming-Power-Grid-Applications-15-2048.jpg)

The document describes modeling uncertainty in middleware-based streaming applications for power grids. It presents a discrete-event model built in Ptolemy II to capture uncertainty from sources like middleware latency, network delays, and number of sensor streams. Monte Carlo simulations are run over this model by varying parameters like middleware concurrency and sensor streams. Regression analysis is then used to understand the relationship between these influential parameters and the end-to-end application run time.