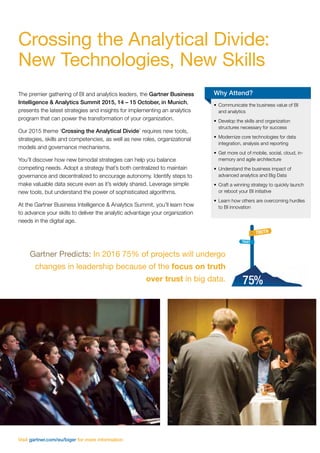
Data Catalog as the Platform for Data IntelligenceAlation
Data catalogs are in wide use today across hundreds of enterprises as a means to help data scientists and business analysts find and collaboratively analyze data. Over the past several years, customers have increasingly used data catalogs in applications beyond their search & discovery roots, addressing new use cases such as data governance, cloud data migration, and digital transformation. In this session, the founder and CEO of Alation will discuss the evolution of the data catalog, the many ways in which data catalogs are being used today, the importance of machine learning in data catalogs, and discuss the future of the data catalog as a platform for a broad range of data intelligence solutions.
TDWI Checklist - The Automation and Optimization of Advanced Analytics Based ...Vasu S
A whitepaper of TDWI checklist, drills into the data, tools, and platform requirements for machine learning to to identify goals and areas of improvement for current project
https://www.qubole.com/resources/white-papers/tdwi-checklist-the-automation-and-optimzation-of-advanced-analytics-based-on-machine-learning
Slides: The Automated Business GlossaryDATAVERSITY
You can’t do business without being able to successfully extract insights from your organization’s data supply chain. You need a strong foundation for visibility and control of data. Flying by the seat of your pants, when it comes to analyzing your market, your performance, and your competitors’ performances, just doesn’t work.
In this webinar, we’ll examine the real-life daily struggles and frustrations plaguing the data supply chain and discuss how these struggles can be eliminated by automation of metadata operations such as data lineage, data discovery and business glossary.
When you attend this webinar, you will learn about:
• What data consumers are really spending their time on and why they are so frustrated
• The challenges of building a business glossary
• How to get started with an automated business glossary and why it’s critical for BI intelligence
every business needs a data analytics to get a detailed value of cost and profits. we will study the importance in detail in this particular presentation.
The presentation is a introduction to Big Data and analytics, how to go about enabling big data and analytics in our company, what are the main differences between big data analytics vs. traditional analytics and how to get started.
This material was used at the SAS Big Data Analytics event held in Helsinki on 19th of April 2011.
The slides are copyright of Accenture.
Mobile, Wearables, Big Data and A Strategy to Move Forward (with NTT Data Ent...Barcoding, Inc.
Join NTT Data Enterprise Services, Inc.for a discussion on the Internet of Things (IoT), wearables, augmented reality, predictive analytics, and a strategy for using Big Data effectively in your enterprise. Presented at the Barcoding, Inc. Executive Forum 2014
Big Data Analytics | What Is Big Data Analytics? | Big Data Analytics For Beg...Simplilearn
The presentation about Big Data Analytics will help you know why Big Data analytics is required, what is Big Data analytics, the lifecycle of Big Data analytics, types of Big Data analytics, tools used in Big Data analytics and few Big Data application domains. Also, we'll see a use case on how Spotify uses Big Data analytics. Big Data analytics is a process to extract meaningful insights from Big Data such as hidden patterns, unknown correlations, market trends, and customer preferences. One of the essential benefits of Big Data analytics is used for product development and innovations. Now, let us get started and understand Big Data Analytics in detail.
Below are explained in this Big Data analytics tutorial:
1. Why Big Data analytics?
2. What is Big Data analytics?
3. Lifecycle of Big Data analytics
4. Types of Big Data analytics
5. Tools used in Big Data analytics
6. Big Data application domains
What is this Big Data Hadoop training course about?
The Big Data Hadoop and Spark developer course have been designed to impart an in-depth knowledge of Big Data processing using Hadoop and Spark. The course is packed with real-life projects and case studies to be executed in the CloudLab.
What are the course objectives?
This course will enable you to:
1. Understand the different components of the Hadoop ecosystem such as Hadoop 2.7, Yarn, MapReduce, Pig, Hive, Impala, HBase, Sqoop, Flume, and Apache Spark
2. Understand Hadoop Distributed File System (HDFS) and YARN as well as their architecture, and learn how to work with them for storage and resource management
3. Understand MapReduce and its characteristics, and assimilate some advanced MapReduce concepts
4. Get an overview of Sqoop and Flume and describe how to ingest data using them
5. Create database and tables in Hive and Impala, understand HBase, and use Hive and Impala for partitioning
6. Understand different types of file formats, Avro Schema, using Arvo with Hive, and Sqoop and Schema evolution
7. Understand Flume, Flume architecture, sources, flume sinks, channels, and flume configurations
8. Understand HBase, its architecture, data storage, and working with HBase. You will also understand the difference between HBase and RDBMS
9. Gain a working knowledge of Pig and its components
10. Do functional programming in Spark
11. Understand resilient distribution datasets (RDD) in detail
12. Implement and build Spark applications
13. Gain an in-depth understanding of parallel processing in Spark and Spark RDD optimization techniques
14. Understand the common use-cases of Spark and the various interactive algorithms
15. Learn Spark SQL, creating, transforming, and querying Data frames
Learn more at https://www.simplilearn.com/big-data-and-analytics/big-data-and-hadoop-training
Understanding big data and data analytics-Business IntelligenceSeta Wicaksana
Faster and more accurate reporting, analysis or planning; better business decisions; improved employee satisfaction and improved data quality top the list. Benefits achieved least frequently include reducing costs, and increasing revenues.
LoQutus helps organisations to innovate with analytics and to get insights with data visualisation. We also build large scale data layers to enable interaction with core data, and develop data-driven applications to deliver the insights our customers need. During this session we’ll share what we have learned along the way. We’ll show you our framework for self-service analytics & insights, and some successful case studies.
You probably have heard about Big Data, but ever wondered what it exactly is? And why should you care?
Mobile is playing a large part in driving this explosion in data. The data are also created by the apps and other services in the background. As people are moving towards more digital channels, tons of data are being created. This data can be used in a lot of ways for personal and professional use. Big Data and mobile apps are converging in an enterprise and interacting; transforming the whole mobile ecosystem.
Data protection and privacy regulations such as the EU’s General Data Protection Regulation (GDPR), the California Consumer Privacy Act (CCPA), and Singapore’s Personal Data Protection Act (PDPA) have been major drivers for data governance initiatives and the emergence of data catalog solutions. Organizations have an ever-increasing appetite to leverage their data for business advantage, either through internal collaboration, data sharing across ecosystems, direct commercialization, or as the basis for AI-driven business decision-making. This requires data governance and especially data asset catalog solutions to step up once again and enable data-driven businesses to leverage their data responsibly, ethically, compliantly, and accountably.
This presentation explores how data catalog has become a key technology enabler in overcoming these challenges.
This presentation was given by Robin Bloor of the Bloor Group, at the Austin Data Strategy Roadshow hosted by FairCom on January 27, 2016.
Robin Bloor goes through how the shifting landscape in technology has changed the way organizations can work with data today. He talks about how the advancements in hardware, software and the growing rate of data is allowing database technology to morph, and organizations to look closely at how to handle this oncoming deluge of data.
Chief Data & Analytics Officer Fall Boston - PresentationSrinivasan Sankar
Data Asset Catalog & Metadata Management - Is It a Fad or Is It the Future?
Many have dubbed metadata as “the new black,” but is this accurate?
How to leverage metadata management to streamline data governance and ensure transparency
Improving data quality and ensuring consistency and accuracy of data across various reporting systems
Looking at the flip side: what are the additional training requirements and value-added for the business?
Analytics & Data Strategy 101 by Deko DimeskiDeko Dimeski
- Understand why each company needs solid analytics and data strategy & capabilities
- Typical data problems each company experiences, regardless of the scale
- Core competences and roles
- Analytics products and artefacts
- Analytics Usecases
Information Driven Enterprise Architecture - Connected Brains 2018LoQutus
In this session we will show you how to deliver business
improvements with enterprise and information architecture. During this session you will get new insights to increase value to the organisation. We also explain our LEAF framework, an integrated EA framework leveraging information to build architectures more quickly.
Understanding big data and data analytics big dataSeta Wicaksana
Big Data helps companies to generate valuable insights. Companies use Big Data to refine their marketing campaigns and techniques. Companies use it in machine learning projects to train machines, predictive modeling, and other advanced analytics applications.
My goal today is to inspire you to make a strong business case for applying big data in your enterprise, a key part of which is taking big data beyond analytics.
This presentation by Think Big principal Matt Cooke and Martin Oberhuber, Senior Data Scientist, discusses high frequency trading, requirements for success, and underlying architectures which may include Apache Spark.
Predictive Analytics World for Business Germany 2018Rising Media Ltd.
Predictive Analytics World for Business is the leading provider of independent specialized conferences in applied predictive analytics. Users, decision makers and experts in predictive analytics will meet in Berlin in order to discover the latest findings and progress, to exchange among specialists and in person and to be inspired by the success stories.
2nd Big Data Business Forum Nov 13th to 15th, 2013 in San FranciscoMario Faria
The 2nd Big Data Business Forum will happen from November 13th to 15th, 2013 in San Francisco. This is one of the top data and analytics conferences of the year.
Every organization has the opportunity to use Big Data in their people strategies. By using analytics tools and Big Data techniques, organizations can now start to develop a “people model” for their teams, as well as understand precisely how these people-related factors relate to business results. They can also use this data to assess organizational risk, leadership pipeline, engagement factors, and impending workforce gaps in the future.
This presentation was held by Professor Christine Legner (HEC Lausanne) at the Swiss Day on November 8, 2017, in Lausanne, Switzerland. It addresses the need for organisations to think about data and its management in new ways, as many corporations engage in the digital and data-driven transformation of their business. It concludes with three recommendations: 1) assess data's business value and impact, 2) measure and improve data quality, and 3) democratize data and support data citizenship.
Analytics thought-leader Thomas Davenport and leading industry experts discuss how—and why—organizations like yours use business analytics to empower more timely and precise decisions by bringing new insights into daily operations.
Understand the What, Why & How of Digital Transformation Featuring 451 ResearchVMware Tanzu
Why did we hear so much about “Digital Transformation” in 2016, and frankly what does it mean? While it's easy to dismiss the phrase with an eye-roll, there's no better phrase to represent improving how IT is used to help drive business innovation...and the huge changes organizations must go through to be successful. This webinar with Nick Patience, Research Vice President for 451 Research's software team, and Michael Coté of Pivotal will discuss a pragmatic definition and approach to Digital Transformation as seen through the experiences of organizations who've lived through it.
Digital Transformation is about fundamentally rebuilding business and IT processes, not just about building apps. 451 Research defines Digital Transformation as “a result of IT innovation that is aligned with and driven by a well-planned business strategy, with the goal of transforming how organizations serve customers, employees and partners.” Some main features of a successful transformation include the ability to quickly react to market demands, and use information to make better decisions and serve constituents more effectively.
In this webinar Nick Patience of 451 Research and Pivotal’s Michael Cote will discuss:
- Why now is the time for Digital Transformation
- How the balance of power between customer and provider contributes to this new revolution
- Shifting priorities that require new practices and processes and the technical tools and platforms that support them
- Real-world examples of organizations that have been there (we’ll share all the gorey details, including what worked and didn't work for them)
View the webinar here: https://www.brighttalk.com/webcast/14891/242781
European Decision Support Days 2015 agendaCopperberg
The market of BI is shifting from early adoption to actual implementation.
It has gradually evolved from being rigid to a much more
flexible, agile process, that is cloud enabled, that organizations
as well as individuals can utilize. This change has now reached Europe,
with 37% of the companies performing Business Intelligence projects.
Big Data is projected to be a $28.5 billion market in 2014, growing to
$50.1 billion in 2015. The average business expects to spend about $8
million on Big Data related activities.
The early adopters of Business Intelligence and Big Data have
gained a significant advantage. Bain & Company examined over
400 large companies and their research has shown that those
with the most advanced analytics capabilities are outperforming
their competitors by wide margins. Leaders in the field are twice as
likely to be in the top quartile of financial performance within their
industries, five times as likely to make decisions much faster than
market peers and are three times as likely to execute decisions as
intended.
Advanced users of BI are now shifting from desktop to mobile, but
the question is how to manage this shift and overcome issues to
enable mobile decision support for decision making anytime, anywhere.
Converging the cloud and BI to enable the central coordination of
applications for information delivery to any device asks for a complete
tool that meets quality standards. Up till today, a complete tool
does not exist and it is very challenging to show the value of BI to
convince management and support decisions. This lack of value
measurements results in difficulties of ROI measurements of BI
solutions and thus the demand for performance management is
growing momentum.
After the staggering success and interest for our local Business Intelligence
conferences in Stockholm, Oslo and Amsterdam, we are
now glad to present our inaugural Pan-European Decision Support
Days conference. The Decision Support Days is not just a conference.
It is a business focused benchmarking tool for strategy makers and
business owners working with Business Intelligence and Business
Analytics from across Europe and beyond. The conference will shed
light on the current BI or BA strategies, processes, tools and models
that organisations in Europe and beyond are using in order to utilize
both internal and external data to drive business and enable faster
data-driven decision making.
Welcome to the European Decision Support Days 2015
Find out more: http://www.decisionsupportdays.com/
Topic: Driving Business Insights with Hadoop and Big Data Platforms
Mr. Krishnan is a recognized expert worldwide in the strategy, architecture and implementation of high performance data warehousing solutions. He is a visionary data warehouse thought leader, ranked as one of the top 25 data warehouse consultants in the world, and an independent analyst, writing and speaking at industry leading conferences, user groups and trade publications. He has authored three eBooks, over 125 plus articles, viewpoints, whitepapers and case studies in Big Data, Business Intelligence, Data Warehousing and Data Ware-house Appliances and Architectures. He has co-authored a book with Bill Inmon titled “Building The Unstructured Data Warehouse”
A recognized authority on Unstructured data integration, text mining and text analytics. Along with Bill Inmon, he is promoting the next generation of data warehousing, primarily on DW 2.0 platform with unstructured data integration and social intelligence as key areas in BIG data and analytics.
Mr. Krishnan will also be joining us from Chicago, United States on video conference, his session will focus on the world we live in today, driven by an insane amount of data and information being flooded all the time at us whether on smartphones or social media networks or on our computing platforms. What is the need for this information? What is it influencing us towards? Who do we influence? Where is the profitability and margin in this mode of advertising and crowdsourcing? The answer to these questions and more of the type can be found by Business users and SME’s when they drive the information towards delivering successful business insights, the same mode that was used by companies like Google and Facebook to create their platforms and the position in the industry. In this session we will discuss the powerful platforms like Hadoop and NoSQL delivering business insights to the business teams and delivering vast amount of analytical insights that will bring more competitive strategy and positioning to the business. We will also quickly touchbase on ownership and governance models for the program.
Ironside's VP of Strategy & Innovation, Greg Bonnette, delivered a presentation on "How to Build a Winning Strategy for Data & Analytics" to provide a framework for data-driven decision making.
Data Culture Series - Keynote & Panel - 19h May - LondonJonathan Woodward
Big data. Small data. All data. You have access to an ever-expanding volume of data inside the walls of your business and out across the web. The potential in data is endless – from predicting election results to preventing the spread of epidemics. But how can you use it to your advantage to help move your business forward?
Data is growing exponentially and it’s now possible to mine and unlock insights from data in new and unexpected ways. Empower your business to take advantage of this data by harnessing the rich capabilities of Microsoft SQL Server and the familiarity of Microsoft Office to help organize, analyze, and make sense of your data—no matter the size.
Strategy session 5 - unlocking the data dividend - andy steerAndy Steer
"A recent study completed by IDC examined the economic benefits accrued to organisations that made basic levels of investment in distinct areas of analytics and data management compared with the benefits accrued by organisations that opted for a broader and more diverse set of investments. The conclusion was that the leading organisations expect to capture in excess of $1.5 trillion more in value from their data and analytics initiatives over the next 4 years. This represents a 60% higher data dividend for the leading organisations.
To achieve these benefits organisations need to embrace the changing reality of the new data driven society and make a break from the beliefs and best practices inherent in traditional Business Intelligence programmes.
During the presentation Andy will expand on the data dividend concept, outline the 4 key investment areas that should be getting your attention and perhaps most importantly, explain how your existing SAP BusinessObjects technology can help you take your share of the estimated £53 billion UK data dividend."
Business in the Driver’s Seat – An Improved Model for IntegrationInside Analysis
The Briefing Room with Dr. Robin Bloor and WhereScape
Live Webcast on September 30, 2014
Watch the archive:
https://bloorgroup.webex.com/bloorgroup/lsr.php?RCID=bfff40f7c9645fc398770ea11152b148
The fueling of information systems will always require some effort, but a confluence of innovations is fundamentally changing how quickly and accurately it can be done. Gone are long cycle times for development. Today, organizations can embrace a more rapid and collaborative approach for building analytical applications and data warehouses. The key is to have business experts working hand-in-hand with data professionals as the solutions take shape, thus expediting the speed to valuable insights.
Register for this episode of The Briefing Room to hear veteran Analyst Dr. Robin Bloor as he explains the changing nature of information design. He’ll be briefed by WhereScape President Mark Budzinski, who will discuss his company’s data warehouse automation solutions and how they enable collaborative development. He will share use cases that illustrate show aligning business and IT, organizations can enable faster and more agile data warehouse development.
Visit InsideAnlaysis.com for more information.
Big data. Small data. All data. You have access to an ever-expanding volume of data inside the walls of your business and out across the web. The potential in data is endless – from predicting election results to preventing the spread of epidemics. But how can you use it to your advantage to help move your business forward?
Data is growing exponentially and it’s now possible to mine and unlock insights from data in new and unexpected ways. Empower your business to take advantage of this data by harnessing the rich capabilities of Microsoft SQL Server and the familiarity of Microsoft Office to help organize, analyze, and make sense of your data—no matter the size.
Big Data : From HindSight to Insight to ForesightSunil Ranka
When it comes to Analytics and Reporting , There is a fine line between HindSight to Insight to Foresight . With the evolution of BigData technology, there is a need in deriving value out of the larger datasets, not available in the past. Even before we can start using the new shiny technologies, there is a need of understanding what is categorized as reporting or business intelligence or Big Data and Analytics. Based on my experience, people struggle to distinguish between reporting, Analytics, and Business Intelligence.
Similar to Gartner Business Intelligence & Analytics Summit Brochure (20)
The 10 Most Influential Leaders Guiding Corporate Evolution, 2024.pdfthesiliconleaders
In the recent edition, The 10 Most Influential Leaders Guiding Corporate Evolution, 2024, The Silicon Leaders magazine gladly features Dejan Štancer, President of the Global Chamber of Business Leaders (GCBL), along with other leaders.
Company Valuation webinar series - Tuesday, 4 June 2024FelixPerez547899
This session provided an update as to the latest valuation data in the UK and then delved into a discussion on the upcoming election and the impacts on valuation. We finished, as always with a Q&A
Building Your Employer Brand with Social MediaLuanWise
Presented at The Global HR Summit, 6th June 2024
In this keynote, Luan Wise will provide invaluable insights to elevate your employer brand on social media platforms including LinkedIn, Facebook, Instagram, X (formerly Twitter) and TikTok. You'll learn how compelling content can authentically showcase your company culture, values, and employee experiences to support your talent acquisition and retention objectives. Additionally, you'll understand the power of employee advocacy to amplify reach and engagement – helping to position your organization as an employer of choice in today's competitive talent landscape.
Digital Transformation and IT Strategy Toolkit and TemplatesAurelien Domont, MBA
This Digital Transformation and IT Strategy Toolkit was created by ex-McKinsey, Deloitte and BCG Management Consultants, after more than 5,000 hours of work. It is considered the world's best & most comprehensive Digital Transformation and IT Strategy Toolkit. It includes all the Frameworks, Best Practices & Templates required to successfully undertake the Digital Transformation of your organization and define a robust IT Strategy.
Editable Toolkit to help you reuse our content: 700 Powerpoint slides | 35 Excel sheets | 84 minutes of Video training
This PowerPoint presentation is only a small preview of our Toolkits. For more details, visit www.domontconsulting.com
Implicitly or explicitly all competing businesses employ a strategy to select a mix
of marketing resources. Formulating such competitive strategies fundamentally
involves recognizing relationships between elements of the marketing mix (e.g.,
price and product quality), as well as assessing competitive and market conditions
(i.e., industry structure in the language of economics).
At Techbox Square, in Singapore, we're not just creative web designers and developers, we're the driving force behind your brand identity. Contact us today.
3.0 Project 2_ Developing My Brand Identity Kit.pptxtanyjahb
A personal brand exploration presentation summarizes an individual's unique qualities and goals, covering strengths, values, passions, and target audience. It helps individuals understand what makes them stand out, their desired image, and how they aim to achieve it.
3.0 Project 2_ Developing My Brand Identity Kit.pptx
Gartner Business Intelligence & Analytics Summit Brochure
1. Gartner
Business Intelligence
& Analytics
Summit 2015
14 – 15 October | Munich, Germany | gartner.com/eu/biger
Hot Topics
• Leading a Digital Business with Analytics
• The Evolution of Self Service and Data Discovery
• Analytics Finally Embraces the Cloud
• Big Data and Beyond
• The Impact of the Wider Hadoop Ecosystem
• Growing the Advanced Analytics and
Data Scientist Skill Set
Crossing the Analytical Divide:
New Technologies, New Skills
EARLY-BIRD
Discount
Save €325 by
14 August
2. 75%
TRUTH
TRUST
Visit gartner.com/eu/biger for more information
Crossing the Analytical Divide:
New Technologies, New Skills
The premier gathering of BI and analytics leaders, the Gartner Business
Intelligence & Analytics Summit 2015, 14 – 15 October, in Munich,
presents the latest strategies and insights for implementing an analytics
program that can power the transformation of your organization.
Our 2015 theme ‘Crossing the Analytical Divide’ requires new tools,
strategies, skills and competencies, as well as new roles, organizational
models and governance mechanisms.
You’ll discover how new bimodal strategies can help you balance
competing needs. Adopt a strategy that’s both centralized to maintain
governance and decentralized to encourage autonomy. Identify steps to
make valuable data secure even as it’s widely shared. Leverage simple
new tools, but understand the power of sophisticated algorithms.
At the Gartner Business Intelligence & Analytics Summit, you’ll learn how
to advance your skills to deliver the analytic advantage your organization
needs in the digital age.
Gartner Predicts: In 2016 75% of projects will undergo
changes in leadership because of the focus on truth
over trust in big data.
• Communicate the business value of BI
and analytics
• Develop the skills and organization
structures necessary for success
• Modernize core technologies for data
integration, analysis and reporting
• Get more out of mobile, social, cloud, in-
memory and agile architecture
• Understand the business impact of
advanced analytics and Big Data
• Craft a winning strategy to quickly launch
or reboot your BI initiative
• Learn how others are overcoming hurdles
to BI innovation
Why Attend?
3. Gartner Business Intelligence & Analytics Summit 2015#GartnerBI
What are Attendees Saying?*
Clear, well presented, well-reasoned
overview of a fast moving area.
Attendee from GlaxoSmithKline
This was my first summit. It was an
inspiring and educational experience.
This has resolved a lot of queries I had,
provided great ideas and shown that
I am not alone in working experience.
Attendee from BT
Very useful. Opening my mind to other
possibilities and ideas. Also very
interested to find others with same challenges.
Attendee from Royal Bank of Scotland
Good varied range of speakers/topics.
Good analyst 1-2-1 sessions which are
very valuable. Good range of vendors relevant
to subject area.
Attendee from GE Healthcare
Suggested sessions:
• The First 100 Days of the
Analytic Leader: Building a
Bimodal Strategy
• Building a Successful
Business Analytics Strategy
• The BICC Needs to Change
With the Times
• Benchmark the Maturity of
Your BI Initiative
• Why an Analytical Focus Kills
Your Company and Ruins
Your Career
• Magic Quadrant Power
Session
Suggested sessions:
• Key Trends in
Advanced Analytics
• The DBMS Dilemma:
Choosing the Right DBMS for
the Digital Business
• How to Find, Engage and
Organize Data Scientists
• State of Hadoop – Is It Time?
• Location. The Next Champion
in Analytics
• Real-time Analytics and
Decision Management
Suggested sessions:
• Every Data Set Tells a Story
• Interactive Visualization:
Insights for Everyone
• How to Apply Advanced
Analytics in Real
Business Cases
• Big Data Discovery:
The Next Generation of
BI Self Service
• Who’s Who in Self Service
Data Preparation
• Determining the Business
Value and Costs of BI and
Analytic Platform Investments
Suggested sessions:
• Innovating With Analytics:
40 Real World Examples in
40 Minutes
• Establish an Analytics
Governance Framework
• How to Monetize Your
Information Assets
• Measuring the Business Value
of Analytics
• Chief Data Officers: Who Are
They and Why This Role Will
Keep Growing
• Business Analytics 2020
Market Trends
Bring your Team!
Maximize learning by participating together in relevant sessions or splitting up to cover more ground, sharing your session take-aways
later. To help you navigate this year’s agenda as a team we recommend mapping sessions to individual roles of your team.
Your team could include:
Business Intelligence
and Analytics Leaders
Enterprise Architects Business Analysts Senior Business and
IT Leaders
*Testimonials from our recent Gartner Business Intelligence Analytics Summit in London
4. Gartner Business Intelligence Analytics Summit 2015
Agenda at a Glance
#GartnerBI
During the event, please refer to the printed
07:30 – 20:00 Registration and Information
08:00 – 08:45 Tutorial: Getting the Most Out of Gartner Ian Bertram Tutorial: How Does Data Science Really Work?
09:00 – 10:00 Gartner Opening Keynote: Crossing the Analytical Divide: New Technologies, New Skills Frank Buytendijk, Rita Sallam and Kurt Schlegel
Tracks A. Lead the Initiative B. Evangelize the New C. Modernize the Core
10:15 – 11:00 Establish an Analytics Governance
Framework Thomas Oestreich
Innovating With Analytics: 40 Real World
Examples in 40 Minutes Alan Duncan
Key Trends in Advanced Analytics Lisa Kart
11:00 – 11:30 Refreshment Break in the Solution Showcase 11:00 – 11:30 Peer Exchange: Analytic Skills and H
11:30 – 12:15 Case Study Real-time Analytics and Decision
Management Roy Schulte
Business Analytics 2020 Market Trends
Neil Chandler
12:30 – 13:00 Solution Provider Sessions
13:00 – 14:30 Lunch Break in the Solution Showcase 14:00 – 14:30 Peer Exchange: Improving Data Qua
14:30 – 15:00 The First 100 Days of the Analytic Leader:
Building a Bimodal Strategy Kurt Schlegel
How to Find, Engage and Organize Data
Scientists Alexander Linden
Who's Who in Self Service Data Preparation
Rita Sallam
15:15 – 15:45 Solution Provider Sessions
15:45 – 16:15 Refreshment Break in the Solution Showcase 15:45 – 16:15 Peer Exchange: Big Data: Sharing F
16:15 – 17:00 How to Monetize Your Information Assets
Debra Logan
Case Study Every Data Set Tells a Story Neil Chandler
17:15 – 18:00 Guest Keynote
18:00 – 20:00 Networking Reception in the Solution Showcase
07:30 Registration and Information
08:00 – 08:45 The BICC Needs to Change With the
Times Alan Duncan
Event Stream Processing and CEP:
Like BI but Not Roy Schulte
The DBMS Dilemma: Choosing the Right DBMS
for the Digital Business Mark Beyer
09:00 – 09:45 Gartner Magic Quadrant Power Session: Data Warehouse and Data Management Solutions for Analytics; Business Intelligence and Analytics Platforms;
10:00 – 10:30 Solution Provider Sessions
10:30 – 11:00 Refreshment Break in the Solution Showcase 10:30 – 11:00 Peer Exchange: Supporting Executiv
11:00 – 11:45 Building a Successful Business Analytics
Strategy Thomas Oestreich
Interactive Visualization: Insights for
Everyone Rita Sallam
Do We Still Need a Data Warehouse?
Roxane Edjlali
12:00 – 12:45 Why an Analytical Focus Kills Your Company and
Ruins Your Career Frank Buytendijk
The Next Generation of Information Leaders:
Chief Data Officers and Chief Analytics
Officers Debra Logan
Case Study
12:45 – 14:00 Lunch Break in the Solution Showcase 13:30 – 14:00 Peer Exchange: Data Discovery and
14:00 – 14:30 Benchmark the Maturity of Your BI Initiative
Cindi Howson
Location. The Next Champion in Analytics
Thomas Oestreich
How to Apply Advanced Analytics to Real
Business Cases Lisa Kart
14:45 – 15:30 Measuring the Business Value of Analytics
Neil Chandler
Big Data Discovery: The Next Generation of BI
Self Service Alan Duncan
State of Hadoop — Is It Time?
Mark Beyer
15:30 – 16:00 Refreshment Break in the Solution Showcase 15:30 – 16:00 Peer Exchange: Developing an Effec
16:00 – 16:45 Gartner Closing Keynote: The Role of Information in the Digital Business Ian Bertam
16:45 – 17:00 Closing Remarks from the Chair Thomas Oestreich
Wednesday
14October2015
Thursday
15October2015
Gartner Predicts: In 2017 90% of big data information assets
siloed and inaccessible across multiple business proc
5. Visit gartner.com/eu/biger for more information
Tracks
Agenda as of 25 June 2015
Agenda or the Gartner Events mobile app for complete, up to the minute session information.
Alexander Linden
Workshops roundtables
How to Find Them 11:15 – 12:15 Analyst-User Roundtable: BICC
Lessons From the Field Deployments: What
Works, What Doesn’t Alan Duncan11:30 – 13:00 Workshop:
Determining the Business Value and Costs of BI
and Analytic Platform Investments
Facilitator: cindi Howson
ality
14:00 – 15:00 Ask the Analyst Roundtable: The
Logical Data Warehouse Concept
Mark Beyer
14:15 – 15:45 Workshop:
Foundational Skills of a BI and Analytics Change
Agent and Leader
Facilitator: Debra Logan
First Experiences
16:00 – 17:00 Analyst-User Roundtable: How to
Negotiate With BI Vendors
Moderator: Kurt schlegel
Advanced Analytics Platforms Ian Bertram, cindi Howson, Roxane Edjlali and Alexander Linden
ve Decision Making
10:45 – 11:45 Ask the Analyst Roundtable:
Reasons for Big Data Analytics Failures
Moderator: Alexander Linden
11:00 – 12:30 Workshop: Embedding Analytics
and Operational Intelligence in Business
Processes
Facilitator: Roy schulte 12:00 – 13:00 Ask the Analyst Roundtable:
Analytics in the Cloud — the Dark Side and the
Bright Side Moderator: cindi Howson
d Self Service BI: What Are Best Practices?
13:30 – 14:30 Ask The Analyst Roundtable:
How Are BI Programs Evolving to Support and
Enable Governed Data Discovery?
Moderator: Rita sallam
ctive BI Strategy
A. Lead the Initiative
Hot Topics:
• The New Role of the BICC
• Crafting a Business Analytics Strategy
• Monetizing Information Assets
• Synthesize Your Analytics Insights
• Bimodal Analytics Leadership
B. Evangelize the New
Hot Topics:
• Innovate With Analytics
• Real Time Analytics
• Data Science
• Chief Data Offi cers
• Big Data Discovery
C. Modernize the Core
Hot Topics:
• Advanced Analytics
• Self service BI and Data Preparation
• Future of the Data Warehouse
• Leveraging Hadoop
• Databases for the Digital Business
Virtual Tracks
Jumpstart the Journey
Hot Topics:
• Interactive Visualization
• Analytics Governance
• Guided Analytics
• Bimodal BI
• Business Value of Analytics
IoT and Industrial Analytics
Hot Topics:
• Operational Intelligence
• Prescriptive Analytics
• Decision Management
• Real Time Analytics
• Complex Event Processing
will be
cesses.
2017