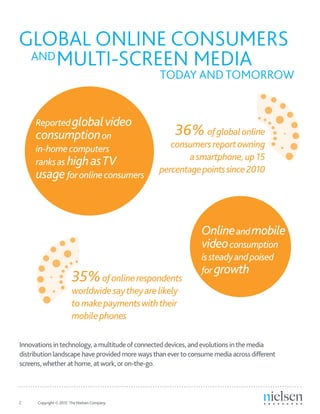
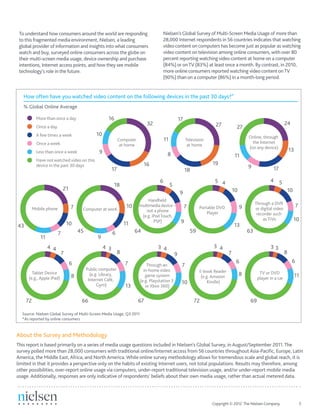
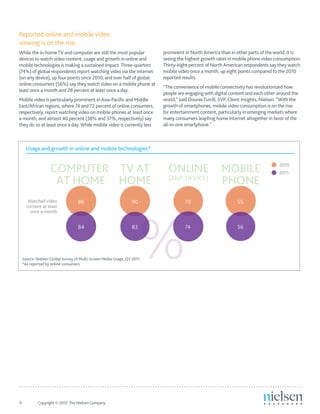
A Nielsen Report
Global Online
Consumers and
Multi-Screen Media:
Today andTomorrow
May 2012
2	 Copyright © 2012 The Nielsen Company.
Innovations intechnology, a multitudeofconnecteddevices, andevolutions inthe media
distribution landscape have provided morewaysthanevertoconsume media acrossdifferent
screens,whether at home, at work,oron-the-go.
TODAY AND TOMORROW
GLOBAL ONLINE CONSUMERS
		 MULTI-SCREEN MEDIAAND
Reportedglobalvideo
consumptionon
in-homecomputers
ranksas highasTV
usageforonlineconsumers
Onlineandmobile
videoconsumption
issteadyandpoised
for growth
36%ofglobalonline
consumersreportowning
asmartphone,up15
percentagepointssince2010
35%ofonlinerespondents
worldwidesaytheyarelikely
tomakepaymentswiththeir
mobilephones
Copyright © 2012 The Nielsen Company.	 3
To understand how consumers around the world are responding
to this fragmented media environment, Nielsen, a leading
global provider of information and insights into what consumers
watch and buy, surveyed online consumers across the globe on
their multi-screen media usage, device ownership and purchase
intentions, Internet access points, and how they see mobile
technology’s role in the future.
Nielsen’s Global Survey of Multi-Screen Media Usage of more than
28,000 Internet respondents in 56 countries indicates that watching
video content on computers has become just as popular as watching
video content on television among online consumers, with over 80
percent reporting watching video content at home on a computer
(84%) or onTV (83%) at least once a month. By contrast, in 2010,
more online consumers reported watching video content onTV
(90%) than on a computer (86%) in a month-long period.
About the Survey and Methodology
This report is based primarily on a series of media usage questions included in Nielsen’s Global Survey, in August/September 2011.The
survey polled more than 28,000 consumers with traditional online/Internet access from 56 countries throughout Asia-Pacific, Europe, Latin
America, the Middle East, Africa, and North America. While online survey methodology allows for tremendous scale and global reach, it is
limited in that it provides a perspective only on the habits of existing Internet users, not total populations. Results may therefore, among
other possibilities, over-report online usage via computers, under-report traditional television usage, and/or under-report mobile media
usage. Additionally, responses are only indicative of respondents’ beliefs about their own media usage, rather than actual metered data.
Source: Nielsen Global Survey of Multi-Screen Media Usage, Q3 2011
*As reported by online consumers
% Global Online Average
How often have you watched video content on the following devices in the past 30 days?*
32
16
17
9
10
16
27
19
18
8
11
17
24
13
179
11
27
21
7
10
7
11
43
Computer
at home
Television
at home
More than once a day
Once a day
A few times a week
Once a week
Less than once a week
Have not watched video on this
device in the past 30 days
Online, through
the Internet
(on any device)
Mobile phone
18
10
11
6
10
45
6
5
9
13
7
64
5 4
10
9
9
59
4 5
10
7
9
63
Computer at work Portable DVD
Player
Handheld
multimedia device -
not a phone
(e.g. iPodTouch,
PSP)
Through a DVR
or digital video
recorder such
asTiVo
4 4
7
6
8
72
4 3
8
7
13
66
3 4
9
7
10
67
3 4
7
6
8
72
3 3
8
6
11
69
Tablet Device
(e.g., Apple iPad)
Public computer
(e.g. Library,
Internet Café,
Gym)
Through an
in-home video
game system
(e.g. Playstation 3
or Xbox 360)
E-book Reader
(e.g. Amazon
Kindle)
TV or DVD
player in a car
4	 Copyright © 2012 The Nielsen Company.
Reported online and mobile video
viewing is on the rise
While the in-homeTV and computer are still the most popular
devices to watch video content, usage and growth in online and
mobile technologies is making a sustained impact.Three-quarters
(74%) of global respondents report watching video via the Internet
(on any device), up four points since 2010, and over half of global
online consumers (56%) say they watch video on a mobile phone at
least once a month and 28 percent at least once a day.
Mobile video is particularly prominent inAsia-Pacific and Middle
East/African regions, where 74 and 72 percent of online consumers,
respectively, report watching video on mobile phones at least once
a month, and almost 40 percent (38% and 37%, respectively) say
they do so at least once a day.While mobile video is currently less
prominent in NorthAmerica than in other parts of the world, it is
seeing the highest growth rates in mobile phone video consumption.
Thirty-eight percent of NorthAmerican respondents say they watch
mobile video once a month, up eight points compared to the 2010
reported results.
“The convenience of mobile connectivity has revolutionized how
people are engaging with digital content and each other around the
world,” said DouniaTurrill, SVP, Client Insights, Nielsen. “With the
growth of smartphones, mobile video consumption is on the rise
for entertainment content, particularly in emerging markets where
many consumers leapfrog home Internet altogether in favor of the
all-in-one smartphone.”
%
Usage and growth in online and mobile technologies*
2010
2011
Watched video
content at least
once a month
COMPUTER
AT HOME
86
84
90
83
TV AT
HOME
55
56
MOBILE
PHONE
70
74
ONLINE
(ANY DEVICE)
Source: Nielsen Global Survey of Multi-Screen Media Usage, Q3 2011
*As reported by online consumers
Copyright © 2012 The Nielsen Company.	 5
Smartphones are increasingly popular.
Are tablets next?
Online video consumption is likely to continue its rise, as consumers
are increasingly connecting to the Internet at high speeds. More than
half (57%) of online respondents around the world indicate they own
a computer with high-speed online access—an increase offour points
since 2010, and an additional 16 percent say they plan to purchase
one within the next year.
Global Online Average
Do you currently own or will you purchase any of these items in the next 12 months?*
Computer with high-speed
Internet connection
Smartphone
High-DefinitionTelevision Set (HDTV)
DVR (DigitalVideo Recorder)
Netbook
Handheld multimedia device -
not a phone (e.g. iPodTouch, PSP)
TV with Internet Connection
Stand alone device that
connects myTV to the Internet
Tablet
E-book Reader
3DTelevision Set (3DTV)
I already own I do not own
and I definitely
will purchase
I do not own
and I probably
will purchase
I do not own
and I might or
might not
purchase
I do not own
and I probably
will not purchase
I do not own and
I definitely will
not purchase
57 7 9 11 6 10
36 9 12 14 10 19
35 9 14 15 11 17
23 7 12 17 15 26
20 6 10 17 17 31
19 6 11 17 17 30
17 9 14 19 16 25
13 8 14 20 17 29
12 7 12 19 17 32
10 5 10 17 21 37
6 9 14 21 18 32
Source: Nielsen Global Survey of Multi-Screen Media Usage, Q3 2011
*As reported by online consumers
TV use is also poisedfor continued prominence, as global online
consumers report owning or intending to purchase such technologies
as high-definitionTVs (HDTVs) (58%), digitalvideo recorders (DVRs)
(42%), connectedTVs (35%), and 3D-capable sets (29%).
6	 Copyright © 2012 The Nielsen Company.
Portable devices and their impact on media
consumption
In the years ahead, mobile phones and other portable devices will
affect media consumption, as global consumers with Internet
access increasingly report owning or intending to purchase
smartphones and Internet-connected tablets.Thirty-six percent
of global online respondents report owning a smartphone—an
Global smartphone ownership and purchase intentions*
*As reported by online consumers
Already
Own
“Definitely Will
Purchase” in Next
12 Months
“Probably Will
Purchase” in Next
12 Months
Potential
Ownership
in 12 Months
GLOBAL
36%
9%
12%
57%
ASIA-PACIFIC
44%
11%
15%
70%
EUROPE
30%
5%
8%
43% MIDDLEEAST/
AFRICA
31%
13%
15%
59%
LATINAMERICA
NORTHAMERICA
26%
12%
11%
49%
31%
5%
9%
45%
Source: Nielsen Global Survey of Multi-Screen Media Usage, Q3 2011
increase of 15 points since 2010. InAsia-Pacific markets, 44 percent of
online consumers report owning a smartphone and another quarter
will either definitely (11%) or probably (15%) purchase one in the next
year. In Middle East/African markets, 31 percent of online respondents
have a smartphone already, and nearly as many (28%) will likely buy
one within a year.
Copyright © 2012 The Nielsen Company.	 7
Tablet growth is poised for continued growth
While tablets are an emerging category with lower levels of
penetration than smartphones, global consumers are exhibiting
increased interest around these devices. According to the survey
findings, 12 percent of online respondents worldwide own a
tablet today—up over 70 percent from the seven percent who
reported ownership in 2010. Another 19 percent say they are
likely to purchase a tablet within the next year. Adoption is
highest in Asia-Pacific markets, where almost one of every five
(18%) online consumers report ownership of a tablet and even
more (27%) plan to purchase one within 12 months.
“The impact of mobile technology can be felt around the globe
and touches all aspects of life, from entertainment and shopping
to business and personal communication,” said Amilcar Pérez,
President, Telecom, Nielsen. “In recent years, smartphones and
tablets, with their accessibility, vibrant screens and Internet
access, have propelled us further forward into a new and exciting
digital age. This has been felt around the globe and has enabled
connections in all markets, particularly emerging markets, like
never before.”
Global tablet ownership and purchase intentions*
*As reported by online consumers
Already
Own
“Definitely Will
Purchase” in Next
12 Months
“Probably Will
Purchase” in Next
12 Months
Potential
Ownership
in 12 Months
GLOBAL
12%
7%
12%
31%
ASIA-PACIFIC
18%
9%
18%
45%
EUROPE
6%
3%
7%
16%
MIDDLEEAST/
AFRICA
13%
8%
12%
33%
LATINAMERICA
NORTHAMERICA
5%
12%
10%
27%
7%
4%
8%
19%
Source: Nielsen Global Survey of Multi-Screen Media Usage, Q3 2011
8	 Copyright © 2012 The Nielsen Company.
Online consumers from Asia-Pacific and Middle East/African
markets are also largely willing to try mobile payments, with
almost 40 percent (37% and 39%, respectively) reporting that
they either definitely or probably would buy goods and services
with mobile payment technology. In North America, consumers
are relatively less open to mobile payments than other regions.
One-fourth of North American respondents probably or definitely
would try mobile phone purchase methods, which has increased
seven percentage points since 2010, when only 18 percent of
North American online consumers were open to the idea.
Mobile phone payments are a viable option for many
The practice of using a mobile phone to make purchases in stores
and restaurants in lieu of cash, check, or credit/bank cards shows
strong potential. Almost two-thirds (63%) of global online
respondents are open to the idea of making payments via mobile
phones, with 24 percent likely to do so, and 11 percent fully
committed to the idea.
Latin Americans with Internet access are the most likely to
consider mobile phone payments, with almost one-fifth
(17%) definitely willing and another 34 percent likely open to
the practice.
If you had the capability to do so, would you use your mobile phone to make payments in shops and restaurants?*
Source: Nielsen Global Survey of Multi-Screen Media Usage, Q3 2011
*As reported by online consumers
I definitely
would
I probably
would
I might or
might not
I probably
would not
I definitely
would not
GLOBAL
LATINAMERICA
MIDDLEEAST/AFRICA
ASIA-PACIFIC
EUROPE
NORTHAMERICA
18 13 2112 21 32
19 12 1421 20 19
28 24 2631 27 24
24 34 2425 23 17
17 1512 8 811
Romania
Russia
Saudi Arabia
Singapore
South Africa
South Korea
Spain
Sweden
Switzerland
Taiwan
Thailand
Turkey
United Arab Emirates
United Kingdom
Ukraine
United States
Venezuela
Vietnam
About Nielsen
Nielsen Holdings N.V. (NYSE: NLSN) is
a global information and measurement
company with leading market positions
in marketing and consumer information,
television and other media measurement,
online intelligence, mobile measurement,
trade shows and related properties.
Nielsen has a presence in approximately
100 countries, with headquarters in New
York, USA and Diemen, the Netherlands.
For more information, visit
www.nielsen.com.
For more information visit www.nielsen.com
Copyright © 2012The Nielsen Company. All rights reserved. Nielsen and the Nielsen logo are
trademarks or registered trademarks of CZT/ACNTrademarks, L.L.C. Other product and service
names are trademarks or registered trademarks of their respective companies. 12/4869
Countries in the Study:
Argentina
Australia
Austria
Belgium
Brazil
Canada
Chile
China
Colombia
Croatia
Czech Republic
Denmark
Egypt
Estonia
Finland
France
Germany
Greece
Hong Kong
Hungary
India
Indonesia
Ireland
Israel
Italy
Japan
Latvia
Lithuania
Malaysia
Mexico
Netherlands
New Zealand
Norway
Pakistan
Peru
Philippines
Poland
Portugal
About the Nielsen Global Survey
The Nielsen Global Survey of Multi-
Screen Media Usage was conducted in
August/September 2011 and polled more
than 28,000 consumers in 56 countries
throughout Asia-Pacific, Europe, Latin
America, the Middle East, Africa and
North America. The sample has quotas
based on age and sex for each country
based on their Internet users, and is
weighted to be representative of Internet
consumers and has a maximum margin
of error of ±0.6%. This Nielsen survey is
based on the behavior of respondents with
online access only. Internet penetration
rates vary by country. Nielsen uses a
minimum reporting standard of 60
percent Internet penetration or 10M
online population for survey inclusion. The
Nielsen Global Survey was established in
2005.

Multi-screen media report - May 2012 (Nielsen)

  • 1.
    A Nielsen Report GlobalOnline Consumers and Multi-Screen Media: Today andTomorrow May 2012
  • 2.
    2 Copyright ©2012 The Nielsen Company. Innovations intechnology, a multitudeofconnecteddevices, andevolutions inthe media distribution landscape have provided morewaysthanevertoconsume media acrossdifferent screens,whether at home, at work,oron-the-go. TODAY AND TOMORROW GLOBAL ONLINE CONSUMERS MULTI-SCREEN MEDIAAND Reportedglobalvideo consumptionon in-homecomputers ranksas highasTV usageforonlineconsumers Onlineandmobile videoconsumption issteadyandpoised for growth 36%ofglobalonline consumersreportowning asmartphone,up15 percentagepointssince2010 35%ofonlinerespondents worldwidesaytheyarelikely tomakepaymentswiththeir mobilephones
  • 3.
    Copyright © 2012The Nielsen Company. 3 To understand how consumers around the world are responding to this fragmented media environment, Nielsen, a leading global provider of information and insights into what consumers watch and buy, surveyed online consumers across the globe on their multi-screen media usage, device ownership and purchase intentions, Internet access points, and how they see mobile technology’s role in the future. Nielsen’s Global Survey of Multi-Screen Media Usage of more than 28,000 Internet respondents in 56 countries indicates that watching video content on computers has become just as popular as watching video content on television among online consumers, with over 80 percent reporting watching video content at home on a computer (84%) or onTV (83%) at least once a month. By contrast, in 2010, more online consumers reported watching video content onTV (90%) than on a computer (86%) in a month-long period. About the Survey and Methodology This report is based primarily on a series of media usage questions included in Nielsen’s Global Survey, in August/September 2011.The survey polled more than 28,000 consumers with traditional online/Internet access from 56 countries throughout Asia-Pacific, Europe, Latin America, the Middle East, Africa, and North America. While online survey methodology allows for tremendous scale and global reach, it is limited in that it provides a perspective only on the habits of existing Internet users, not total populations. Results may therefore, among other possibilities, over-report online usage via computers, under-report traditional television usage, and/or under-report mobile media usage. Additionally, responses are only indicative of respondents’ beliefs about their own media usage, rather than actual metered data. Source: Nielsen Global Survey of Multi-Screen Media Usage, Q3 2011 *As reported by online consumers % Global Online Average How often have you watched video content on the following devices in the past 30 days?* 32 16 17 9 10 16 27 19 18 8 11 17 24 13 179 11 27 21 7 10 7 11 43 Computer at home Television at home More than once a day Once a day A few times a week Once a week Less than once a week Have not watched video on this device in the past 30 days Online, through the Internet (on any device) Mobile phone 18 10 11 6 10 45 6 5 9 13 7 64 5 4 10 9 9 59 4 5 10 7 9 63 Computer at work Portable DVD Player Handheld multimedia device - not a phone (e.g. iPodTouch, PSP) Through a DVR or digital video recorder such asTiVo 4 4 7 6 8 72 4 3 8 7 13 66 3 4 9 7 10 67 3 4 7 6 8 72 3 3 8 6 11 69 Tablet Device (e.g., Apple iPad) Public computer (e.g. Library, Internet Café, Gym) Through an in-home video game system (e.g. Playstation 3 or Xbox 360) E-book Reader (e.g. Amazon Kindle) TV or DVD player in a car
  • 4.
    4 Copyright ©2012 The Nielsen Company. Reported online and mobile video viewing is on the rise While the in-homeTV and computer are still the most popular devices to watch video content, usage and growth in online and mobile technologies is making a sustained impact.Three-quarters (74%) of global respondents report watching video via the Internet (on any device), up four points since 2010, and over half of global online consumers (56%) say they watch video on a mobile phone at least once a month and 28 percent at least once a day. Mobile video is particularly prominent inAsia-Pacific and Middle East/African regions, where 74 and 72 percent of online consumers, respectively, report watching video on mobile phones at least once a month, and almost 40 percent (38% and 37%, respectively) say they do so at least once a day.While mobile video is currently less prominent in NorthAmerica than in other parts of the world, it is seeing the highest growth rates in mobile phone video consumption. Thirty-eight percent of NorthAmerican respondents say they watch mobile video once a month, up eight points compared to the 2010 reported results. “The convenience of mobile connectivity has revolutionized how people are engaging with digital content and each other around the world,” said DouniaTurrill, SVP, Client Insights, Nielsen. “With the growth of smartphones, mobile video consumption is on the rise for entertainment content, particularly in emerging markets where many consumers leapfrog home Internet altogether in favor of the all-in-one smartphone.” % Usage and growth in online and mobile technologies* 2010 2011 Watched video content at least once a month COMPUTER AT HOME 86 84 90 83 TV AT HOME 55 56 MOBILE PHONE 70 74 ONLINE (ANY DEVICE) Source: Nielsen Global Survey of Multi-Screen Media Usage, Q3 2011 *As reported by online consumers
  • 5.
    Copyright © 2012The Nielsen Company. 5 Smartphones are increasingly popular. Are tablets next? Online video consumption is likely to continue its rise, as consumers are increasingly connecting to the Internet at high speeds. More than half (57%) of online respondents around the world indicate they own a computer with high-speed online access—an increase offour points since 2010, and an additional 16 percent say they plan to purchase one within the next year. Global Online Average Do you currently own or will you purchase any of these items in the next 12 months?* Computer with high-speed Internet connection Smartphone High-DefinitionTelevision Set (HDTV) DVR (DigitalVideo Recorder) Netbook Handheld multimedia device - not a phone (e.g. iPodTouch, PSP) TV with Internet Connection Stand alone device that connects myTV to the Internet Tablet E-book Reader 3DTelevision Set (3DTV) I already own I do not own and I definitely will purchase I do not own and I probably will purchase I do not own and I might or might not purchase I do not own and I probably will not purchase I do not own and I definitely will not purchase 57 7 9 11 6 10 36 9 12 14 10 19 35 9 14 15 11 17 23 7 12 17 15 26 20 6 10 17 17 31 19 6 11 17 17 30 17 9 14 19 16 25 13 8 14 20 17 29 12 7 12 19 17 32 10 5 10 17 21 37 6 9 14 21 18 32 Source: Nielsen Global Survey of Multi-Screen Media Usage, Q3 2011 *As reported by online consumers TV use is also poisedfor continued prominence, as global online consumers report owning or intending to purchase such technologies as high-definitionTVs (HDTVs) (58%), digitalvideo recorders (DVRs) (42%), connectedTVs (35%), and 3D-capable sets (29%).
  • 6.
    6 Copyright ©2012 The Nielsen Company. Portable devices and their impact on media consumption In the years ahead, mobile phones and other portable devices will affect media consumption, as global consumers with Internet access increasingly report owning or intending to purchase smartphones and Internet-connected tablets.Thirty-six percent of global online respondents report owning a smartphone—an Global smartphone ownership and purchase intentions* *As reported by online consumers Already Own “Definitely Will Purchase” in Next 12 Months “Probably Will Purchase” in Next 12 Months Potential Ownership in 12 Months GLOBAL 36% 9% 12% 57% ASIA-PACIFIC 44% 11% 15% 70% EUROPE 30% 5% 8% 43% MIDDLEEAST/ AFRICA 31% 13% 15% 59% LATINAMERICA NORTHAMERICA 26% 12% 11% 49% 31% 5% 9% 45% Source: Nielsen Global Survey of Multi-Screen Media Usage, Q3 2011 increase of 15 points since 2010. InAsia-Pacific markets, 44 percent of online consumers report owning a smartphone and another quarter will either definitely (11%) or probably (15%) purchase one in the next year. In Middle East/African markets, 31 percent of online respondents have a smartphone already, and nearly as many (28%) will likely buy one within a year.
  • 7.
    Copyright © 2012The Nielsen Company. 7 Tablet growth is poised for continued growth While tablets are an emerging category with lower levels of penetration than smartphones, global consumers are exhibiting increased interest around these devices. According to the survey findings, 12 percent of online respondents worldwide own a tablet today—up over 70 percent from the seven percent who reported ownership in 2010. Another 19 percent say they are likely to purchase a tablet within the next year. Adoption is highest in Asia-Pacific markets, where almost one of every five (18%) online consumers report ownership of a tablet and even more (27%) plan to purchase one within 12 months. “The impact of mobile technology can be felt around the globe and touches all aspects of life, from entertainment and shopping to business and personal communication,” said Amilcar Pérez, President, Telecom, Nielsen. “In recent years, smartphones and tablets, with their accessibility, vibrant screens and Internet access, have propelled us further forward into a new and exciting digital age. This has been felt around the globe and has enabled connections in all markets, particularly emerging markets, like never before.” Global tablet ownership and purchase intentions* *As reported by online consumers Already Own “Definitely Will Purchase” in Next 12 Months “Probably Will Purchase” in Next 12 Months Potential Ownership in 12 Months GLOBAL 12% 7% 12% 31% ASIA-PACIFIC 18% 9% 18% 45% EUROPE 6% 3% 7% 16% MIDDLEEAST/ AFRICA 13% 8% 12% 33% LATINAMERICA NORTHAMERICA 5% 12% 10% 27% 7% 4% 8% 19% Source: Nielsen Global Survey of Multi-Screen Media Usage, Q3 2011
  • 8.
    8 Copyright ©2012 The Nielsen Company. Online consumers from Asia-Pacific and Middle East/African markets are also largely willing to try mobile payments, with almost 40 percent (37% and 39%, respectively) reporting that they either definitely or probably would buy goods and services with mobile payment technology. In North America, consumers are relatively less open to mobile payments than other regions. One-fourth of North American respondents probably or definitely would try mobile phone purchase methods, which has increased seven percentage points since 2010, when only 18 percent of North American online consumers were open to the idea. Mobile phone payments are a viable option for many The practice of using a mobile phone to make purchases in stores and restaurants in lieu of cash, check, or credit/bank cards shows strong potential. Almost two-thirds (63%) of global online respondents are open to the idea of making payments via mobile phones, with 24 percent likely to do so, and 11 percent fully committed to the idea. Latin Americans with Internet access are the most likely to consider mobile phone payments, with almost one-fifth (17%) definitely willing and another 34 percent likely open to the practice. If you had the capability to do so, would you use your mobile phone to make payments in shops and restaurants?* Source: Nielsen Global Survey of Multi-Screen Media Usage, Q3 2011 *As reported by online consumers I definitely would I probably would I might or might not I probably would not I definitely would not GLOBAL LATINAMERICA MIDDLEEAST/AFRICA ASIA-PACIFIC EUROPE NORTHAMERICA 18 13 2112 21 32 19 12 1421 20 19 28 24 2631 27 24 24 34 2425 23 17 17 1512 8 811
  • 9.
    Romania Russia Saudi Arabia Singapore South Africa SouthKorea Spain Sweden Switzerland Taiwan Thailand Turkey United Arab Emirates United Kingdom Ukraine United States Venezuela Vietnam About Nielsen Nielsen Holdings N.V. (NYSE: NLSN) is a global information and measurement company with leading market positions in marketing and consumer information, television and other media measurement, online intelligence, mobile measurement, trade shows and related properties. Nielsen has a presence in approximately 100 countries, with headquarters in New York, USA and Diemen, the Netherlands. For more information, visit www.nielsen.com. For more information visit www.nielsen.com Copyright © 2012The Nielsen Company. All rights reserved. Nielsen and the Nielsen logo are trademarks or registered trademarks of CZT/ACNTrademarks, L.L.C. Other product and service names are trademarks or registered trademarks of their respective companies. 12/4869 Countries in the Study: Argentina Australia Austria Belgium Brazil Canada Chile China Colombia Croatia Czech Republic Denmark Egypt Estonia Finland France Germany Greece Hong Kong Hungary India Indonesia Ireland Israel Italy Japan Latvia Lithuania Malaysia Mexico Netherlands New Zealand Norway Pakistan Peru Philippines Poland Portugal About the Nielsen Global Survey The Nielsen Global Survey of Multi- Screen Media Usage was conducted in August/September 2011 and polled more than 28,000 consumers in 56 countries throughout Asia-Pacific, Europe, Latin America, the Middle East, Africa and North America. The sample has quotas based on age and sex for each country based on their Internet users, and is weighted to be representative of Internet consumers and has a maximum margin of error of ±0.6%. This Nielsen survey is based on the behavior of respondents with online access only. Internet penetration rates vary by country. Nielsen uses a minimum reporting standard of 60 percent Internet penetration or 10M online population for survey inclusion. The Nielsen Global Survey was established in 2005.