Agenda
• Introduction toMDS
• Types of MDS
• Concepts
• Working of MDS
• Applications of MDS
• Advantages
• Limitations
3.
Introduction to MultidimensionalScaling
• Multidimensional Scaling (MDS) is a dimensionality
reduction and data visualization technique.
• Used to represent high-dimensional data in 2D or 3D space by
preserving the pairwise distances (dissimilarities) between
data points as much as possible.
4.
Example:
• If youhave data with many variables, MDS helps you to draw
it on a 2D or 3D map.
• where the distance between points still shows how similar
or different they are.
5.
Types of MDS
1.Metric MDS
• Preserves the actual numerical distances between items
• Assumes dissimilarity is interval or ratio-scaled
• Example: Distances between cities
2. Non-Metric MDS
• Preserves only the rank order of dissimilarities
• Useful when data is ordinal or qualitative.
• Example : Survey ratings of the product
6.
Concepts
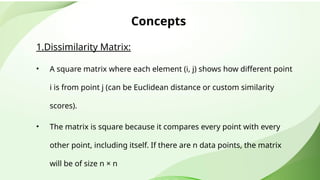
1.Dissimilarity Matrix:
• Asquare matrix where each element (i, j) shows how different point
i is from point j (can be Euclidean distance or custom similarity
scores).
• The matrix is square because it compares every point with every
other point, including itself. If there are n data points, the matrix
will be of size n × n
7.
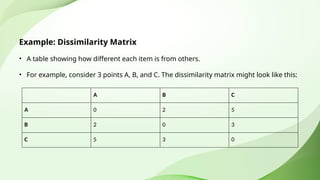
Example: Dissimilarity Matrix
•A table showing how different each item is from others.
• For example, consider 3 points A, B, and C. The dissimilarity matrix might look like this:
A B C
A 0 2 5
B 2 0 3
C 5 3 0
8.
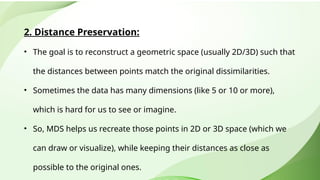
2. Distance Preservation:
•The goal is to reconstruct a geometric space (usually 2D/3D) such that
the distances between points match the original dissimilarities.
• Sometimes the data has many dimensions (like 5 or 10 or more),
which is hard for us to see or imagine.
• So, MDS helps us recreate those points in 2D or 3D space (which we
can draw or visualize), while keeping their distances as close as
possible to the original ones.
9.
Example:
Comparing school subjectsbased on how similar they are.
• Math and Physics are similar should be close on the map.
→
• Math and History are very different should be far apart.
→
• If the drawing matches these ideas, distance is preserved.
10.
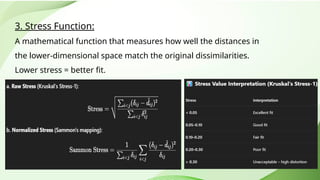
3. Stress Function:
Amathematical function that measures how well the distances in
the lower-dimensional space match the original dissimilarities.
Lower stress = better fit.
11.
Example:
Stress Function
Comparing booksby topic.
• Science and Math books should be close.
• Science and Story books should be far.
• If your 2D map shows Science and Story books close, stress is high.
• If the map is correct, stress is low.
12.
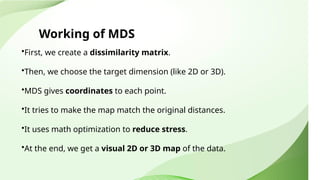
Working of MDS
•First,we create a dissimilarity matrix.
•Then, we choose the target dimension (like 2D or 3D).
•MDS gives coordinates to each point.
•It tries to make the map match the original distances.
•It uses math optimization to reduce stress.
•At the end, we get a visual 2D or 3D map of the data.
13.
Applications of MDS
•Data Visualization
• Psychology
• Market Research
• Bioinformatics
14.
Advantages
•Helps us tosee complex data in simple 2D or 3D format.
•Useful even when we only know the differences between things.
•Can be used with non-numeric data using Non-Metric MDS.
15.
Limitations
•Computationally expensive forlarge datasets.
•It might not capture all global structures(Big Picture Patterns).
•Sensitive to noise or missing data in the dissimilarity matrix.