
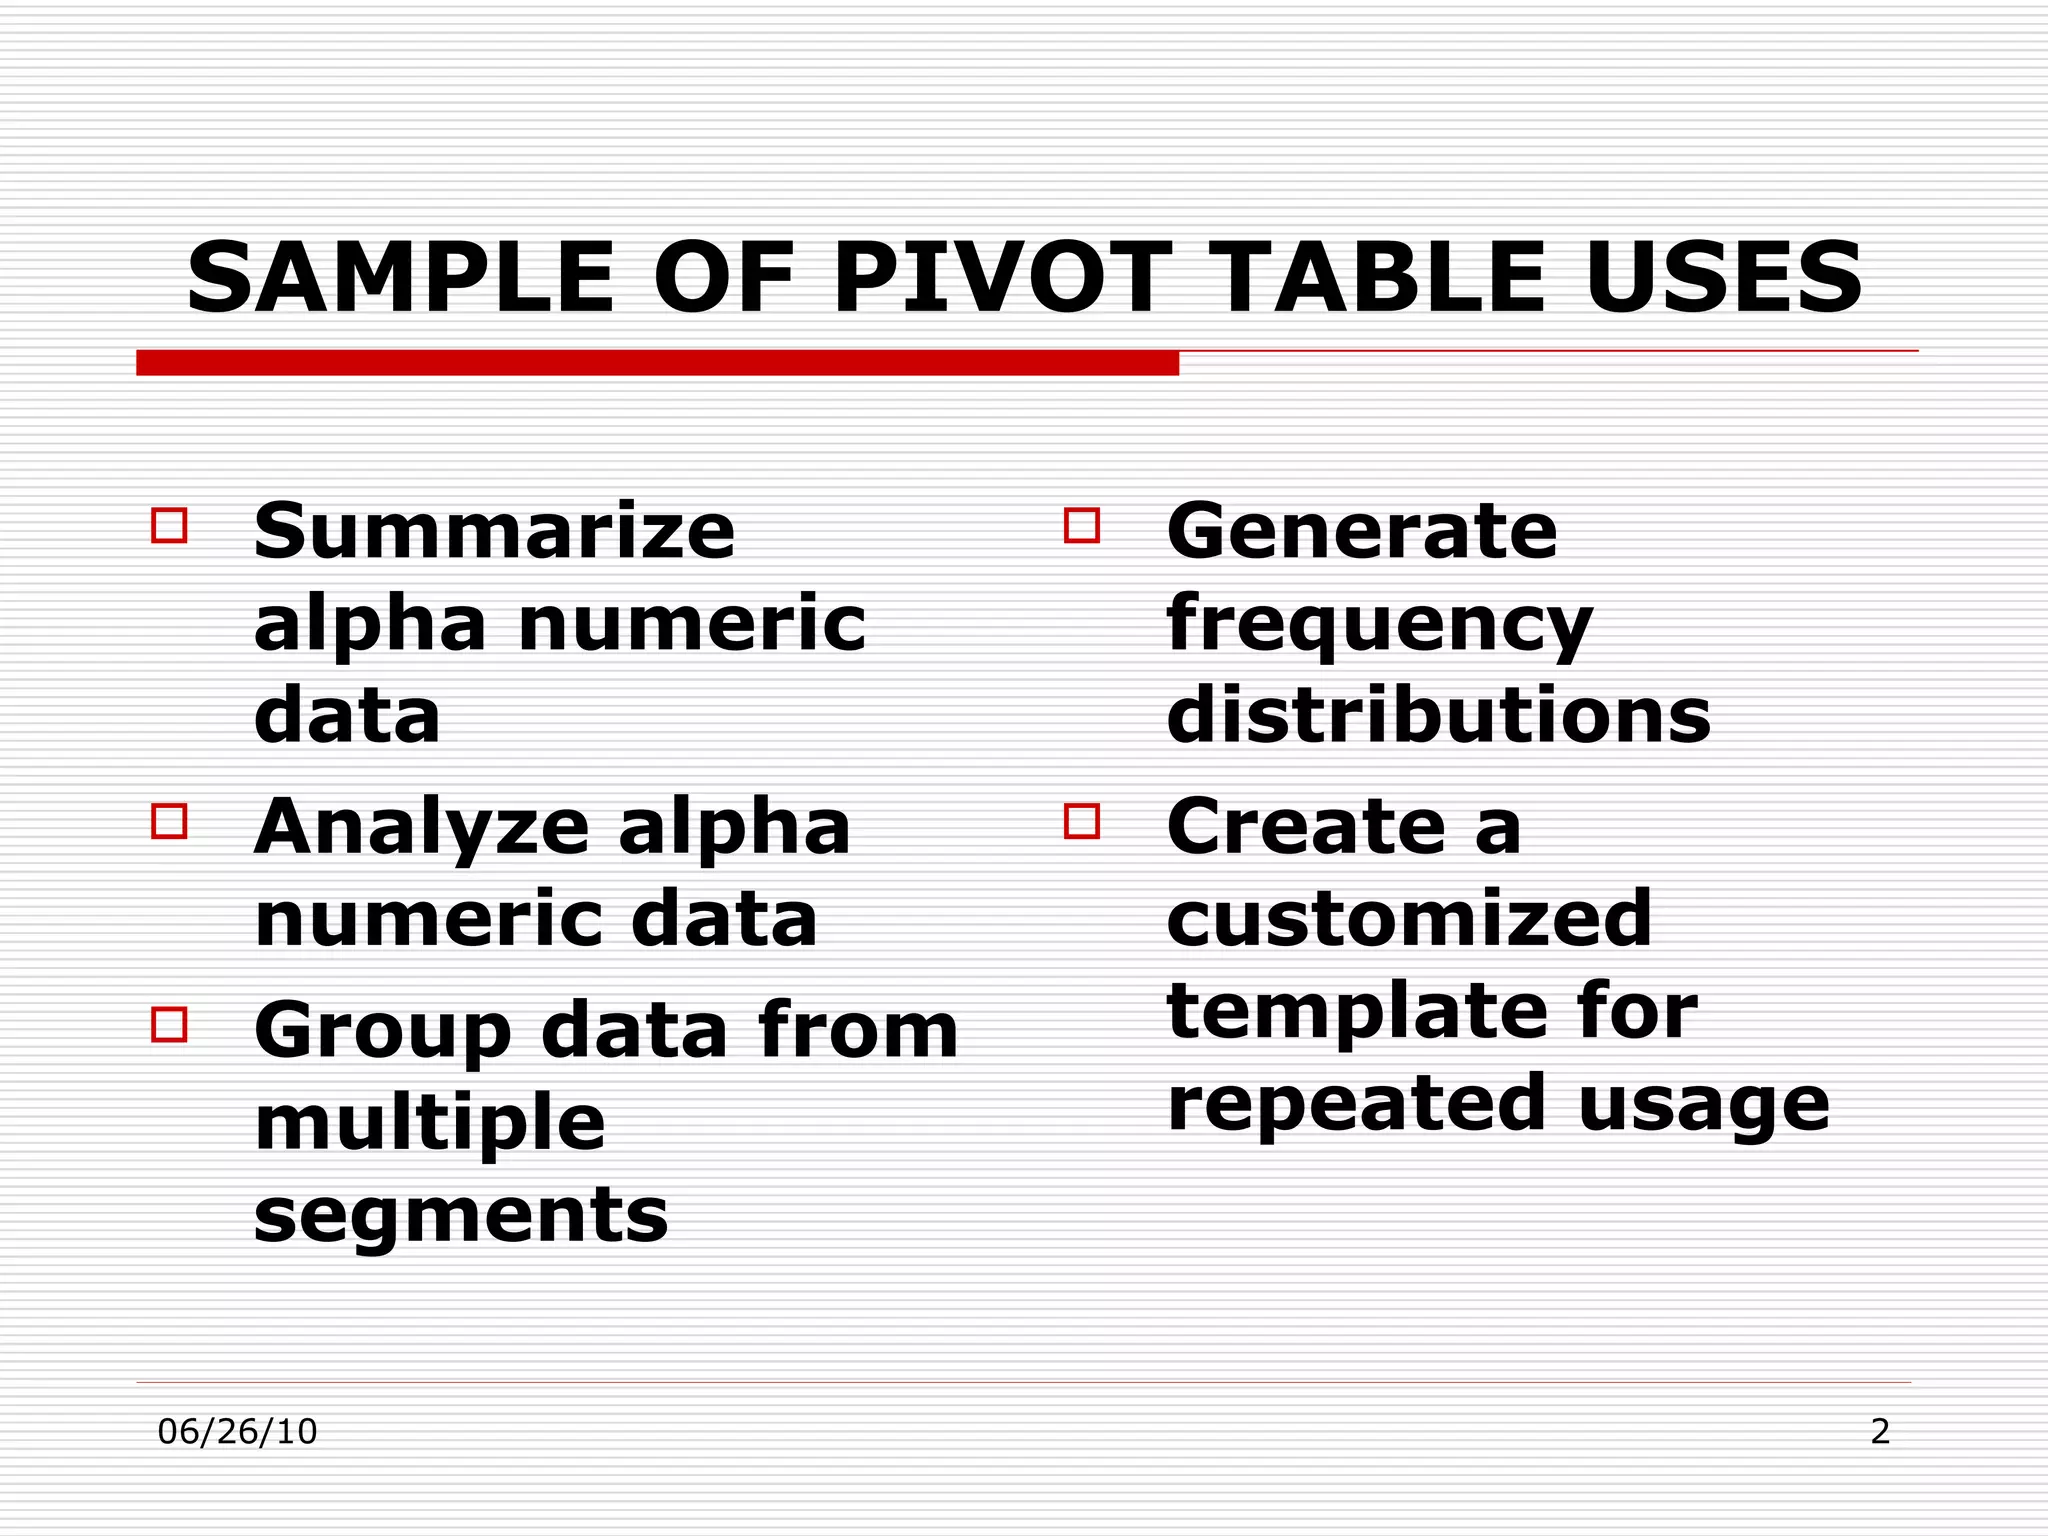
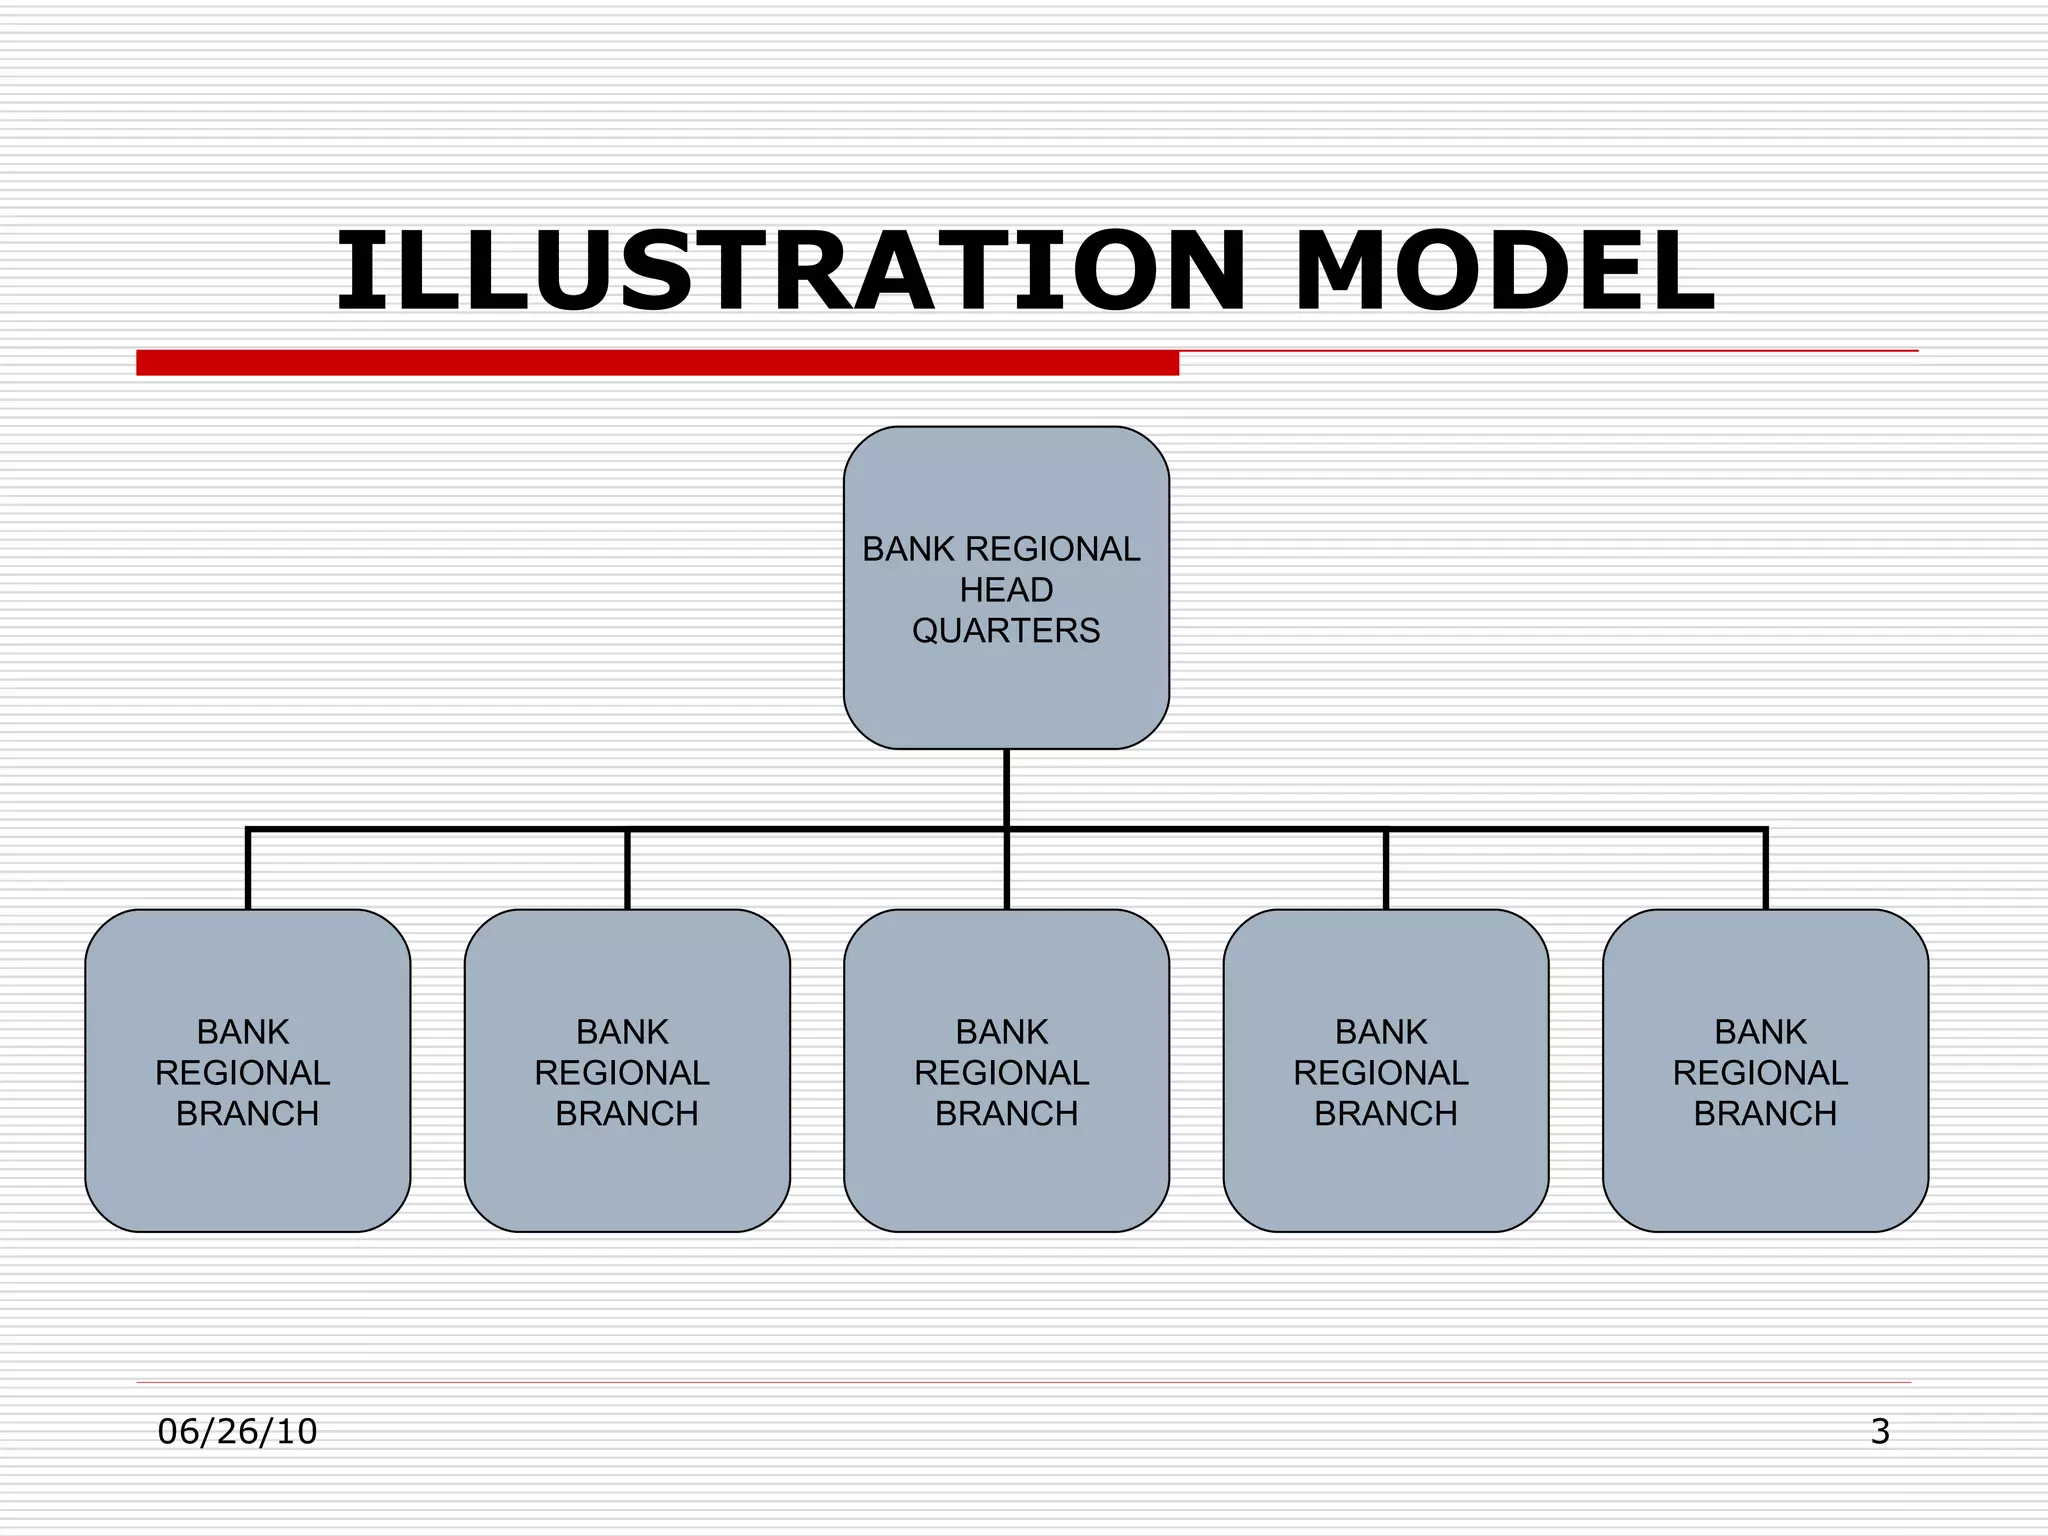
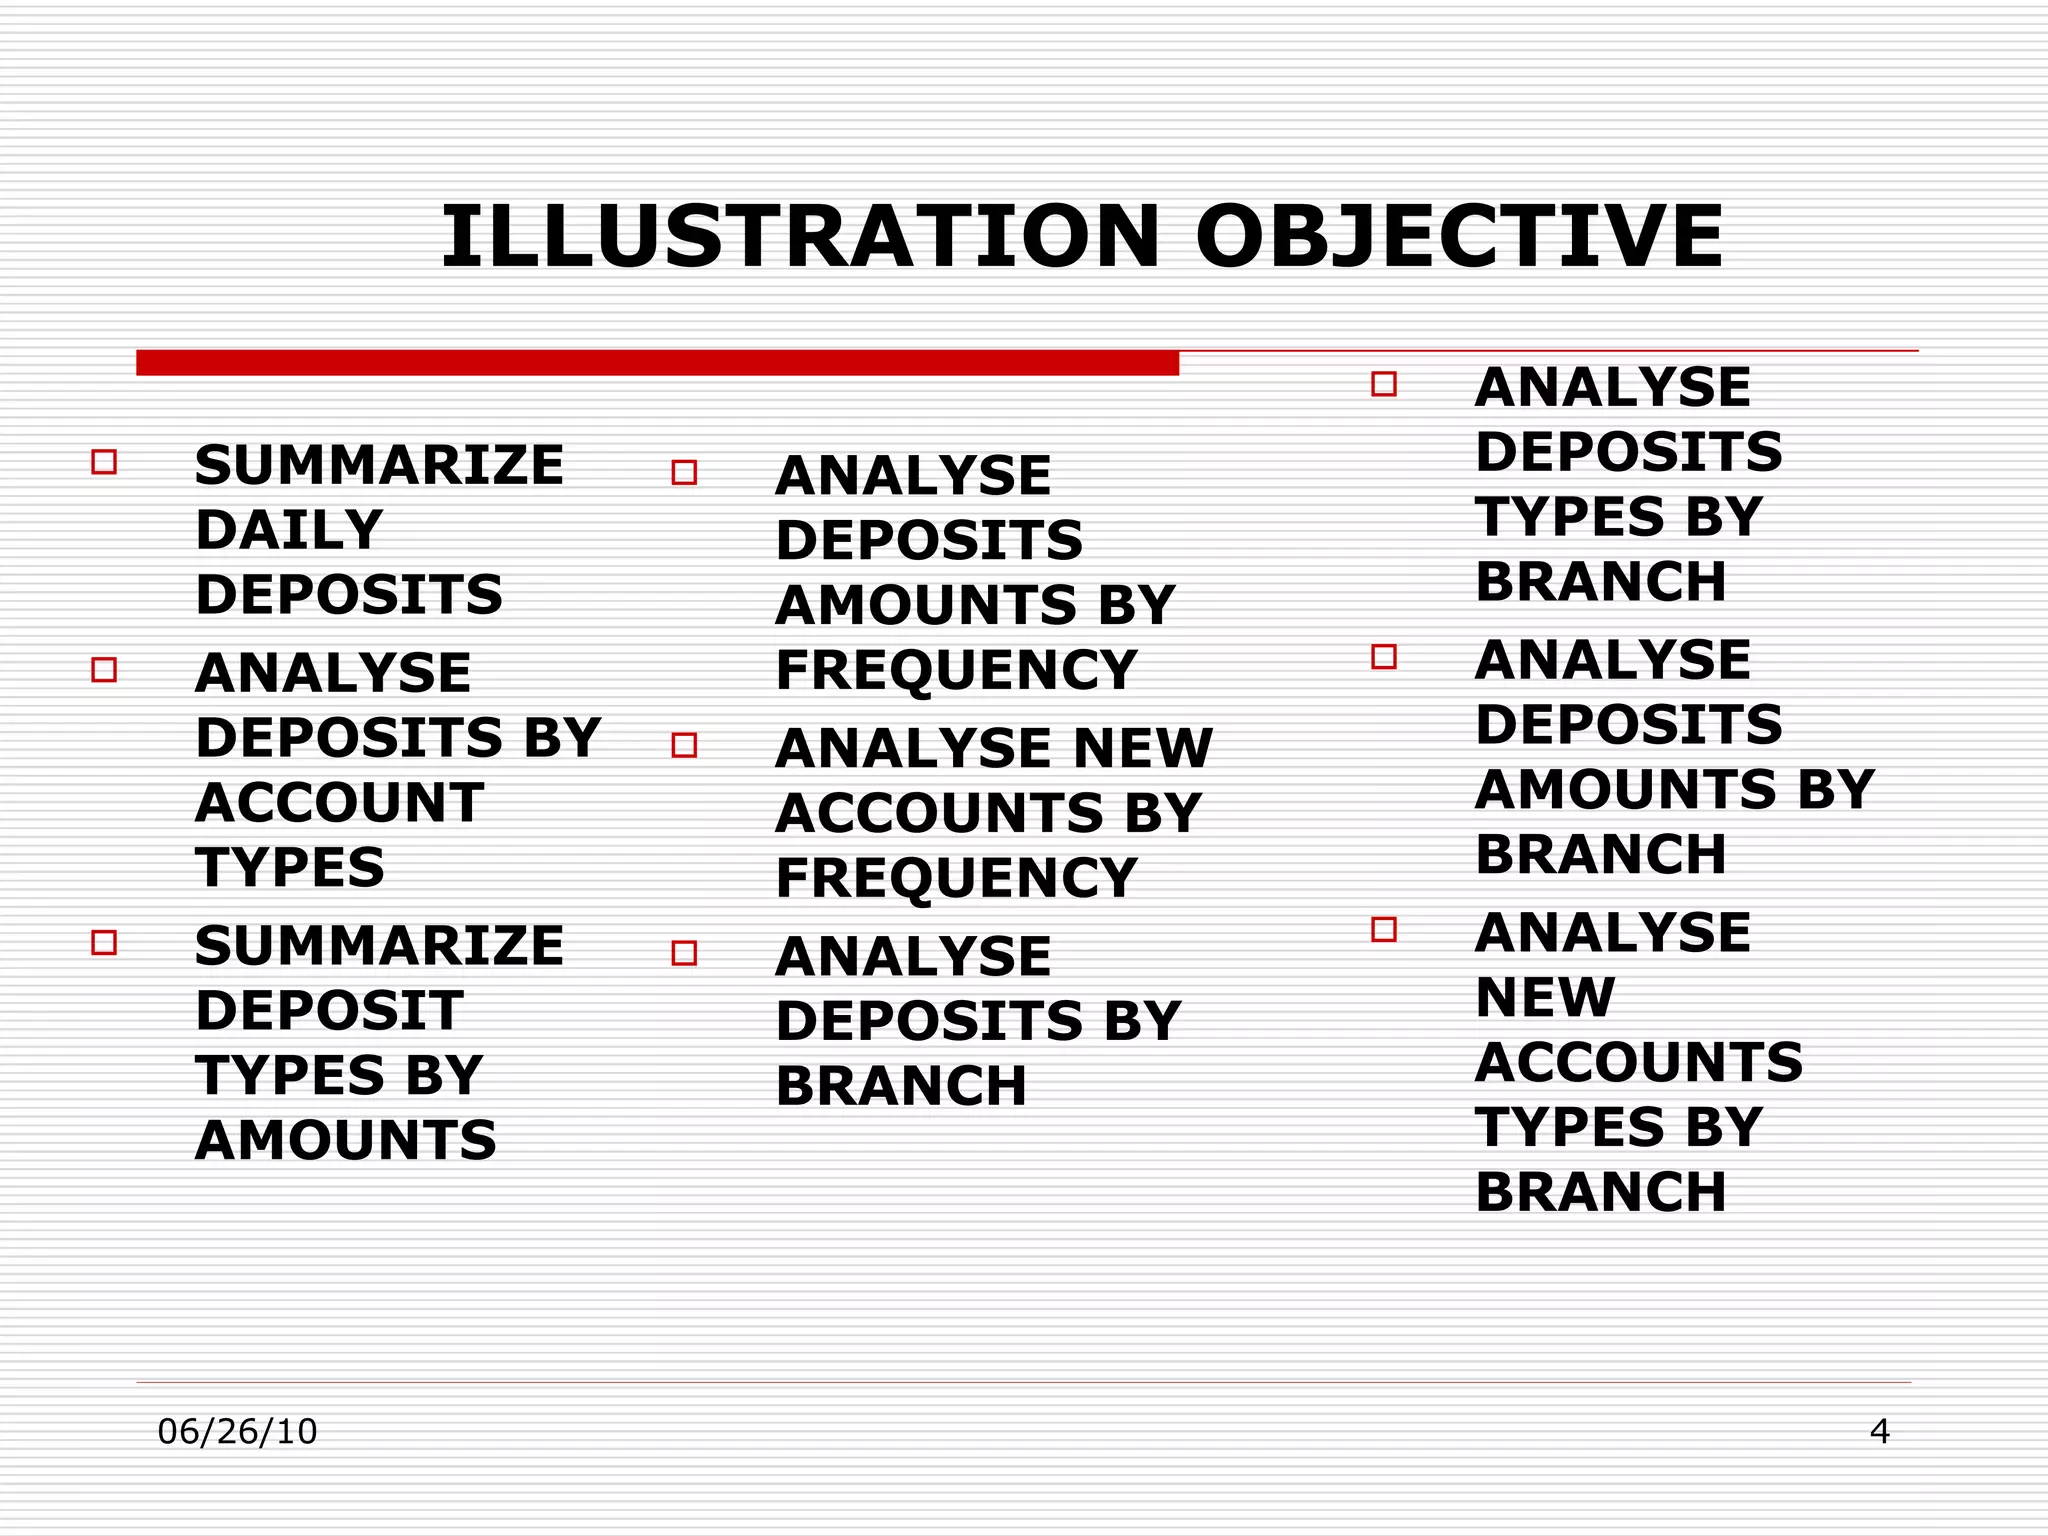
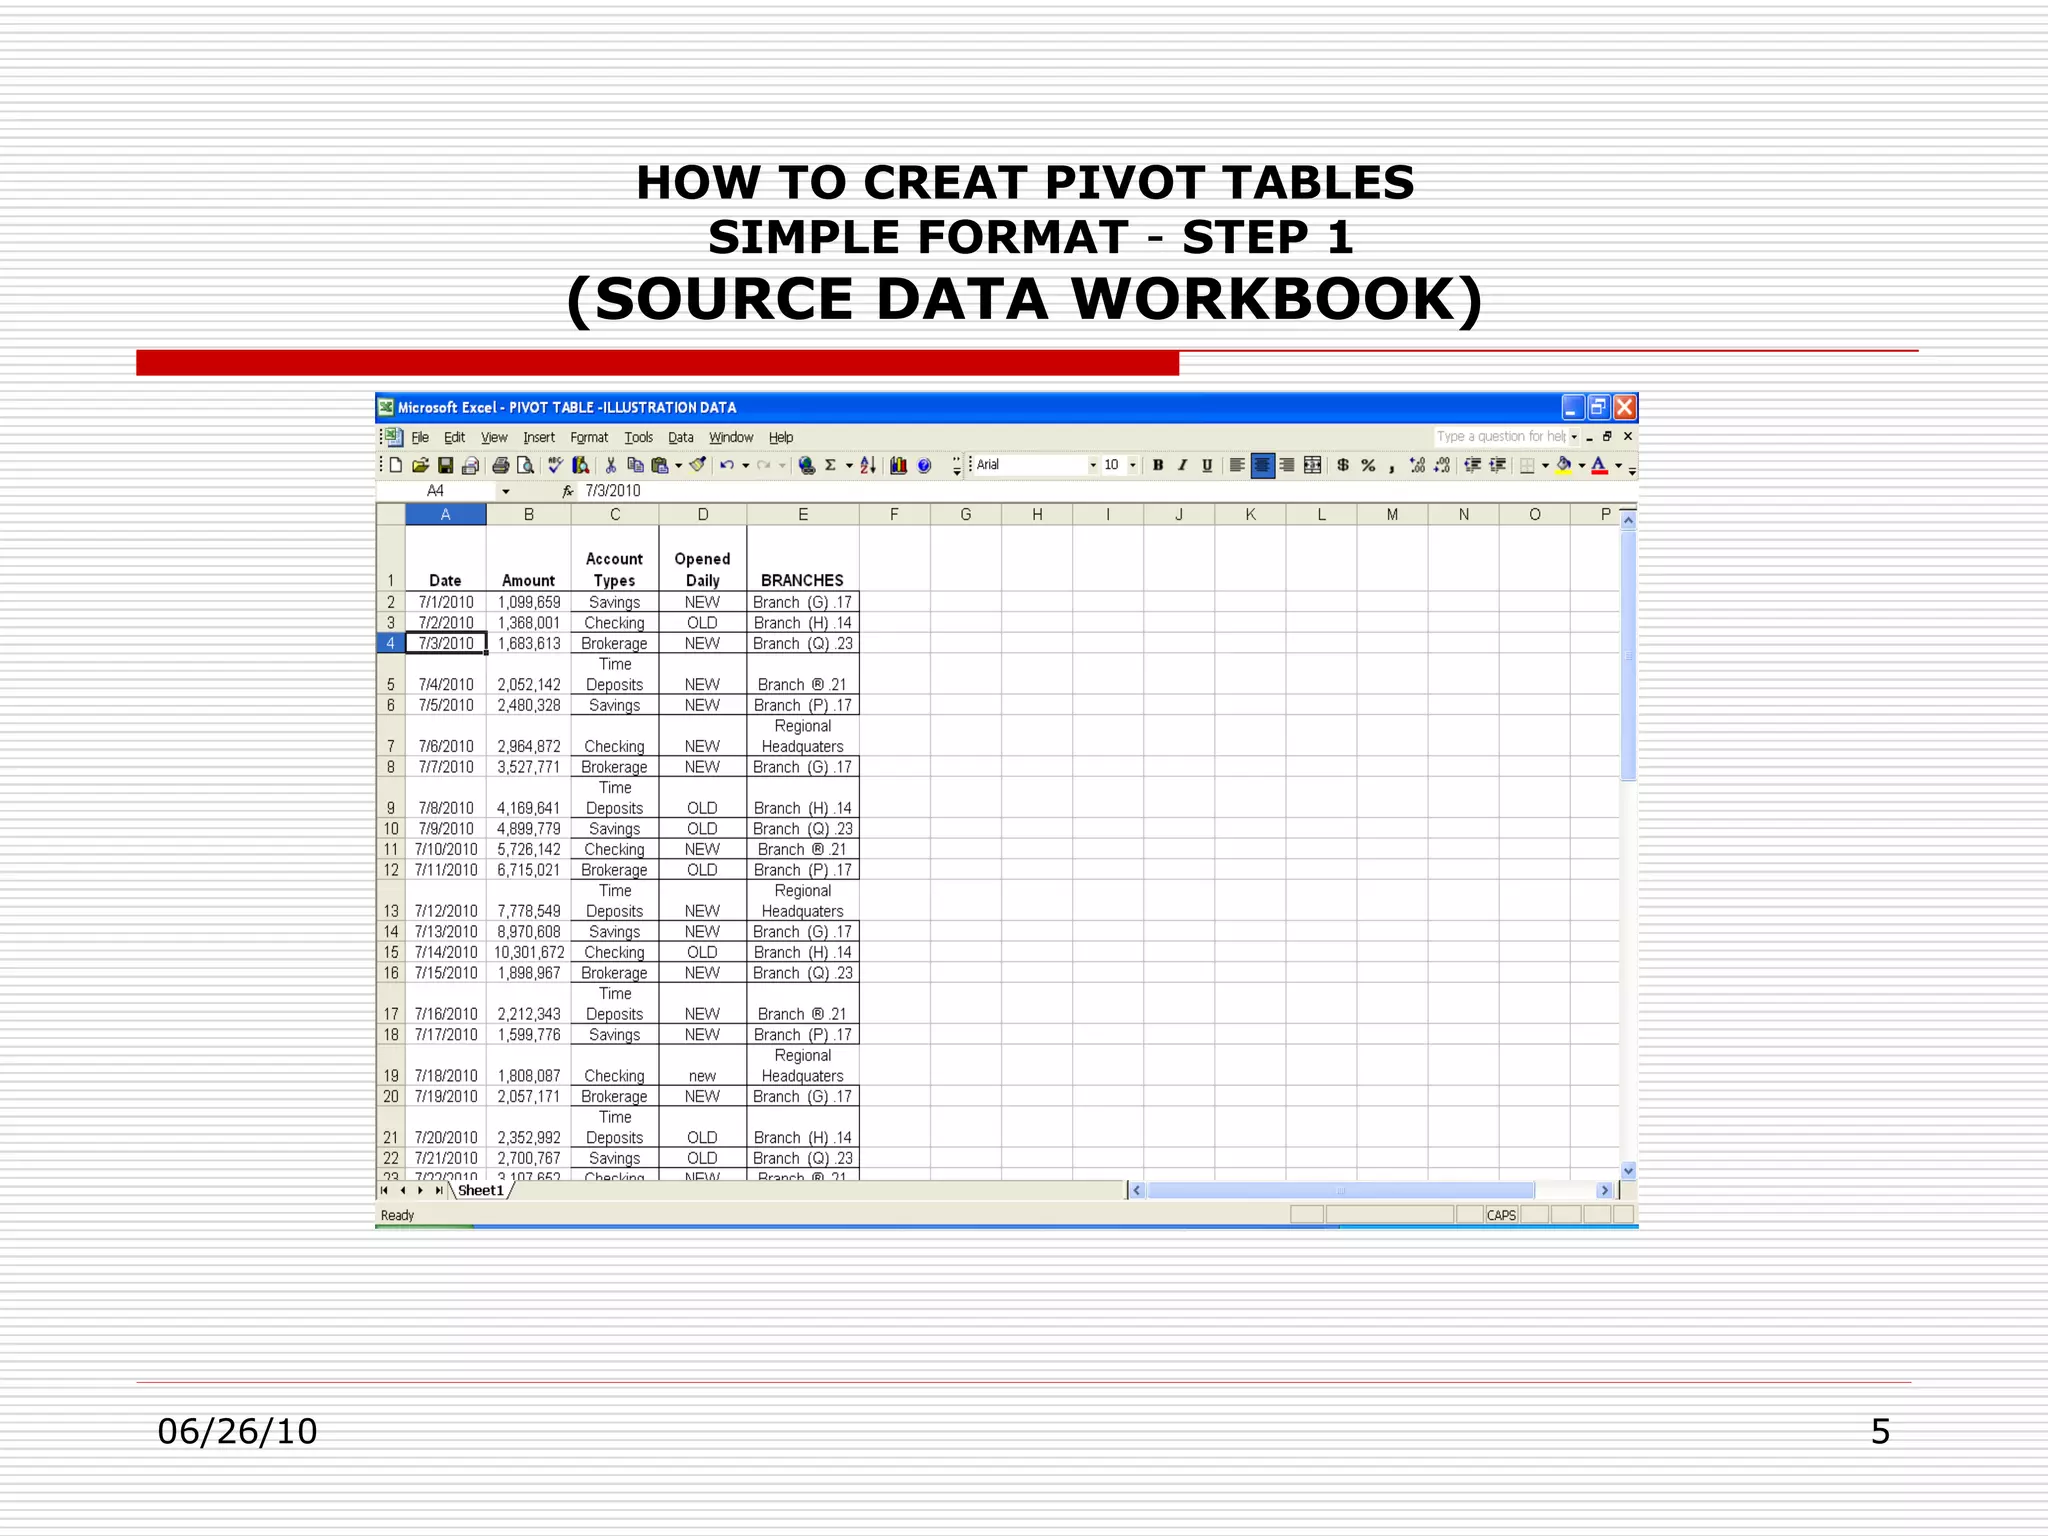
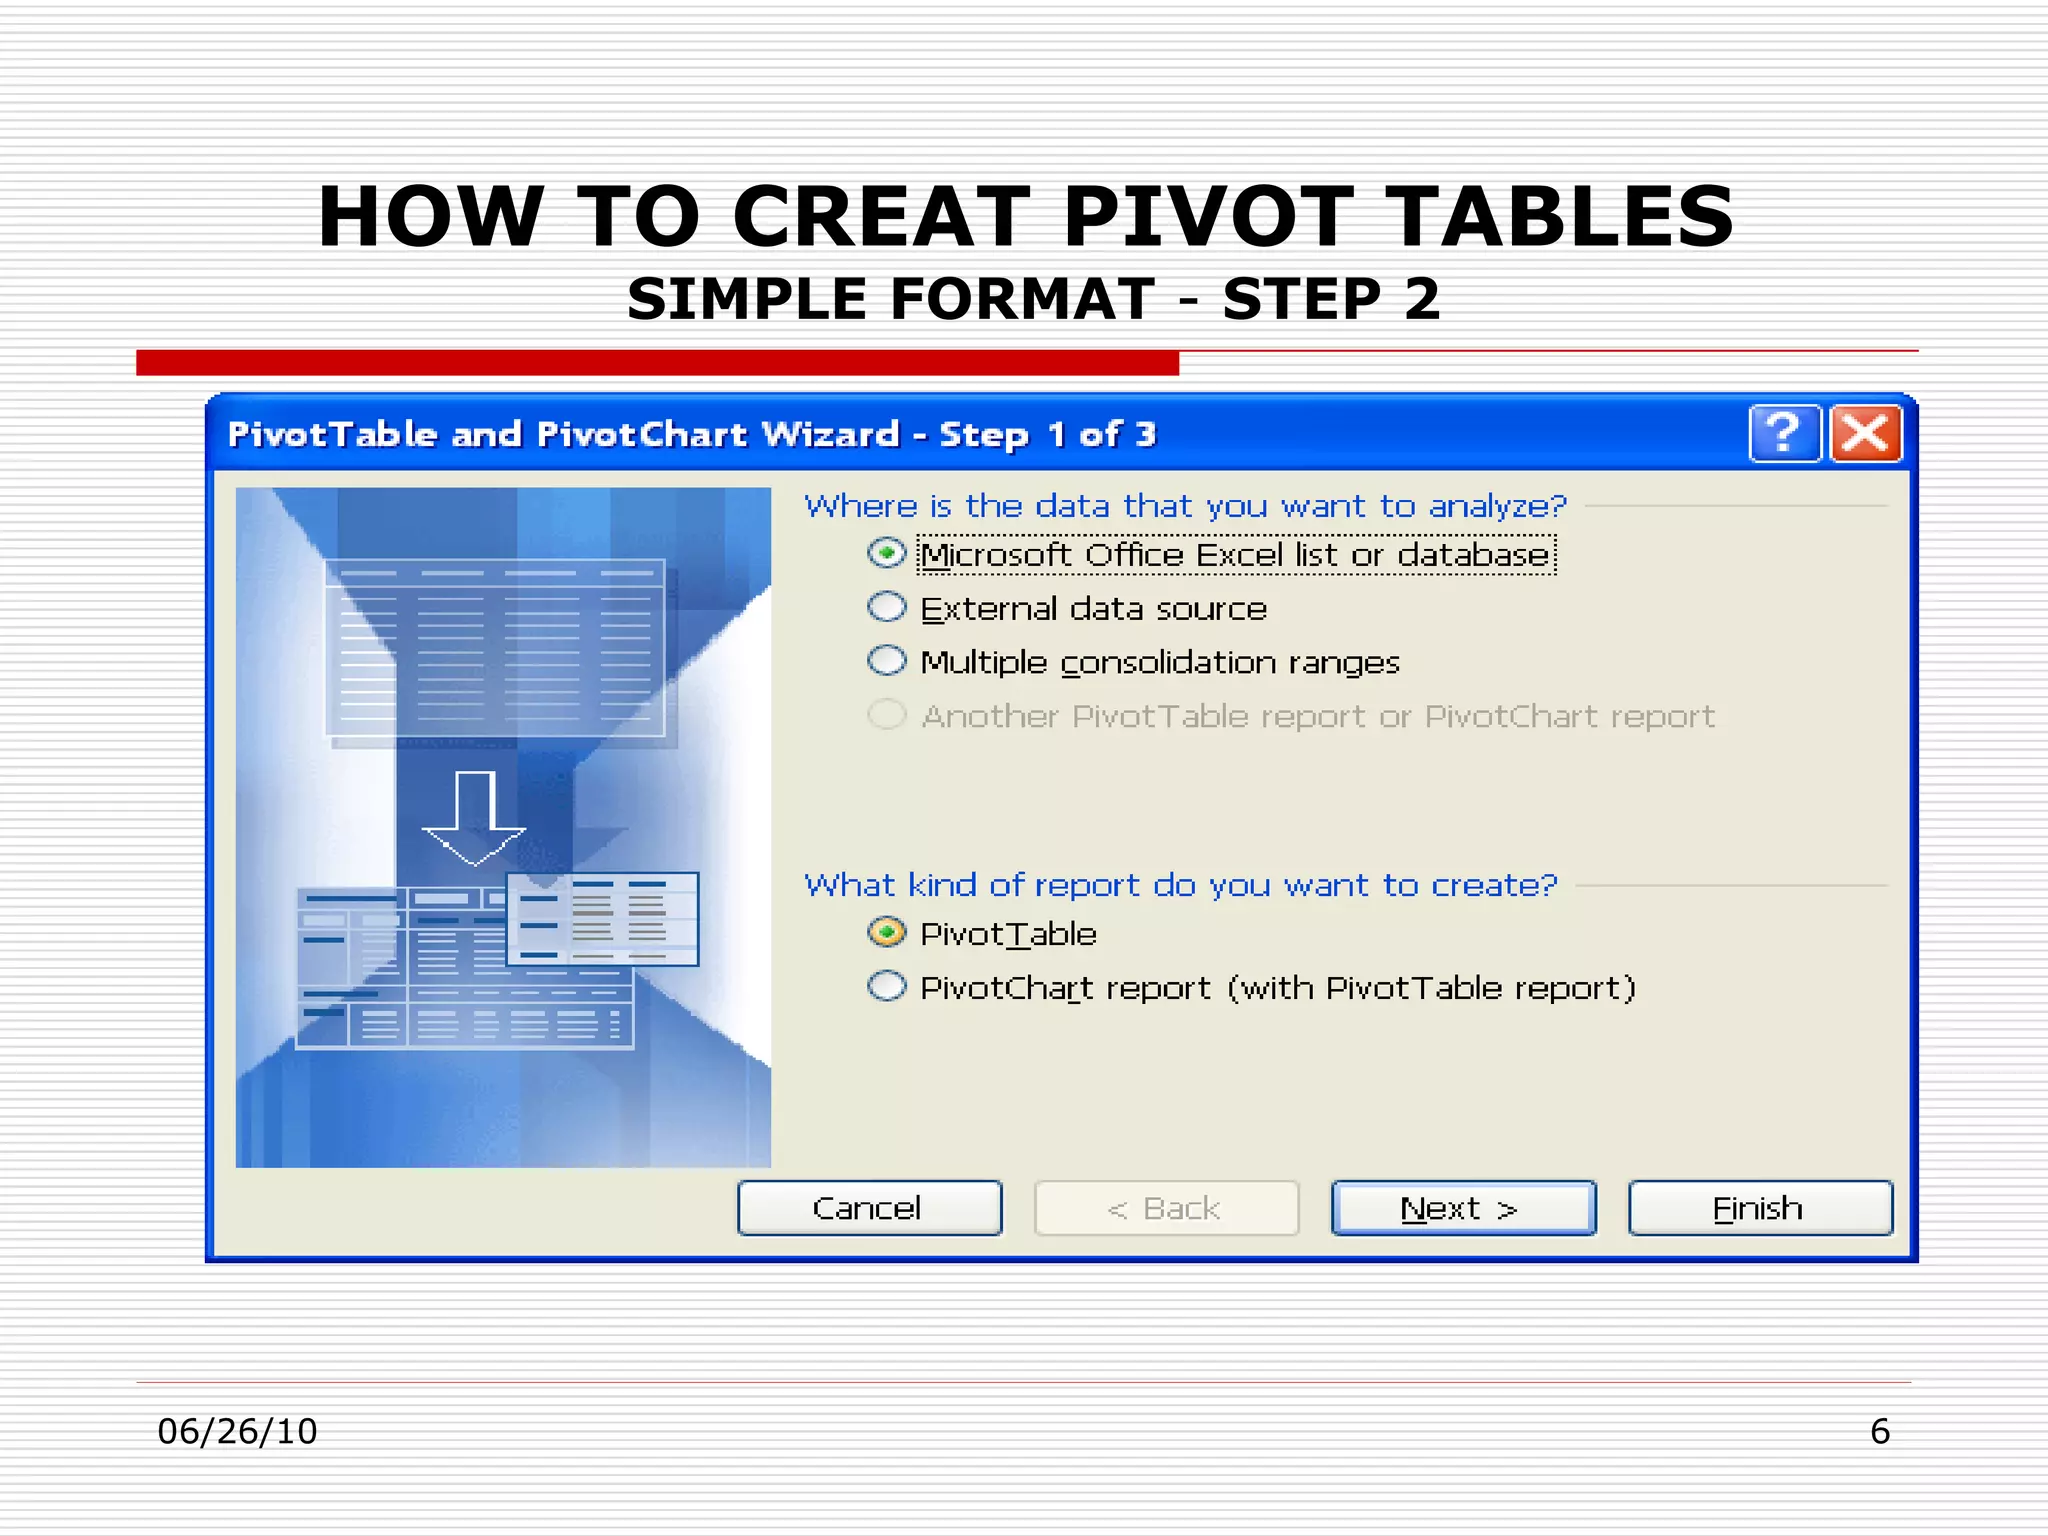
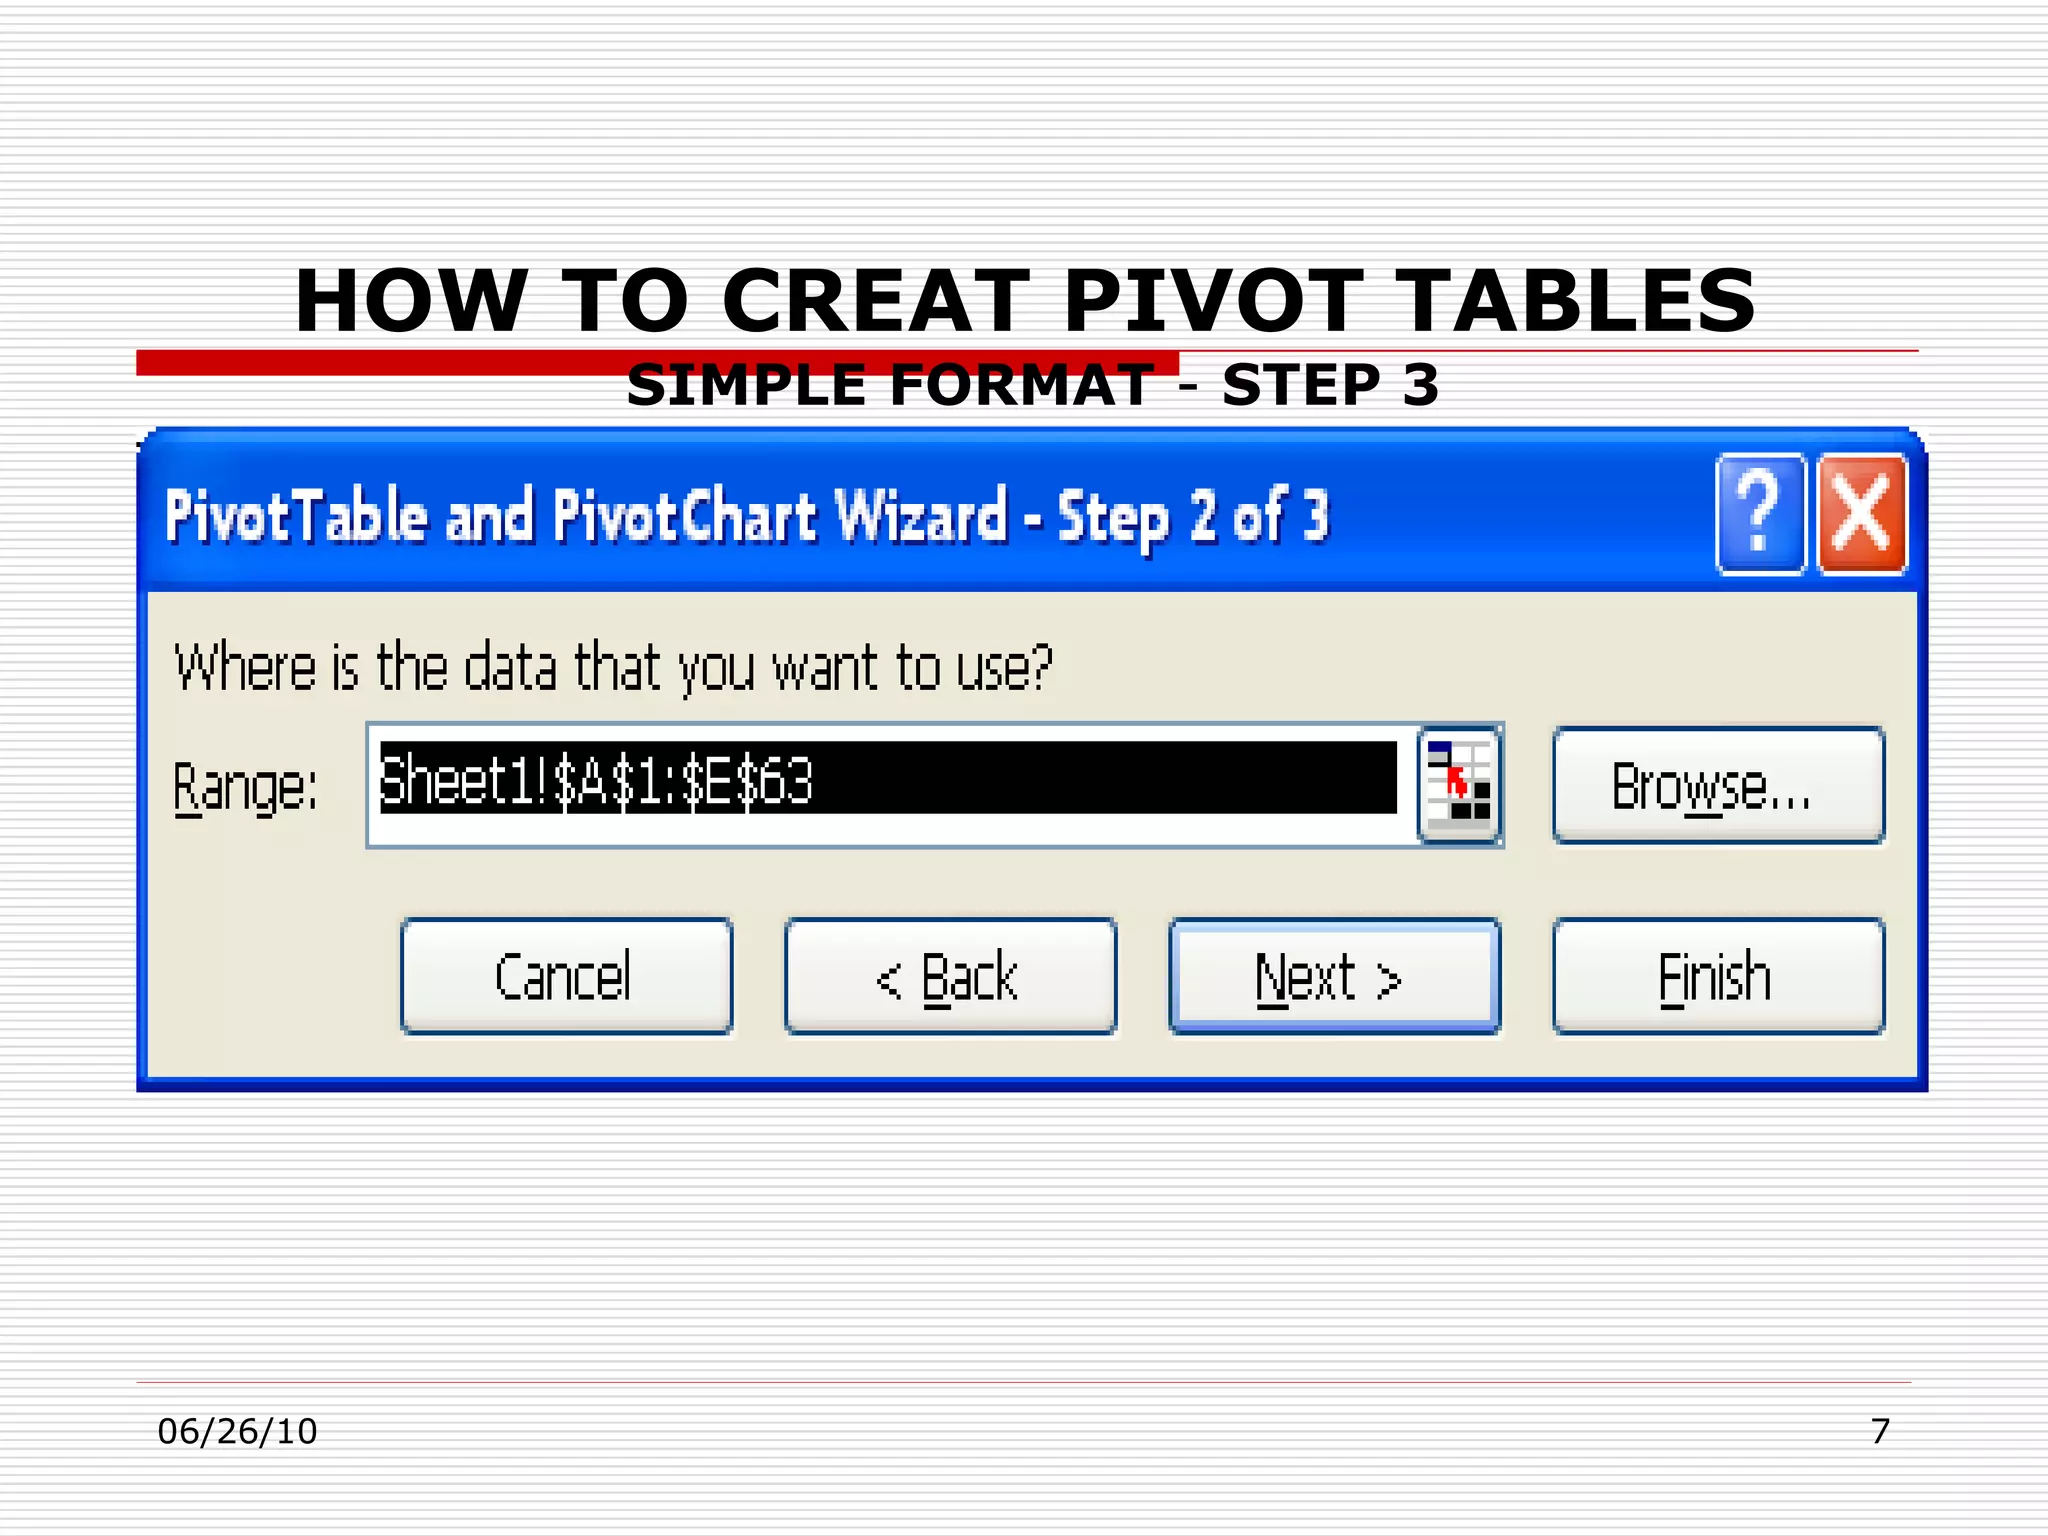
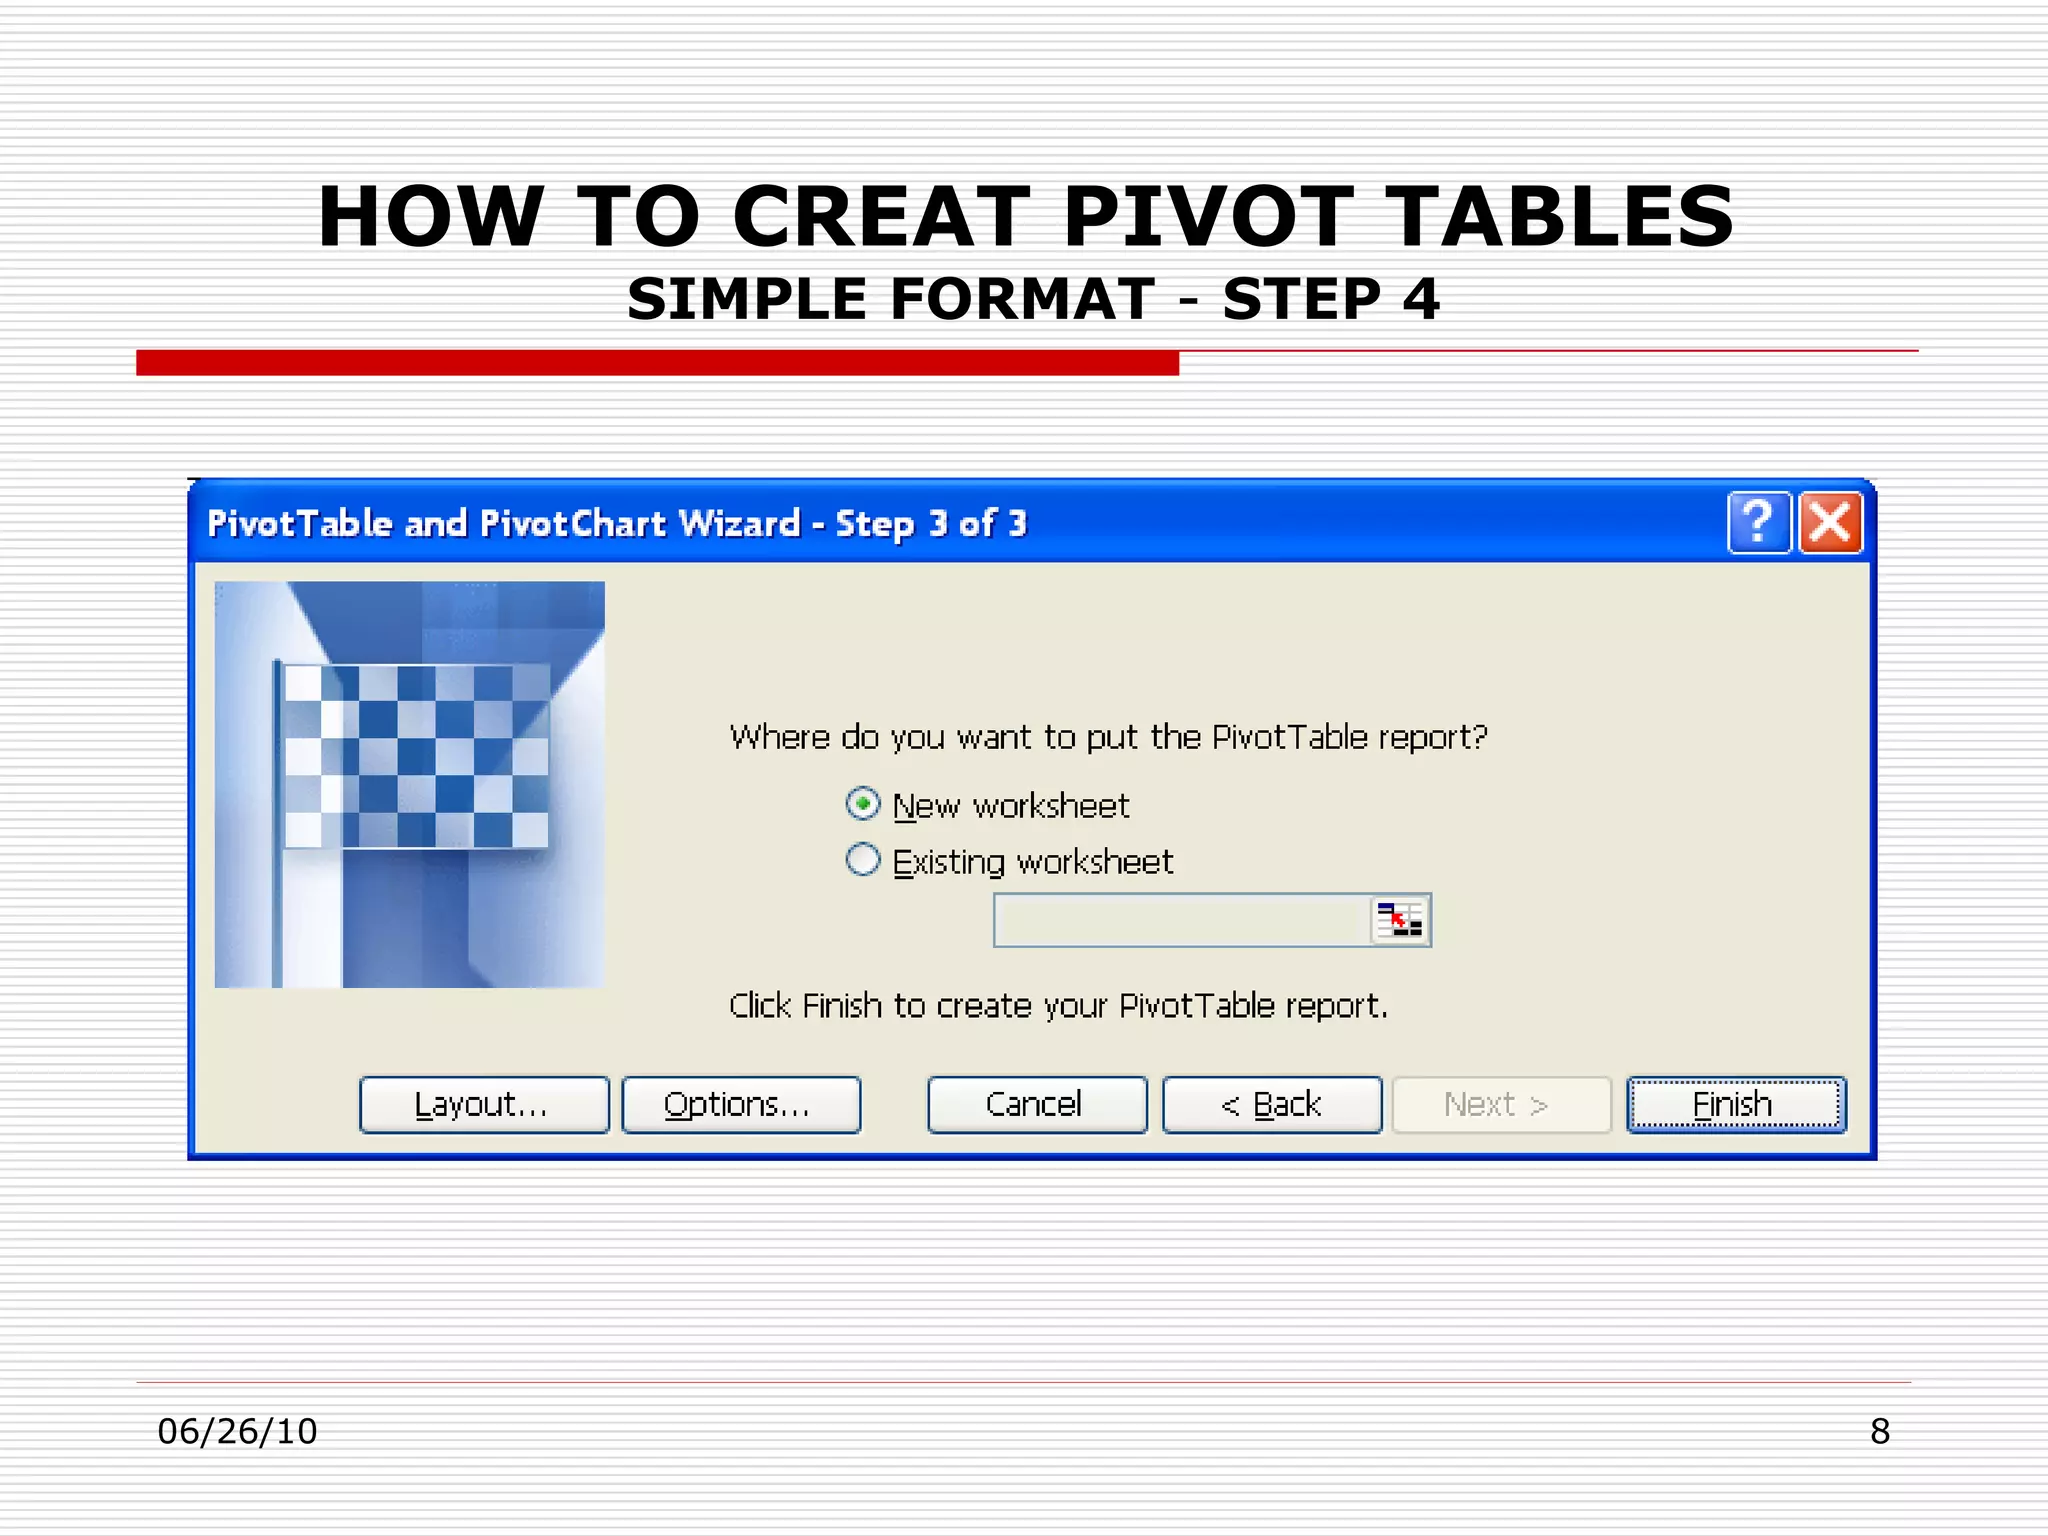
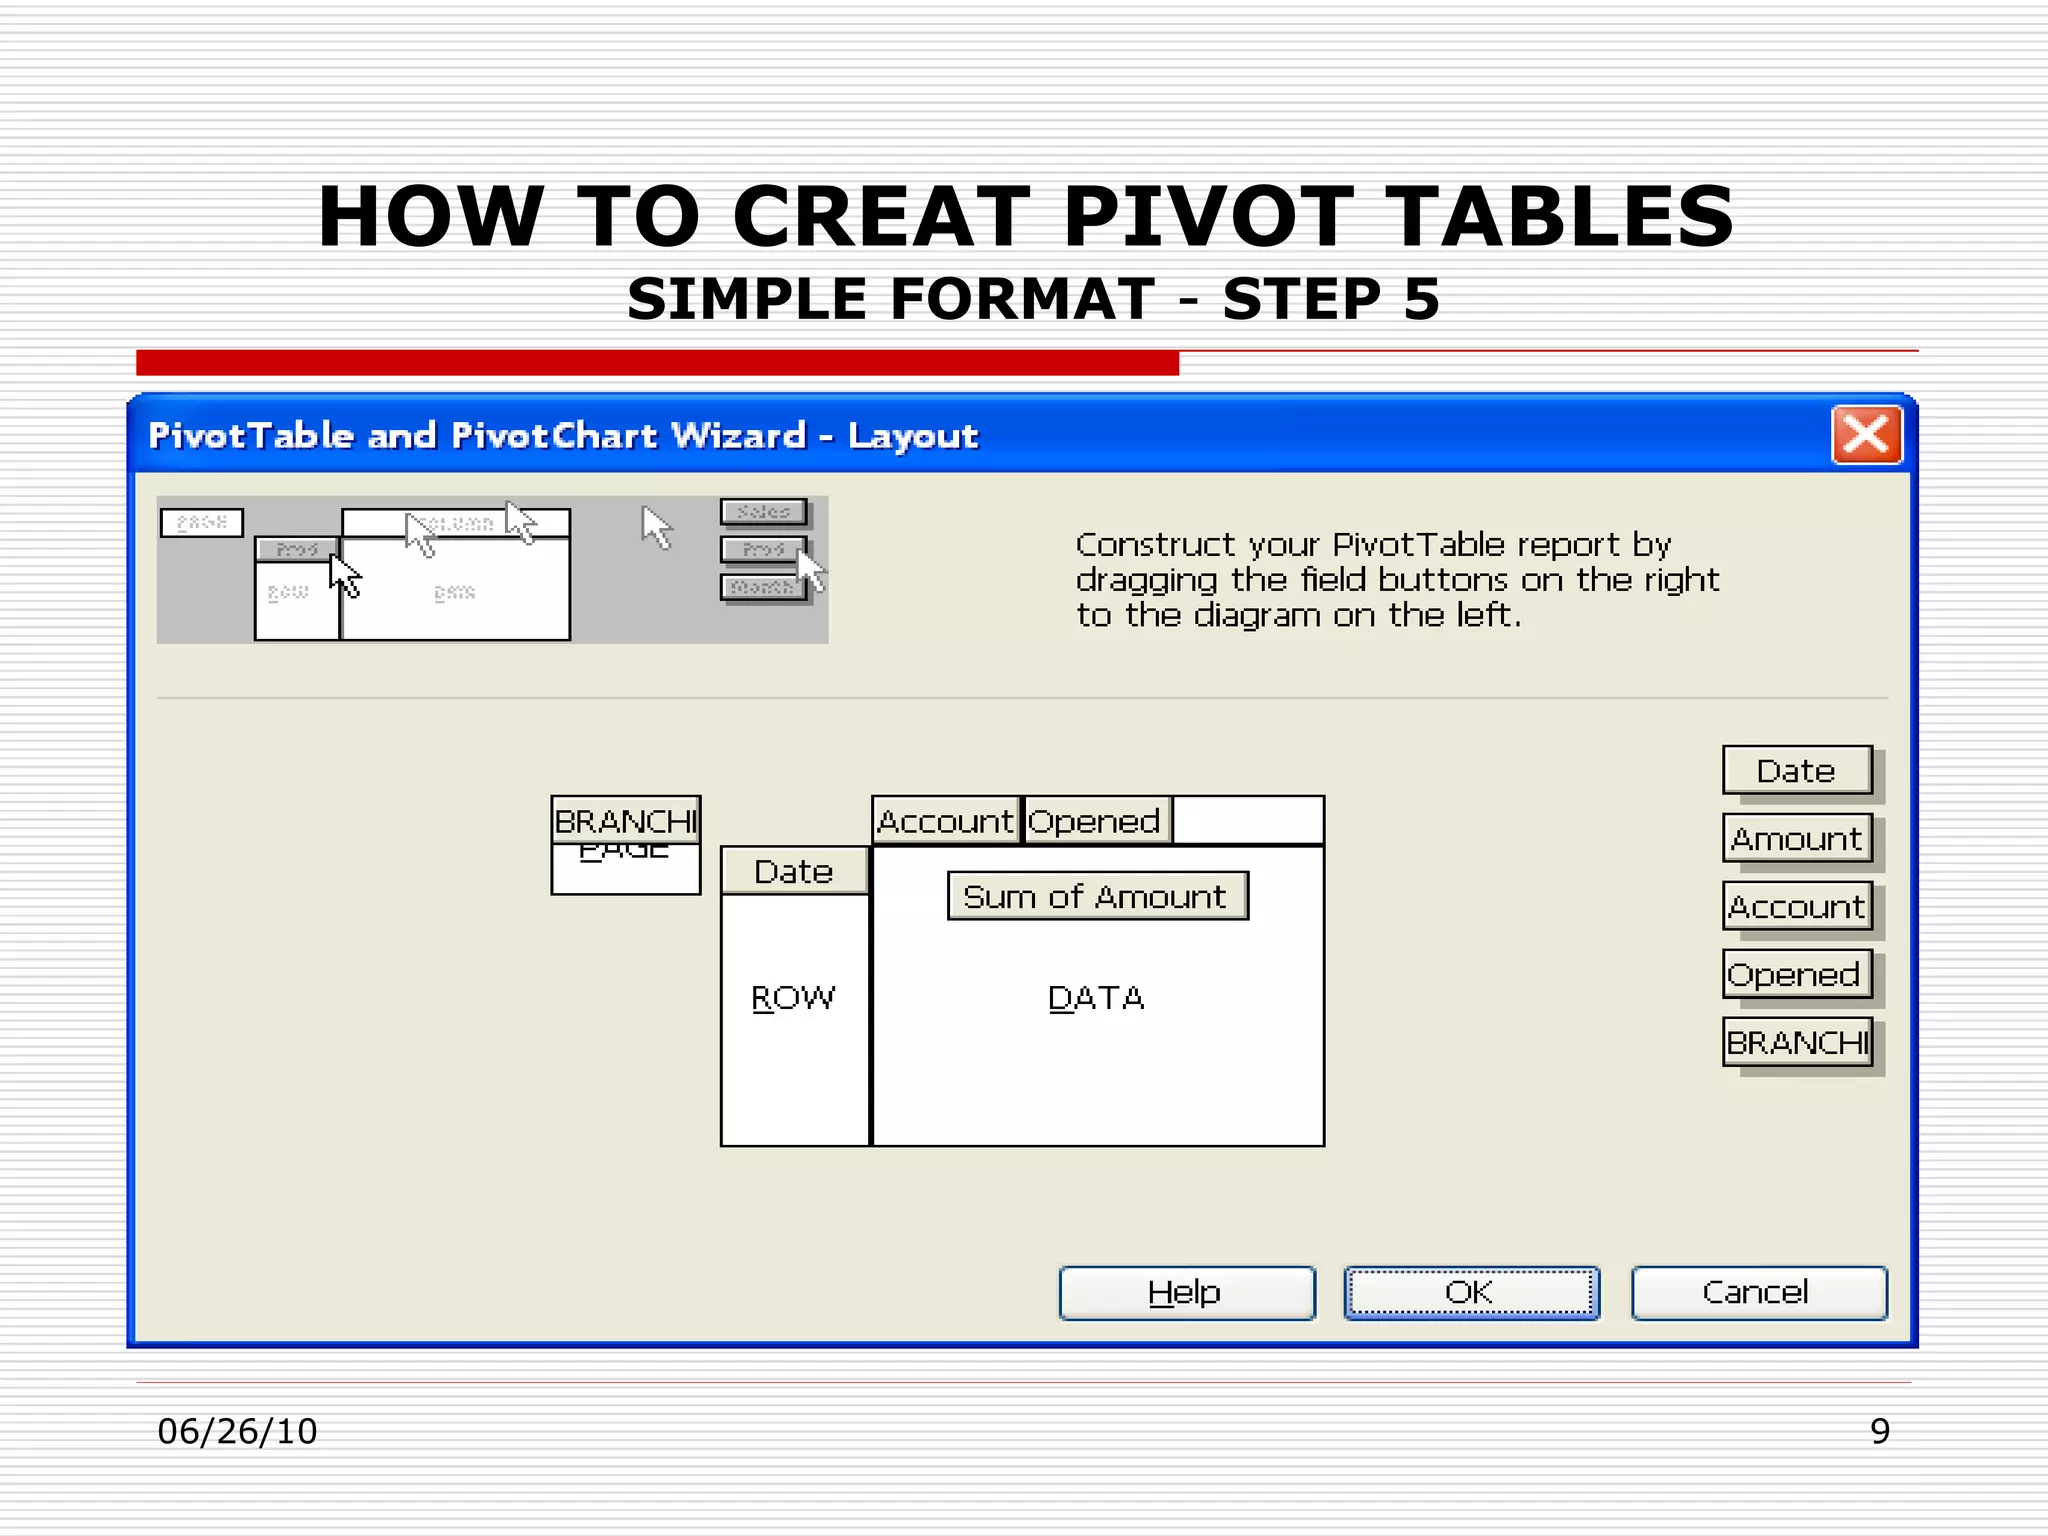
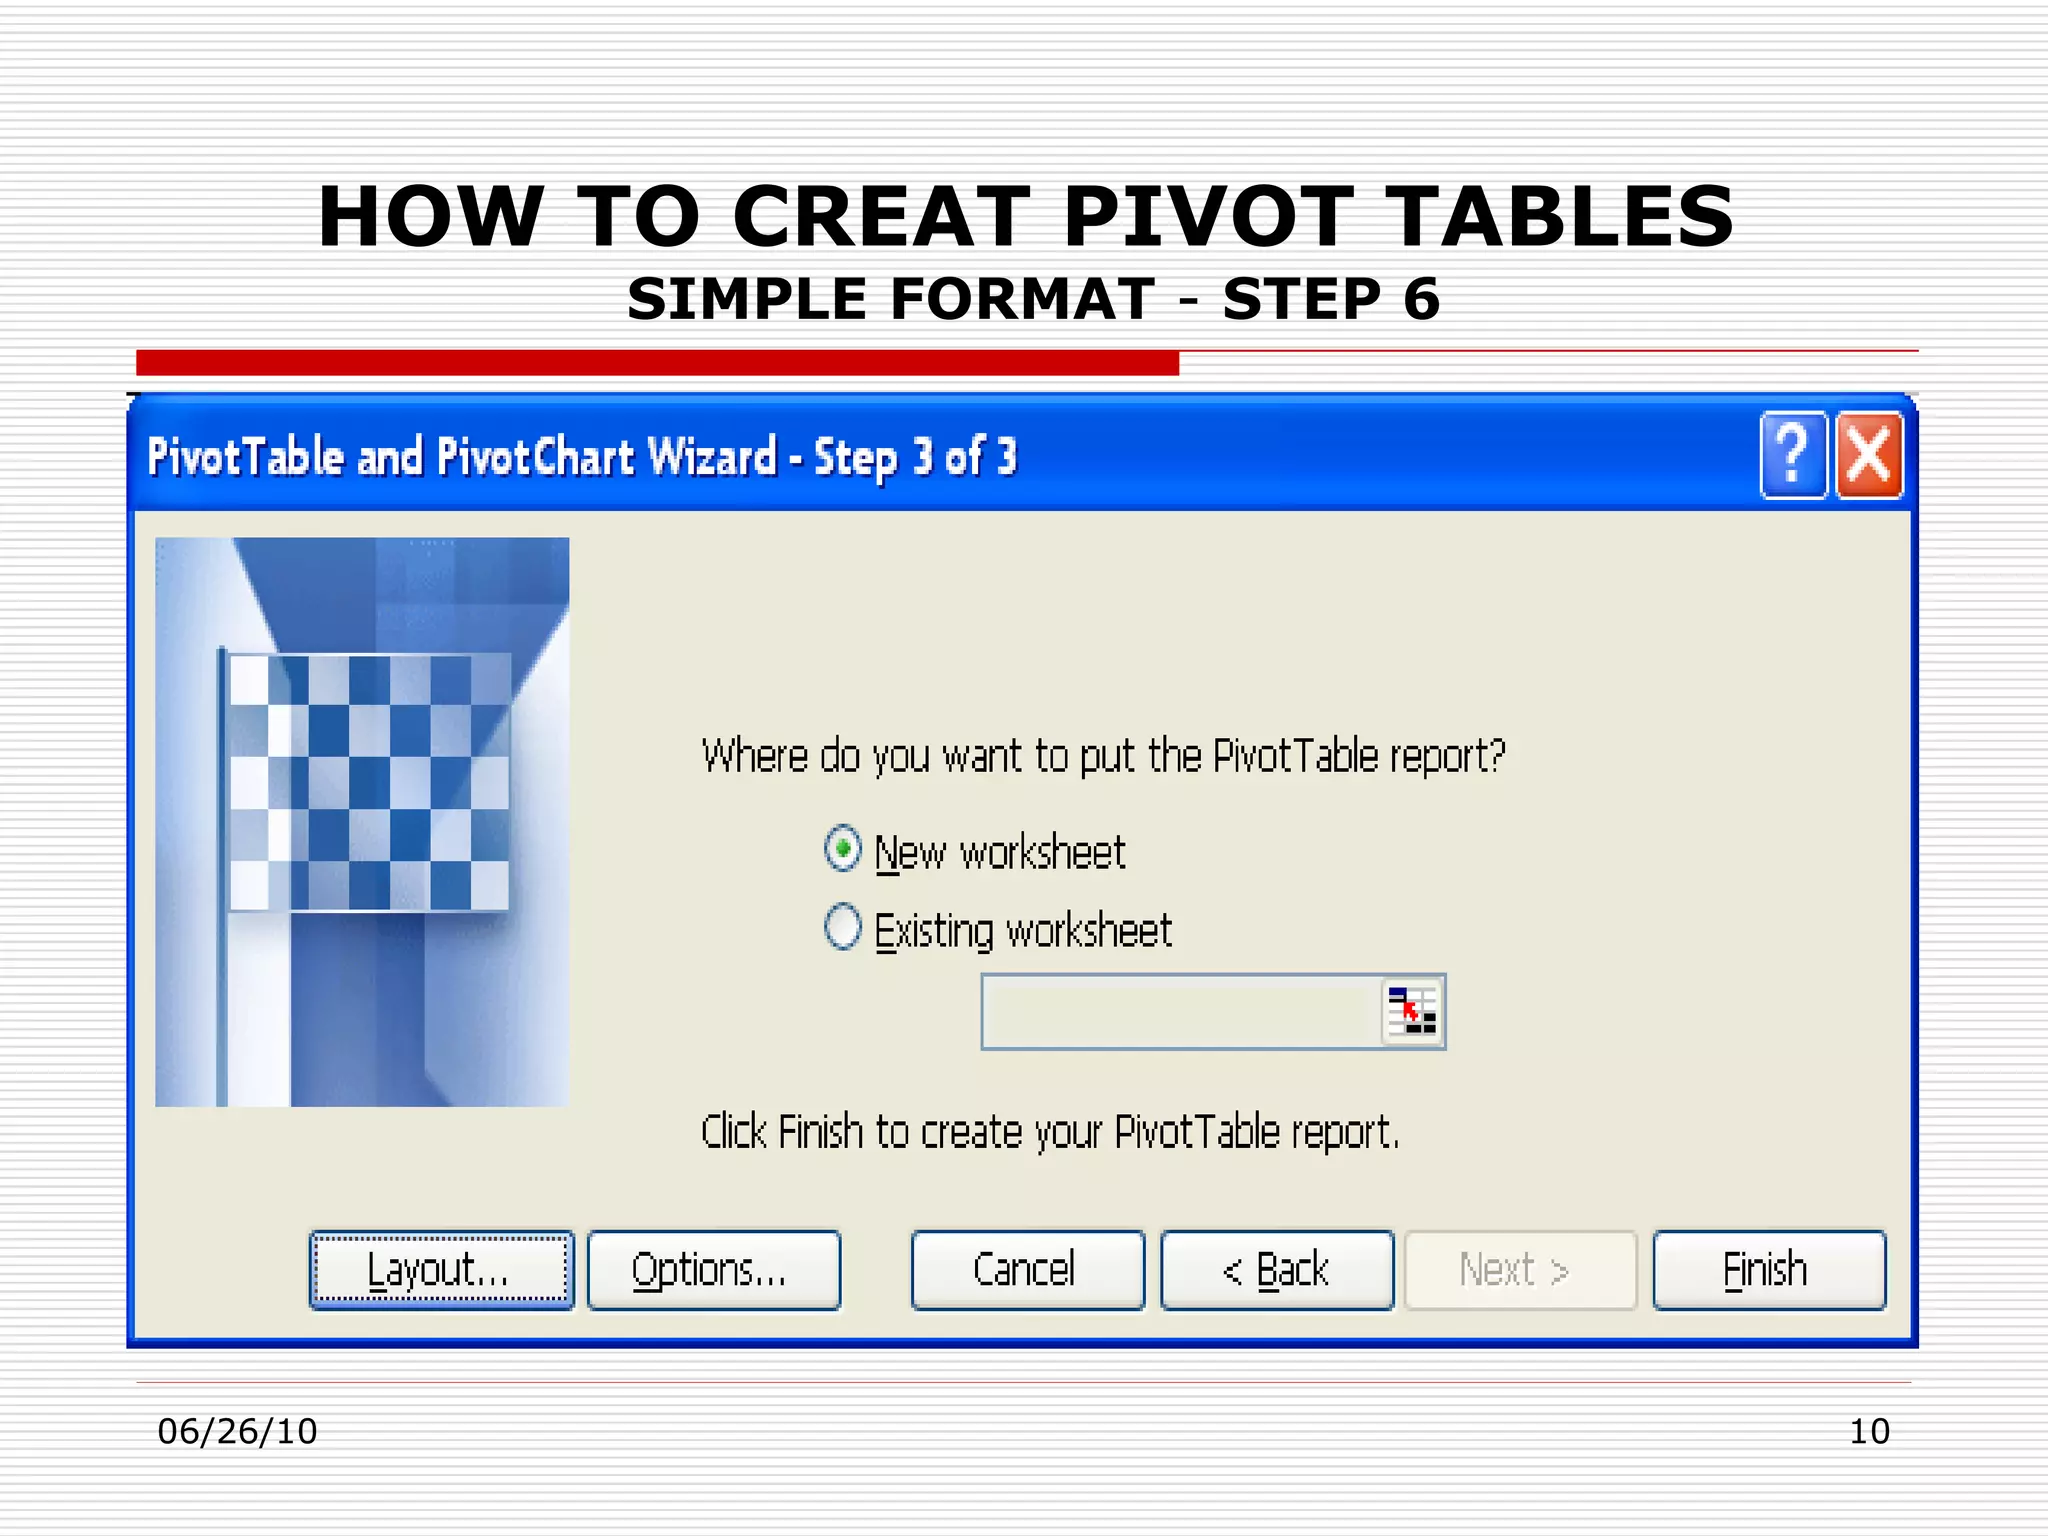
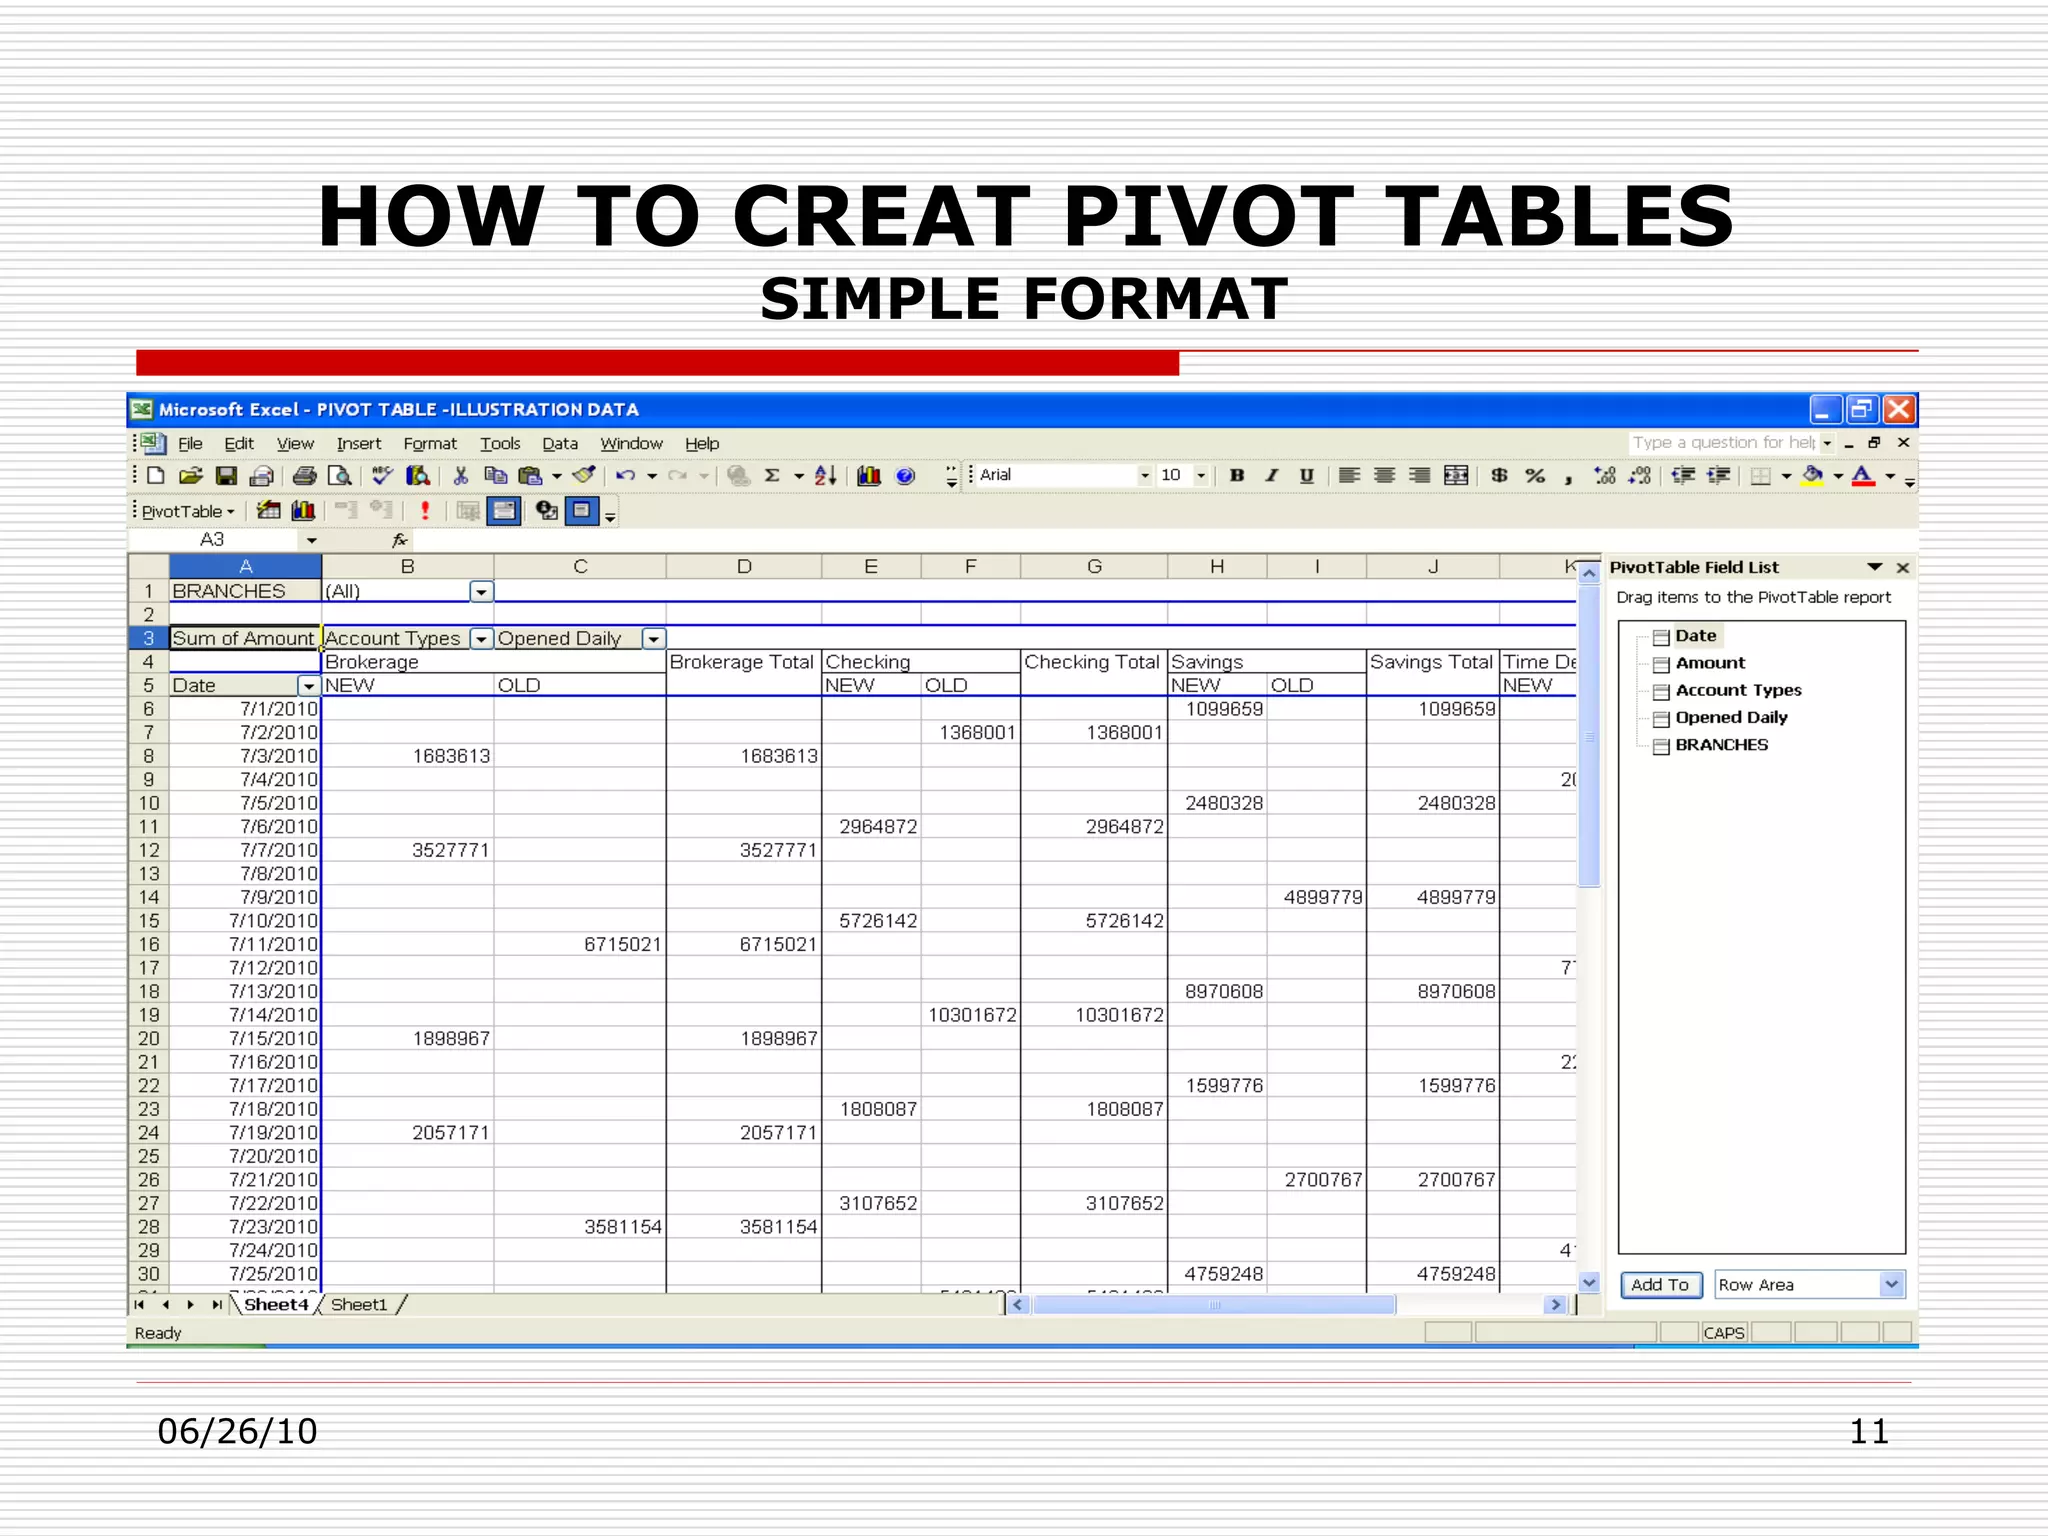
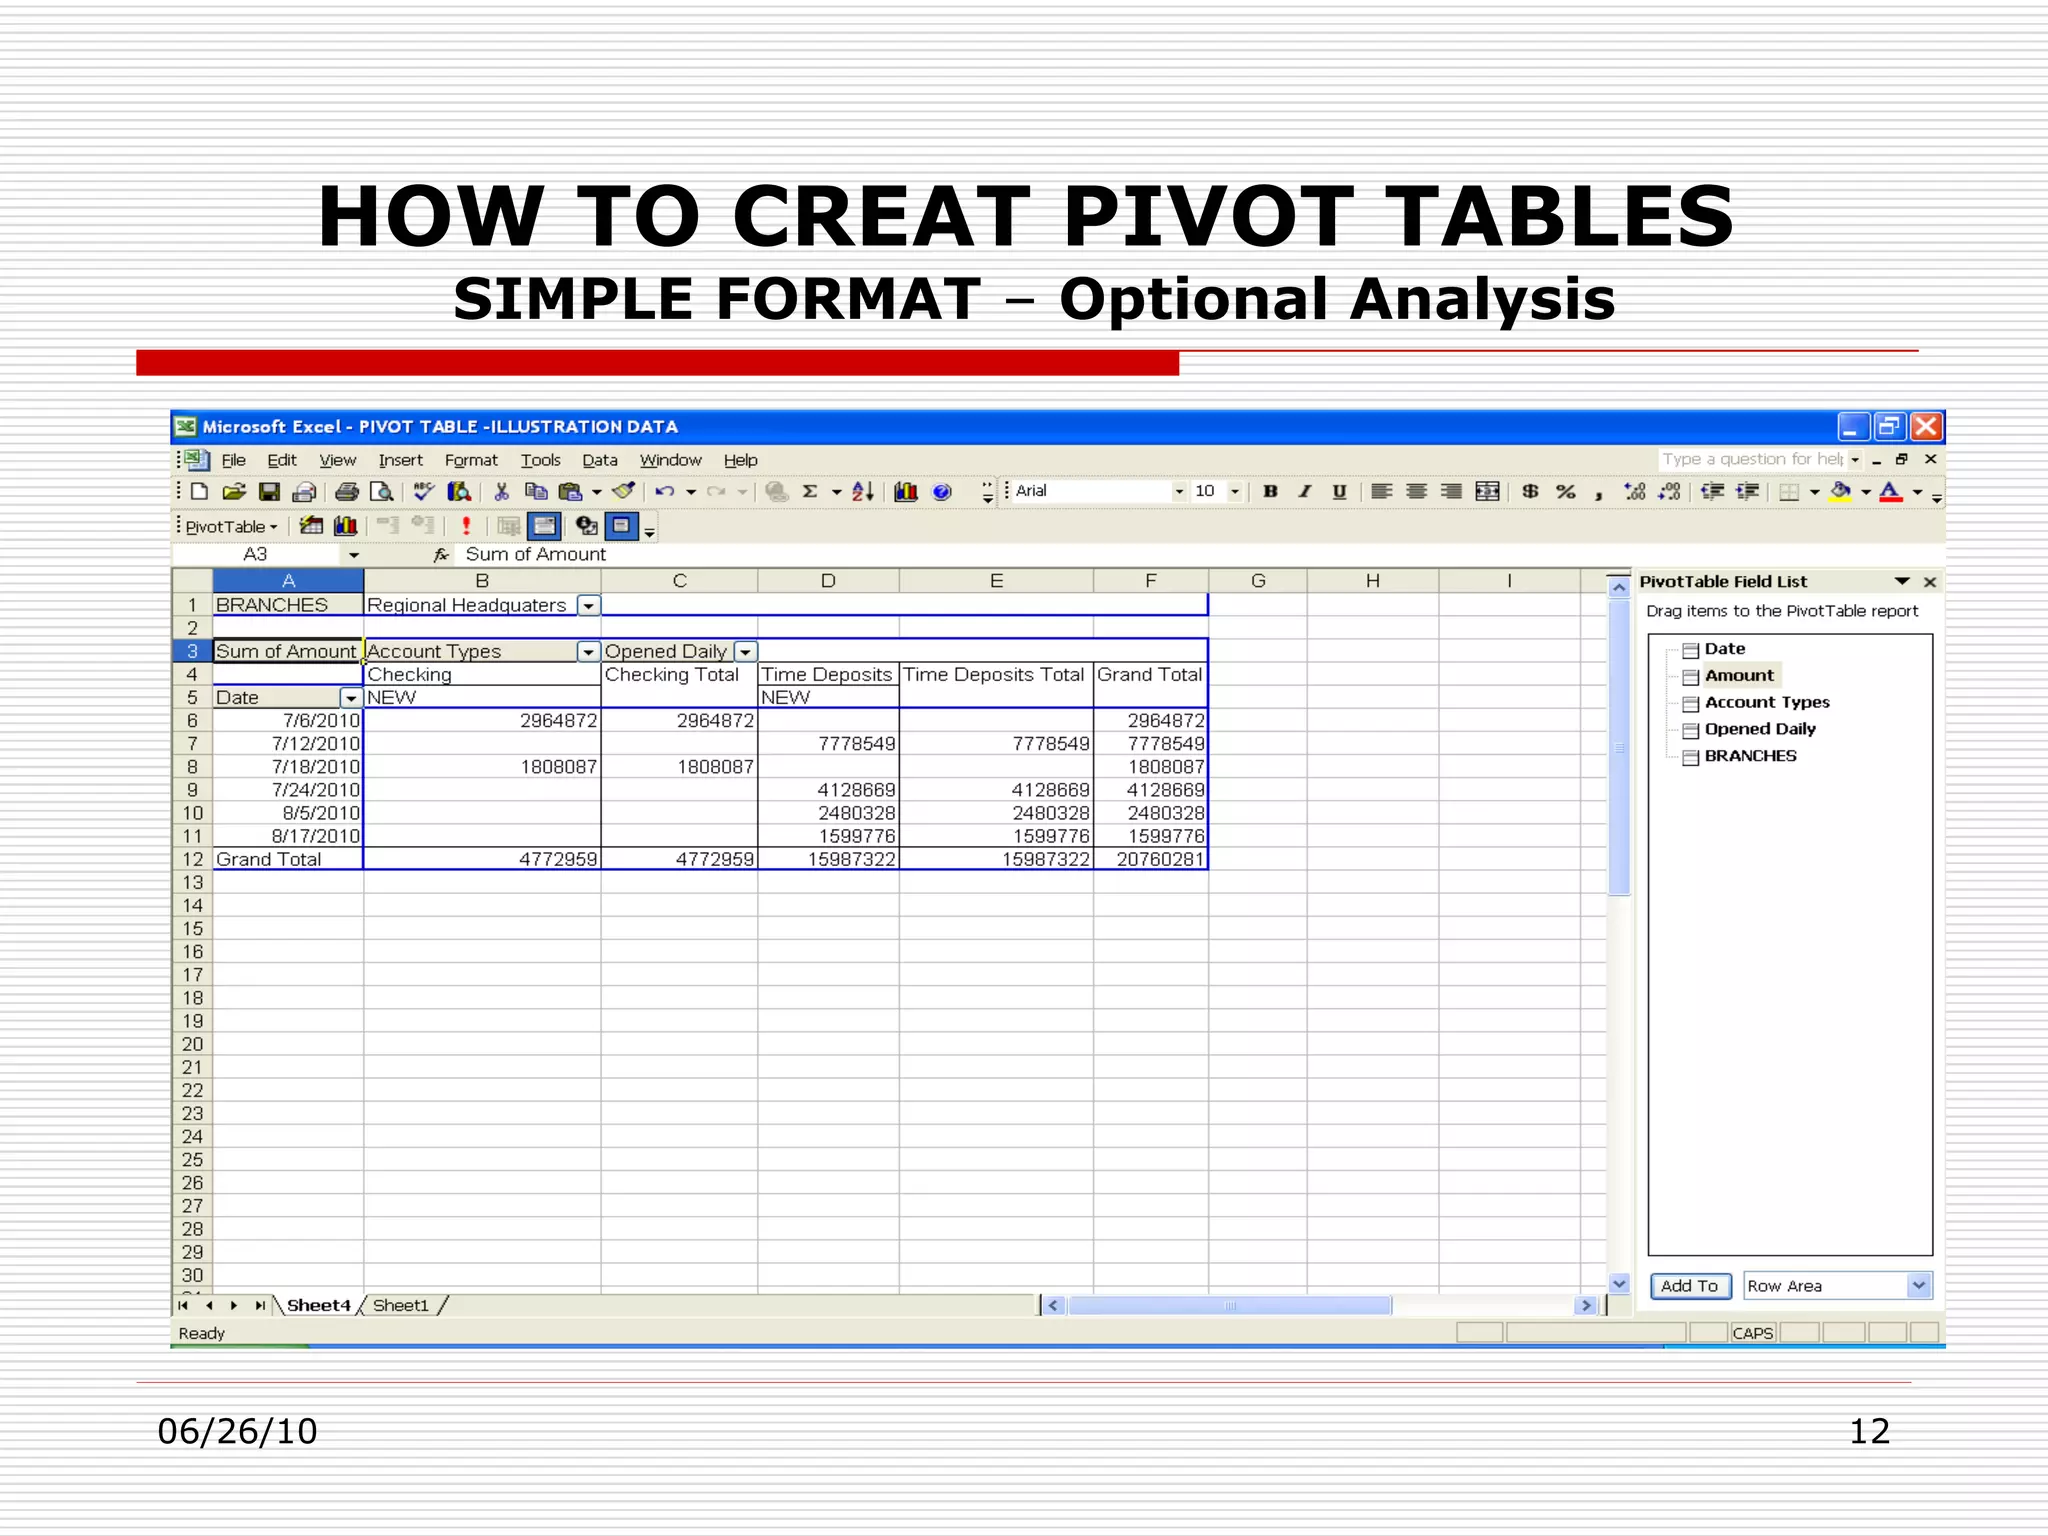

This document provides an introduction and illustrations for using pivot tables in MS Excel. It discusses how pivot tables can be used to summarize alpha numeric data, analyze data from multiple segments, and generate frequency distributions. The document then provides an example using bank deposit data to illustrate how pivot tables can be used to analyze deposits by account type, branch, and amount. Finally, it outlines the six step process for creating a simple pivot table in Excel.


