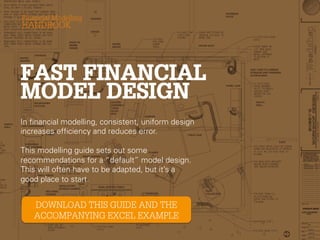
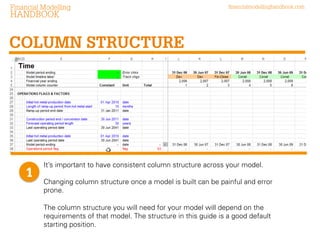
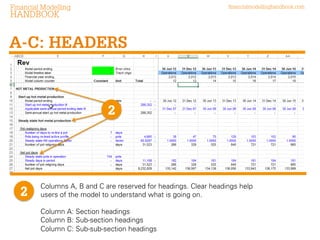
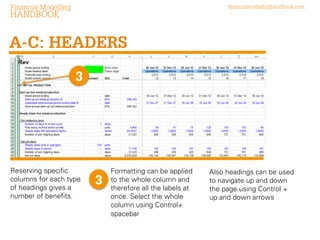
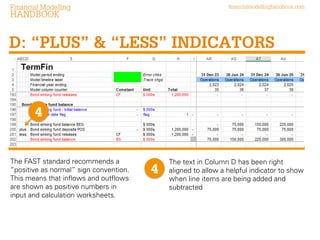
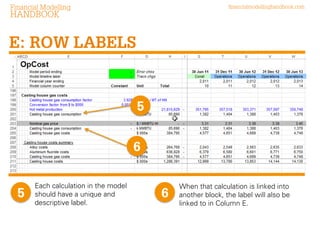
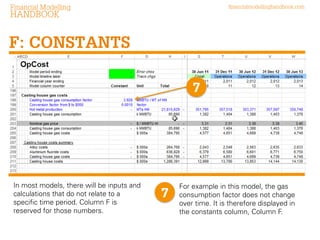
Financial modelling should be collaborative. Collaboration
reduces error, speeds up development time and lowers
cost. The Financial Modelling Handbook is a collaborative,
crowd-sourced guide to building better financial models
using the FAST Standard.
Emily Cowan is Director of the
FAST Standard Organisation.
Previously she led the Financial
Modelling Team at Grant Thornton
and has also worked at Macquarie
Bank.
In financial modelling, consistent, uniform design
increases efficiency and reduces error.
This modelling guide sets out some
recommendations for a “default” model design.
This will often have to be adapted, but it’s a good
place to start.
It’s important to have consistent column structure across your model.
Changing column structure once a model is built can be painful and error
prone.
The column structure you will need for your model will depend on the
requirements of that model. The structure in this guide is a good default
starting position.
Columns A, B and C are reserved for headings. Clear headings help
users of the model to understand what is going on.
Column A: Section headings
Column B: Sub-section headings
Column C: Sub-sub-section headings
Reserving specific
columns for each type
of headings gives a
number of benefits.

Formatting can be applied
to the whole column and
therefore all the labels at
once. Select the whole
column using Control+
spacebar

Also headings can be used
to navigate up and down
the page using Control +
up and down arrows
The FAST standard recommends a
“positive as normal” sign convention.
This means that inflows and outflows
are shown as positive numbers in input
and calculation worksheets.

The text in Column D has been right
aligned to allow a helpful indicator to show
when line items are being added and
subtracted
Each calculation in the model
should have a unique and
descriptive label.

When that calculation is linked into
another block, the label will also be
linked to in Column E.
In most models, there will be inputs and
calculations that do not relate to a
specific time period. Column F is
reserved for those numbers.

For example in this model, the gas
consumption factor does not change
over time. It is therefore displayed in
the constants column, Column F.
In many financial models there will be a
mix of financial and operational
calculations. It’s important to include a a
clear unit label for each line item.

Clear unit labelling also helps to
reduce errors that can creep in when
converting units.
Row totals contained in Column H are for
information only. They are not used in
calculations. It is often useful to see the
order or magnitude of a line items.

New row totals are only added to
calculations, usually the last item in a
calculation blocks
When line items are linked, the row
total is linked as well and does not
need to be recalculated.
There is frequently a requirement for
calculations to look back one period.
This is especially true in the calculation
of balances where the opening
balance in a given period is equal to
the closing balance in a previous
period.

Leaving a blank column before the time
series columns begin allows a very simple
approach to calculations that look back
one period.
Columns from J onwards each
represent one modelling period. Model
periodicity will change from model and
can range from hourly to annual.

The formulas across the timeline from
column J onwards should all be the same.
This makes review and checking easier
since each column does not have to be
checked individually.
Each column should have a single purpose.
Column structure should be consistent across similar types of
sheets in your model. i.e. all your monthly calculations sheets
should have the same column structure.

Column structure need not be the same between models since
there will be model specific requirements. What is contained in
this guide is a good starting position.

FAST financial model design

  • 3.
    Financial modelling shouldbe collaborative. Collaboration reduces error, speeds up development time and lowers cost. The Financial Modelling Handbook is a collaborative, crowd-sourced guide to building better financial models using the FAST Standard.
  • 4.
    Emily Cowan isDirector of the FAST Standard Organisation. Previously she led the Financial Modelling Team at Grant Thornton and has also worked at Macquarie Bank.
  • 5.
    In financial modelling,consistent, uniform design increases efficiency and reduces error. This modelling guide sets out some recommendations for a “default” model design. This will often have to be adapted, but it’s a good place to start.
  • 6.
    It’s important tohave consistent column structure across your model. Changing column structure once a model is built can be painful and error prone. The column structure you will need for your model will depend on the requirements of that model. The structure in this guide is a good default starting position.
  • 7.
    Columns A, Band C are reserved for headings. Clear headings help users of the model to understand what is going on. Column A: Section headings Column B: Sub-section headings Column C: Sub-sub-section headings
  • 8.
    Reserving specific columns foreach type of headings gives a number of benefits. Formatting can be applied to the whole column and therefore all the labels at once. Select the whole column using Control+ spacebar Also headings can be used to navigate up and down the page using Control + up and down arrows
  • 9.
    The FAST standardrecommends a “positive as normal” sign convention. This means that inflows and outflows are shown as positive numbers in input and calculation worksheets. The text in Column D has been right aligned to allow a helpful indicator to show when line items are being added and subtracted
  • 10.
    Each calculation inthe model should have a unique and descriptive label. When that calculation is linked into another block, the label will also be linked to in Column E.
  • 11.
    In most models,there will be inputs and calculations that do not relate to a specific time period. Column F is reserved for those numbers. For example in this model, the gas consumption factor does not change over time. It is therefore displayed in the constants column, Column F.
  • 12.
    In many financialmodels there will be a mix of financial and operational calculations. It’s important to include a a clear unit label for each line item. Clear unit labelling also helps to reduce errors that can creep in when converting units.
  • 13.
    Row totals containedin Column H are for information only. They are not used in calculations. It is often useful to see the order or magnitude of a line items. New row totals are only added to calculations, usually the last item in a calculation blocks When line items are linked, the row total is linked as well and does not need to be recalculated.
  • 14.
    There is frequentlya requirement for calculations to look back one period. This is especially true in the calculation of balances where the opening balance in a given period is equal to the closing balance in a previous period. Leaving a blank column before the time series columns begin allows a very simple approach to calculations that look back one period.
  • 15.
    Columns from Jonwards each represent one modelling period. Model periodicity will change from model and can range from hourly to annual. The formulas across the timeline from column J onwards should all be the same. This makes review and checking easier since each column does not have to be checked individually.
  • 16.
    Each column shouldhave a single purpose. Column structure should be consistent across similar types of sheets in your model. i.e. all your monthly calculations sheets should have the same column structure. Column structure need not be the same between models since there will be model specific requirements. What is contained in this guide is a good starting position.