Downloaded 14 times


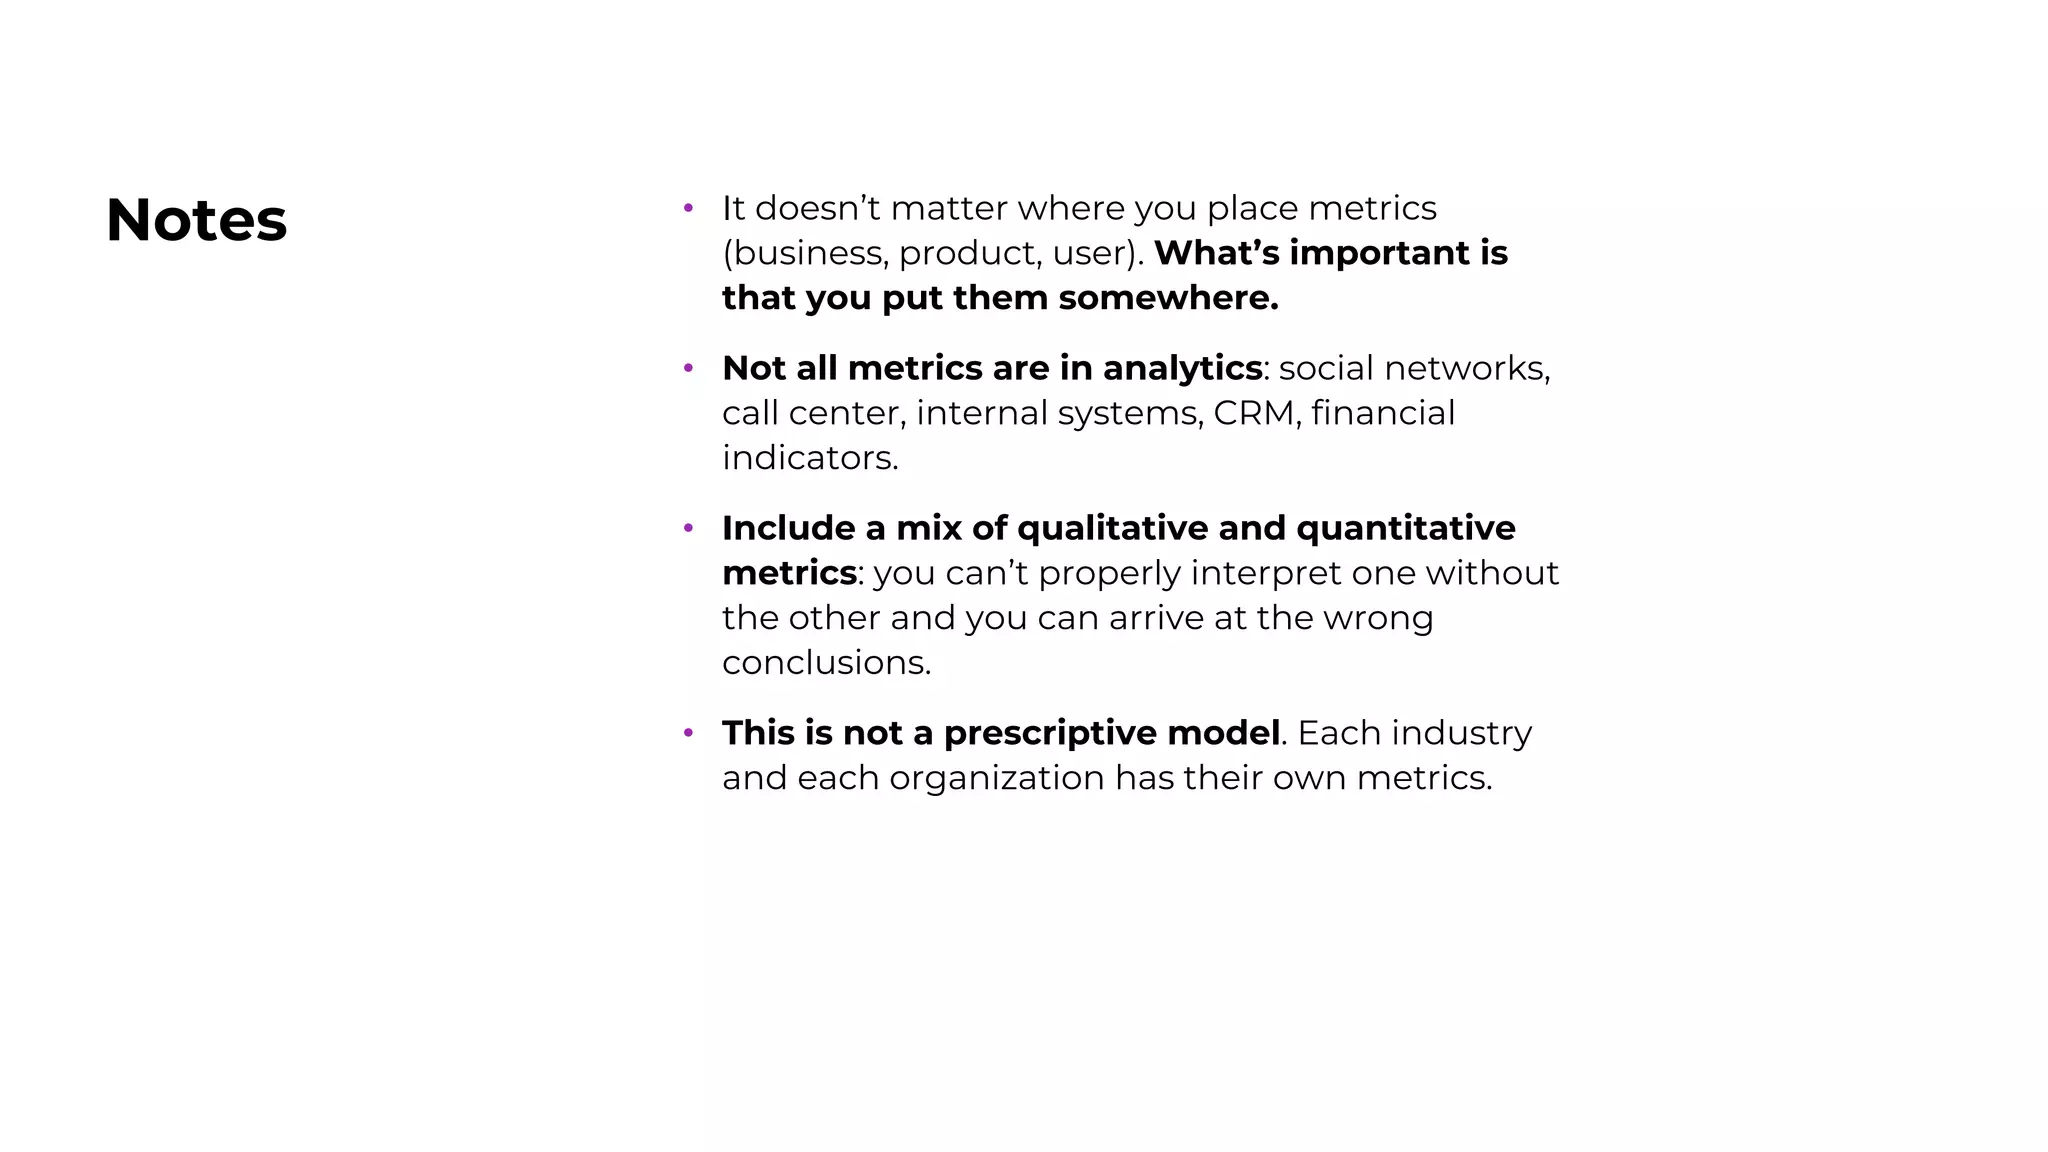


The document presents the Full Loop Analytics Framework, designed to measure product performance by organizing metrics related to user experience, business results, and customer satisfaction. It outlines how to define goals and metrics for various initiatives, emphasizing the importance of both qualitative and quantitative measures. The framework aims to provide a holistic view of a company's performance, facilitating better collaboration and decision-making across organizations.
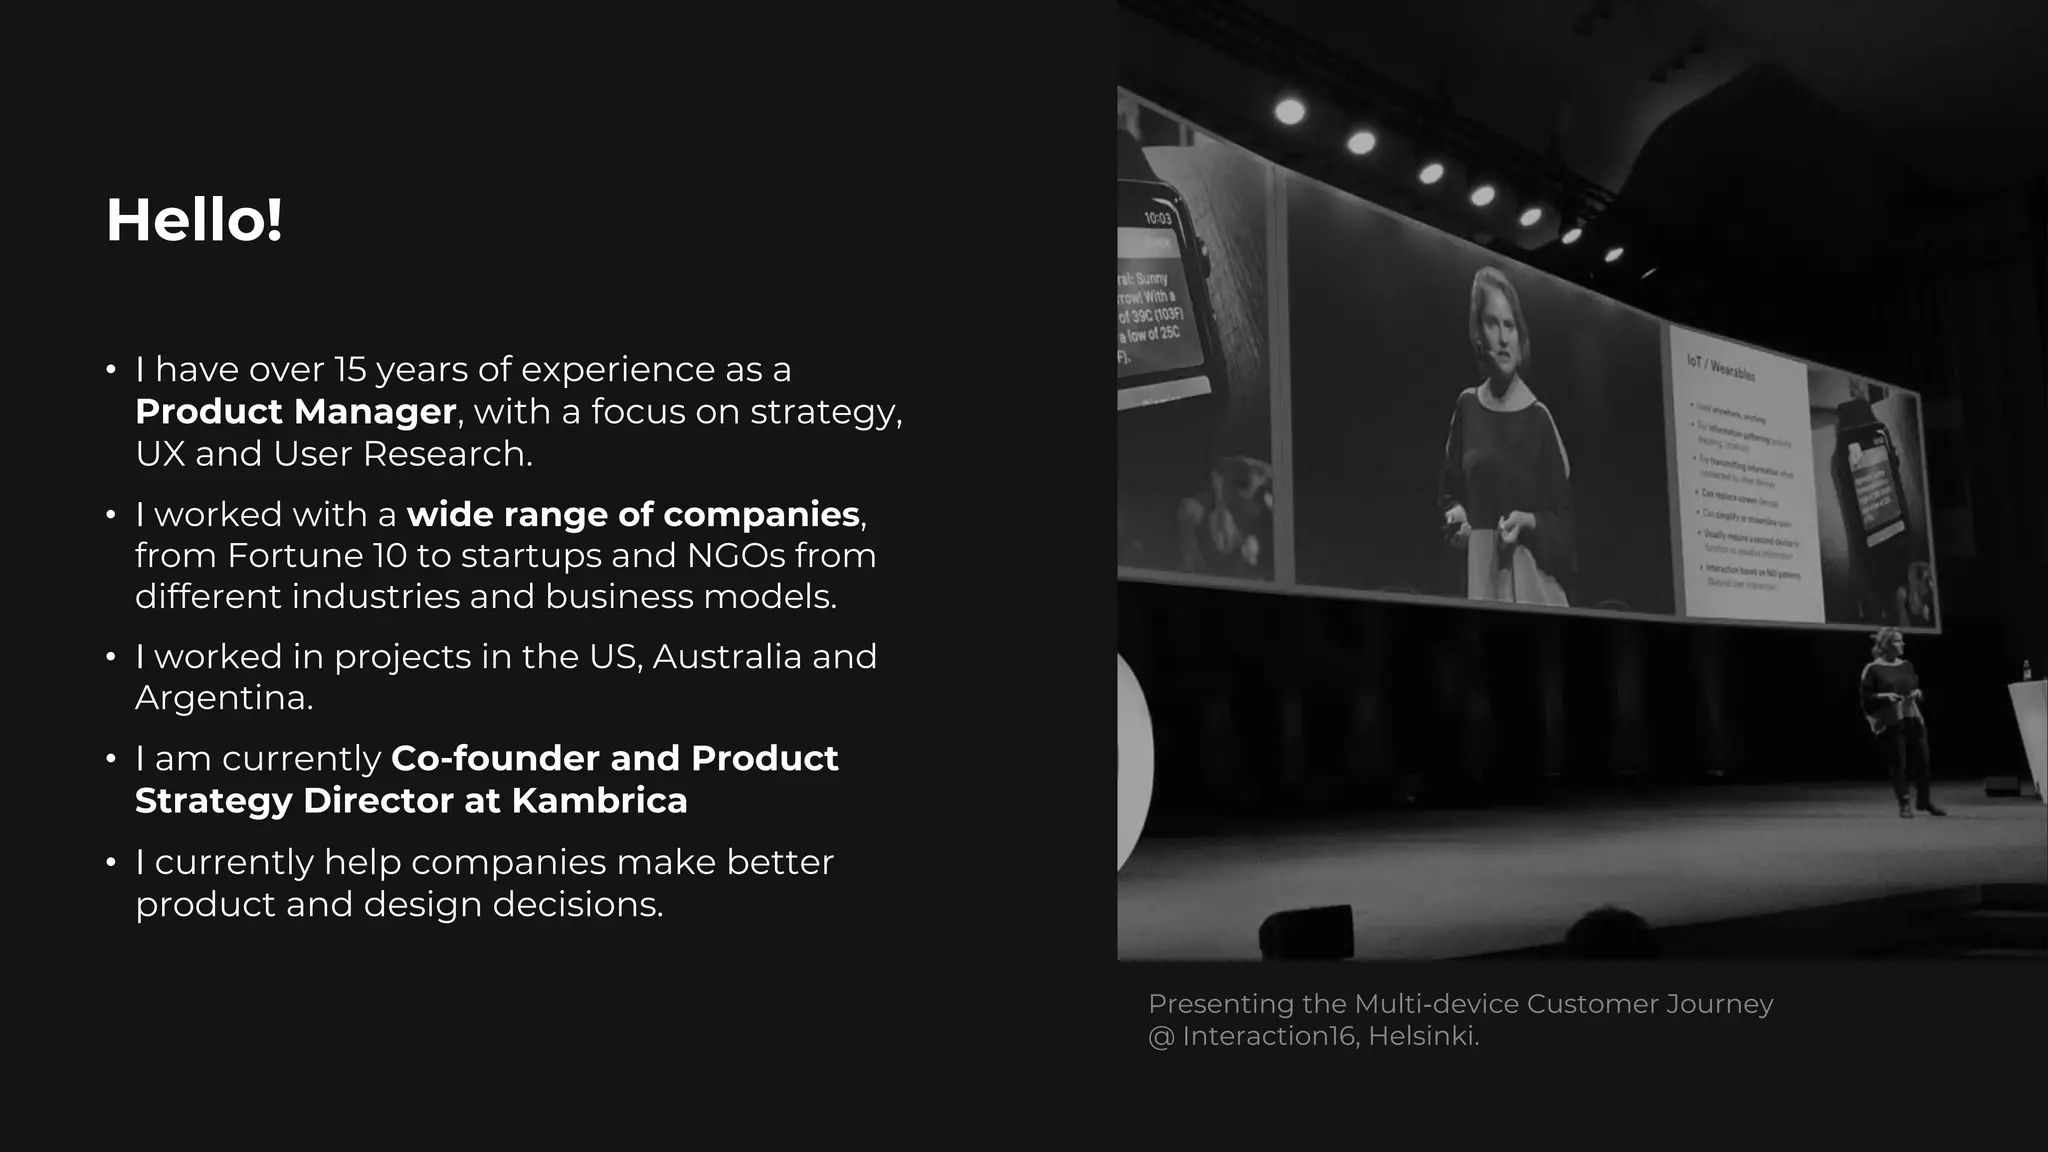
Introduction of the Full Loop Analytics Framework and speaker's extensive background in product management.
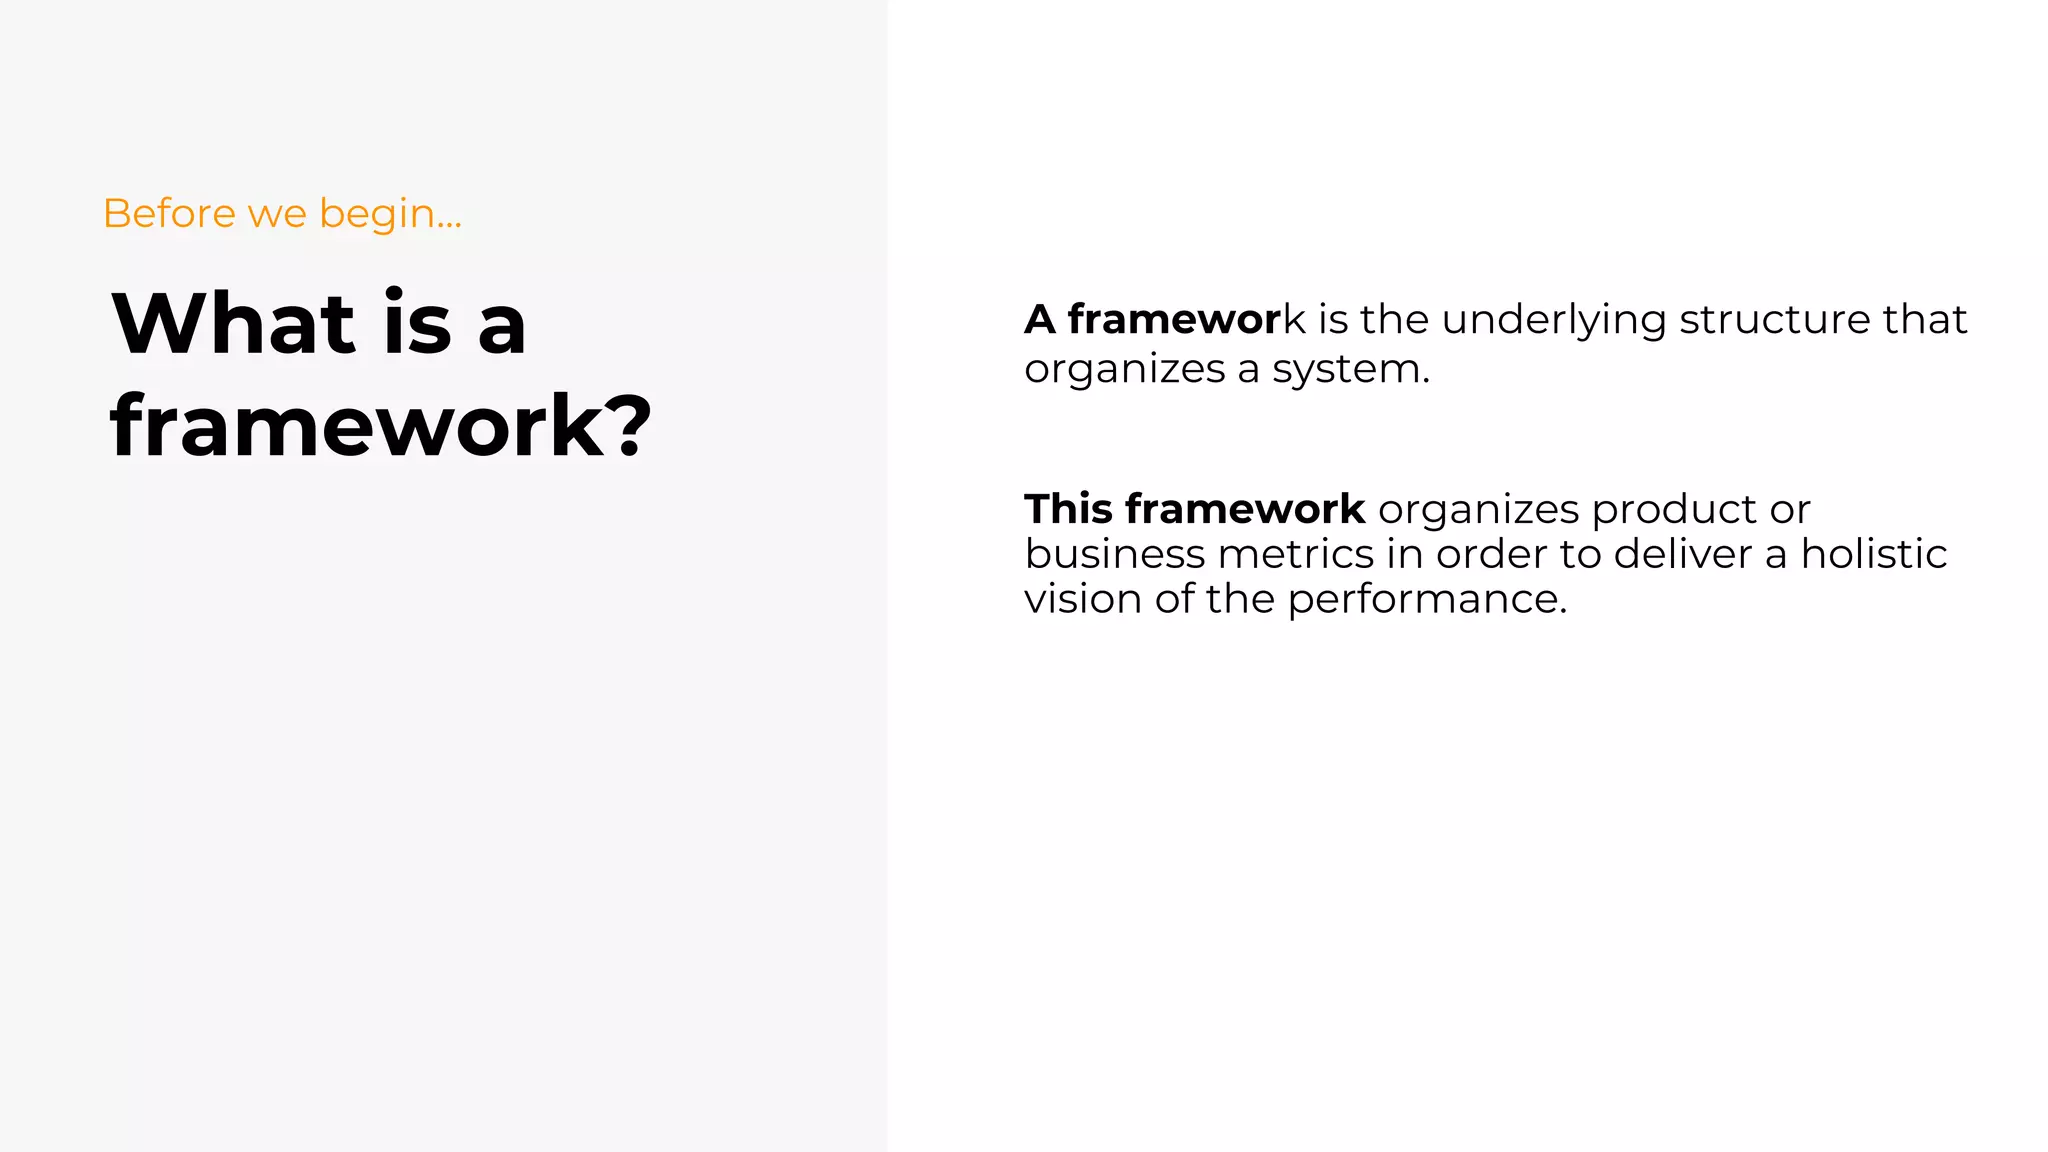
Definition of a framework, emphasizing its role in organizing metrics for holistic product performance analysis.
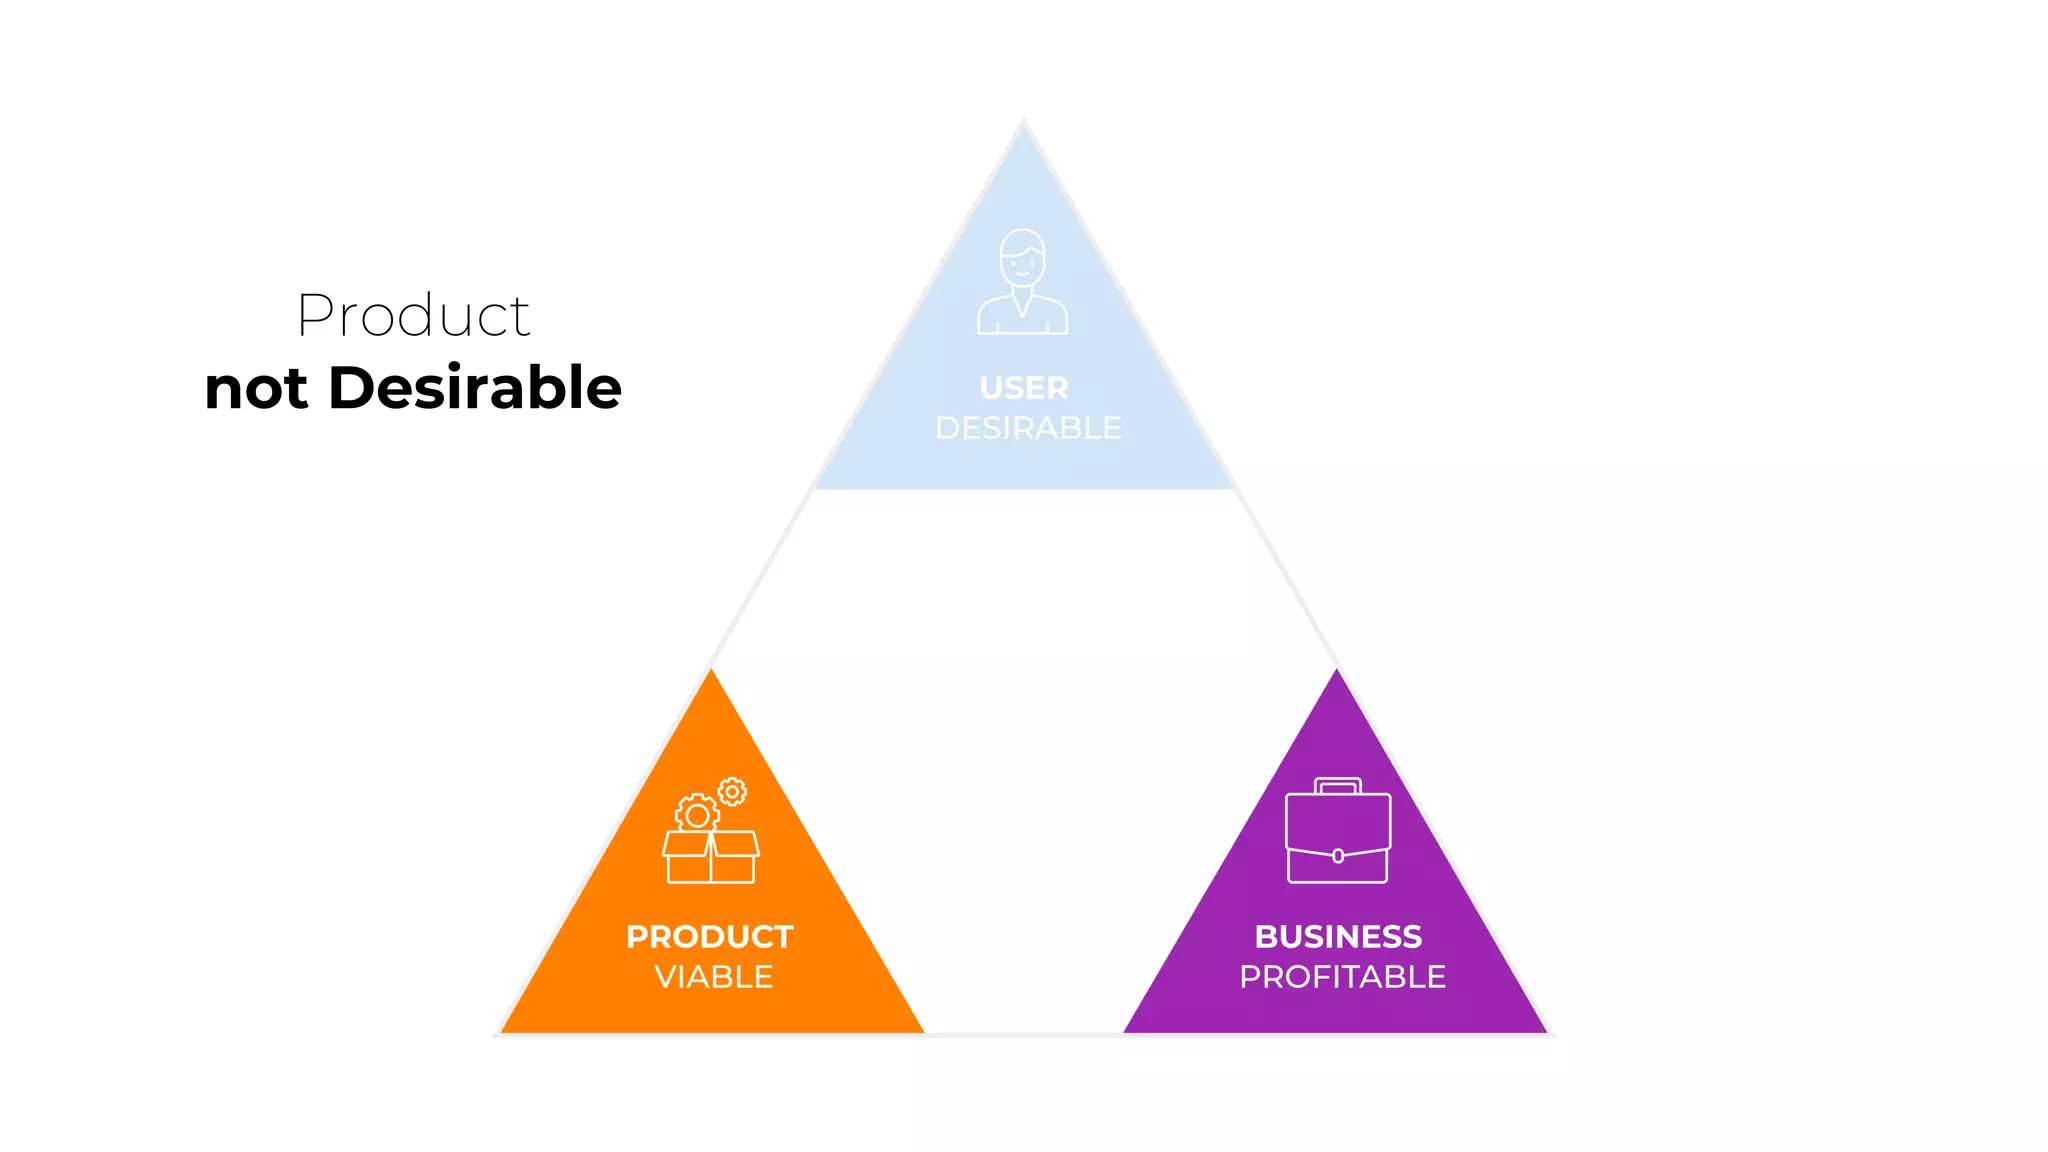
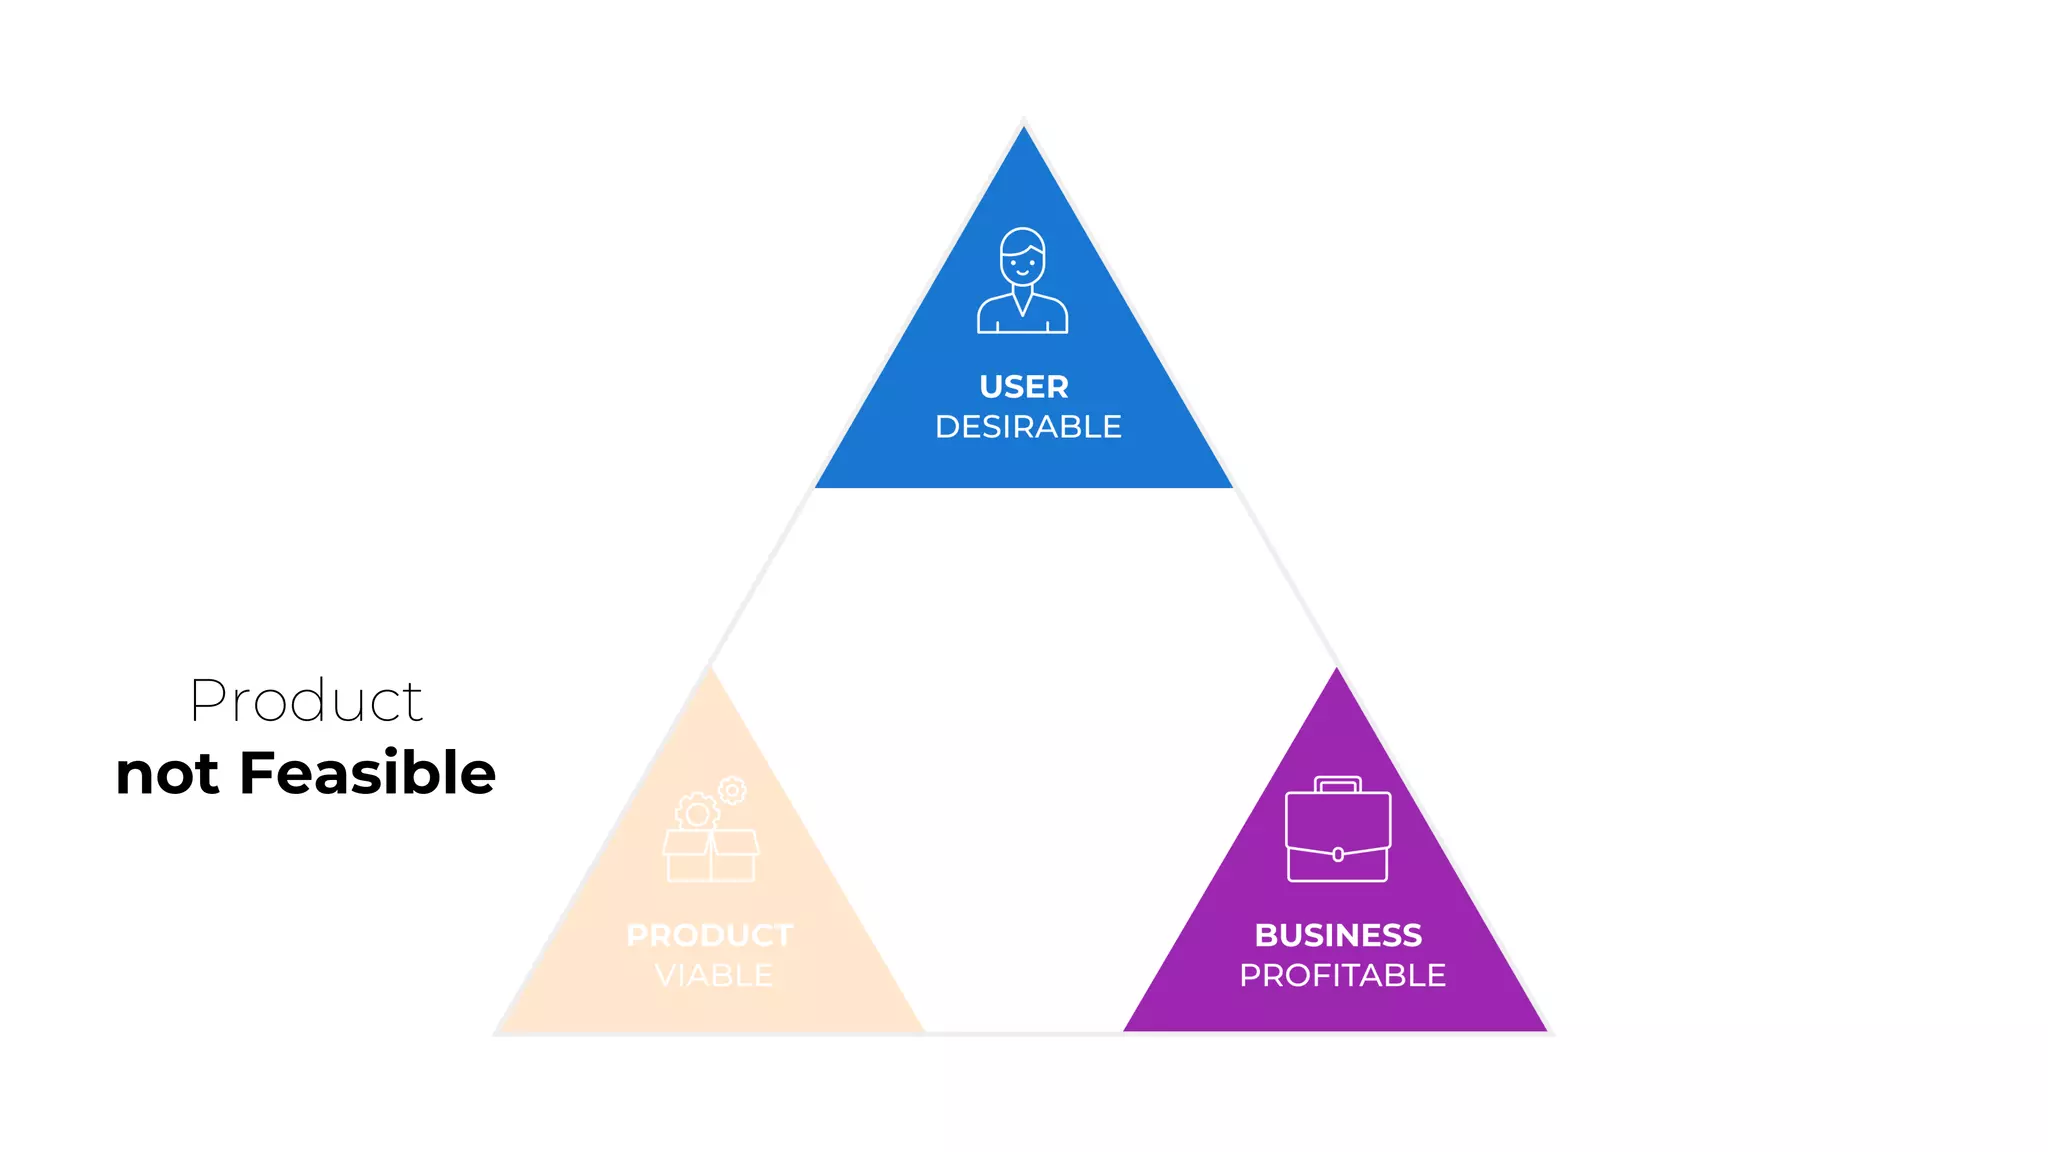
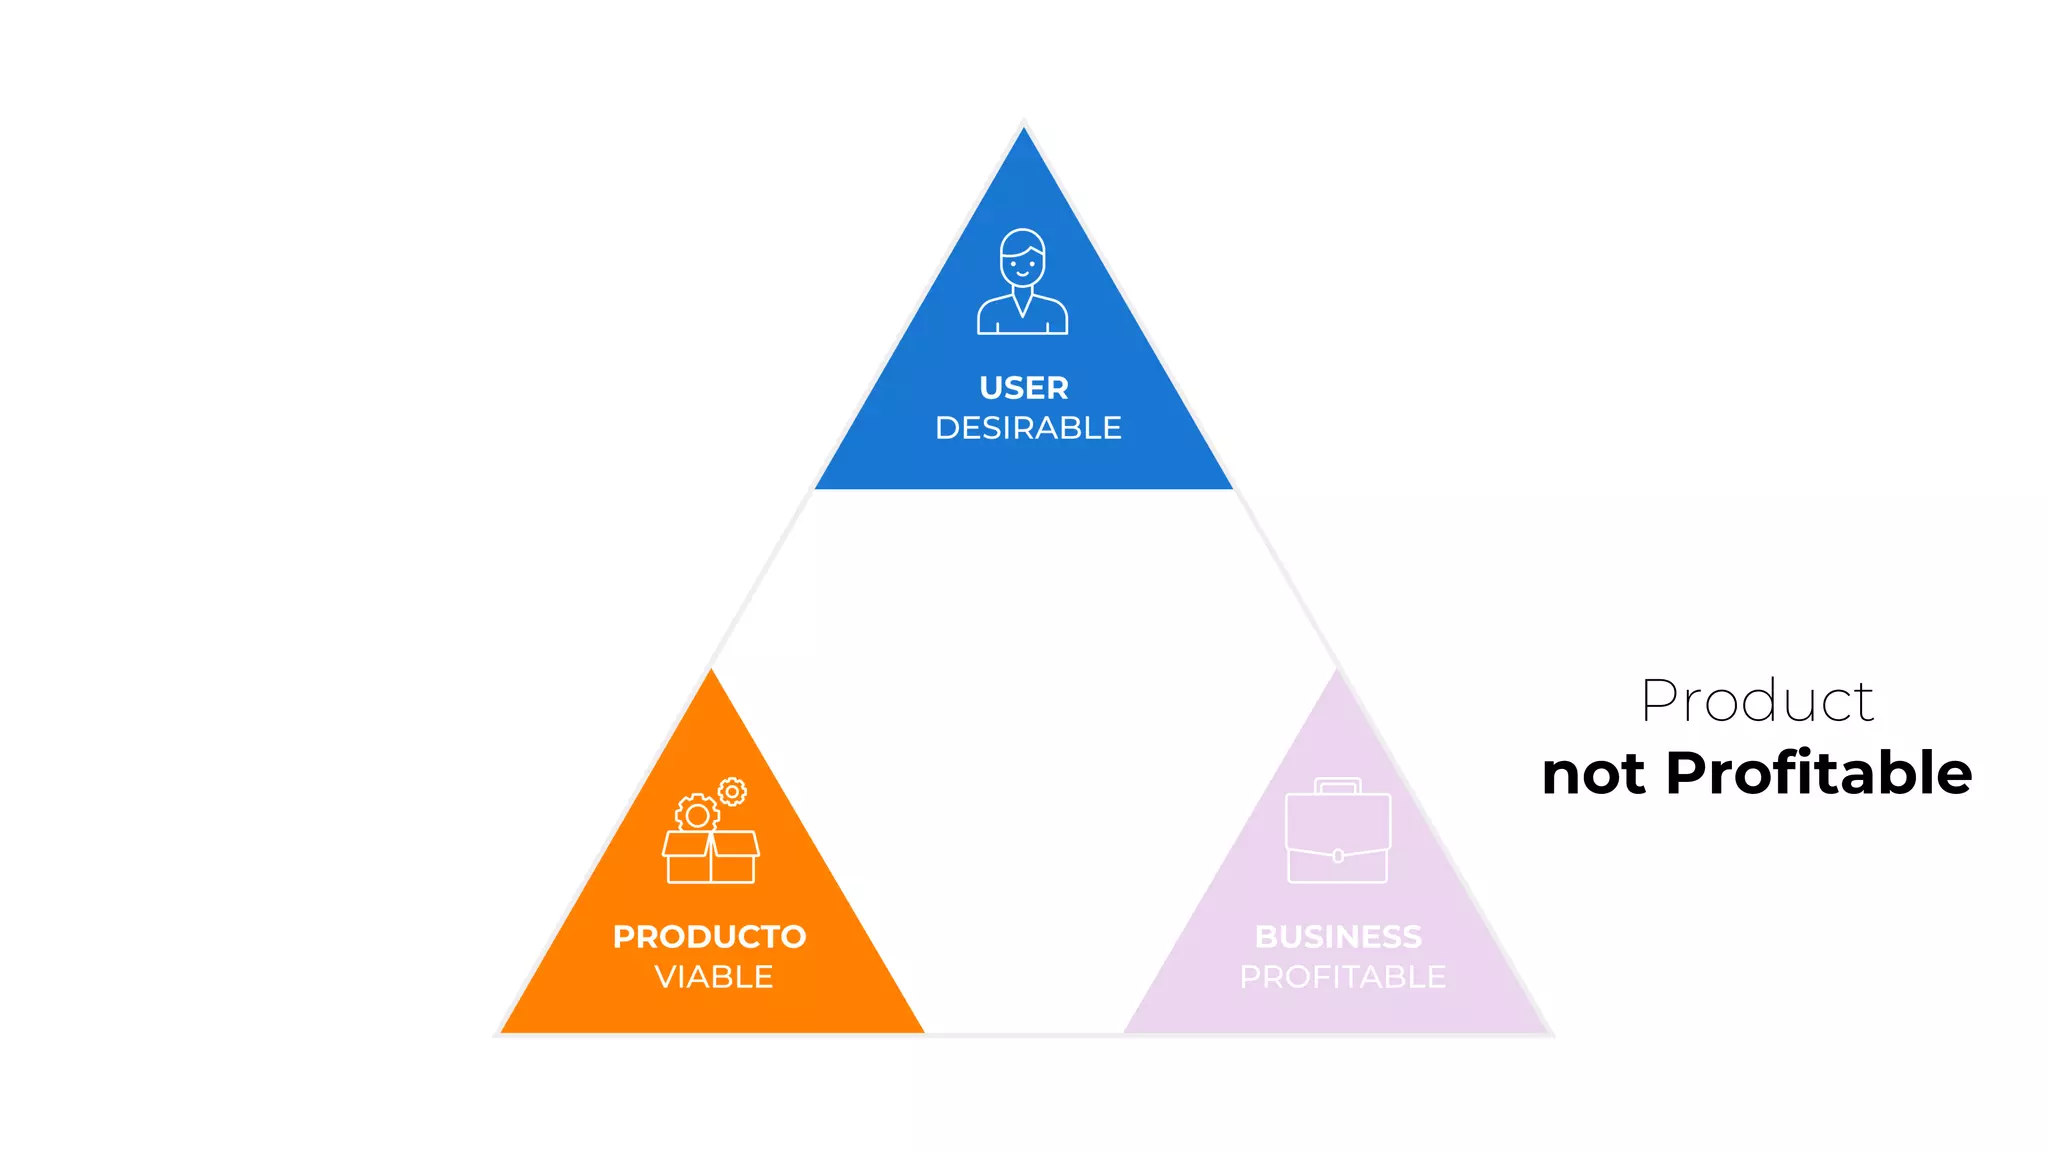
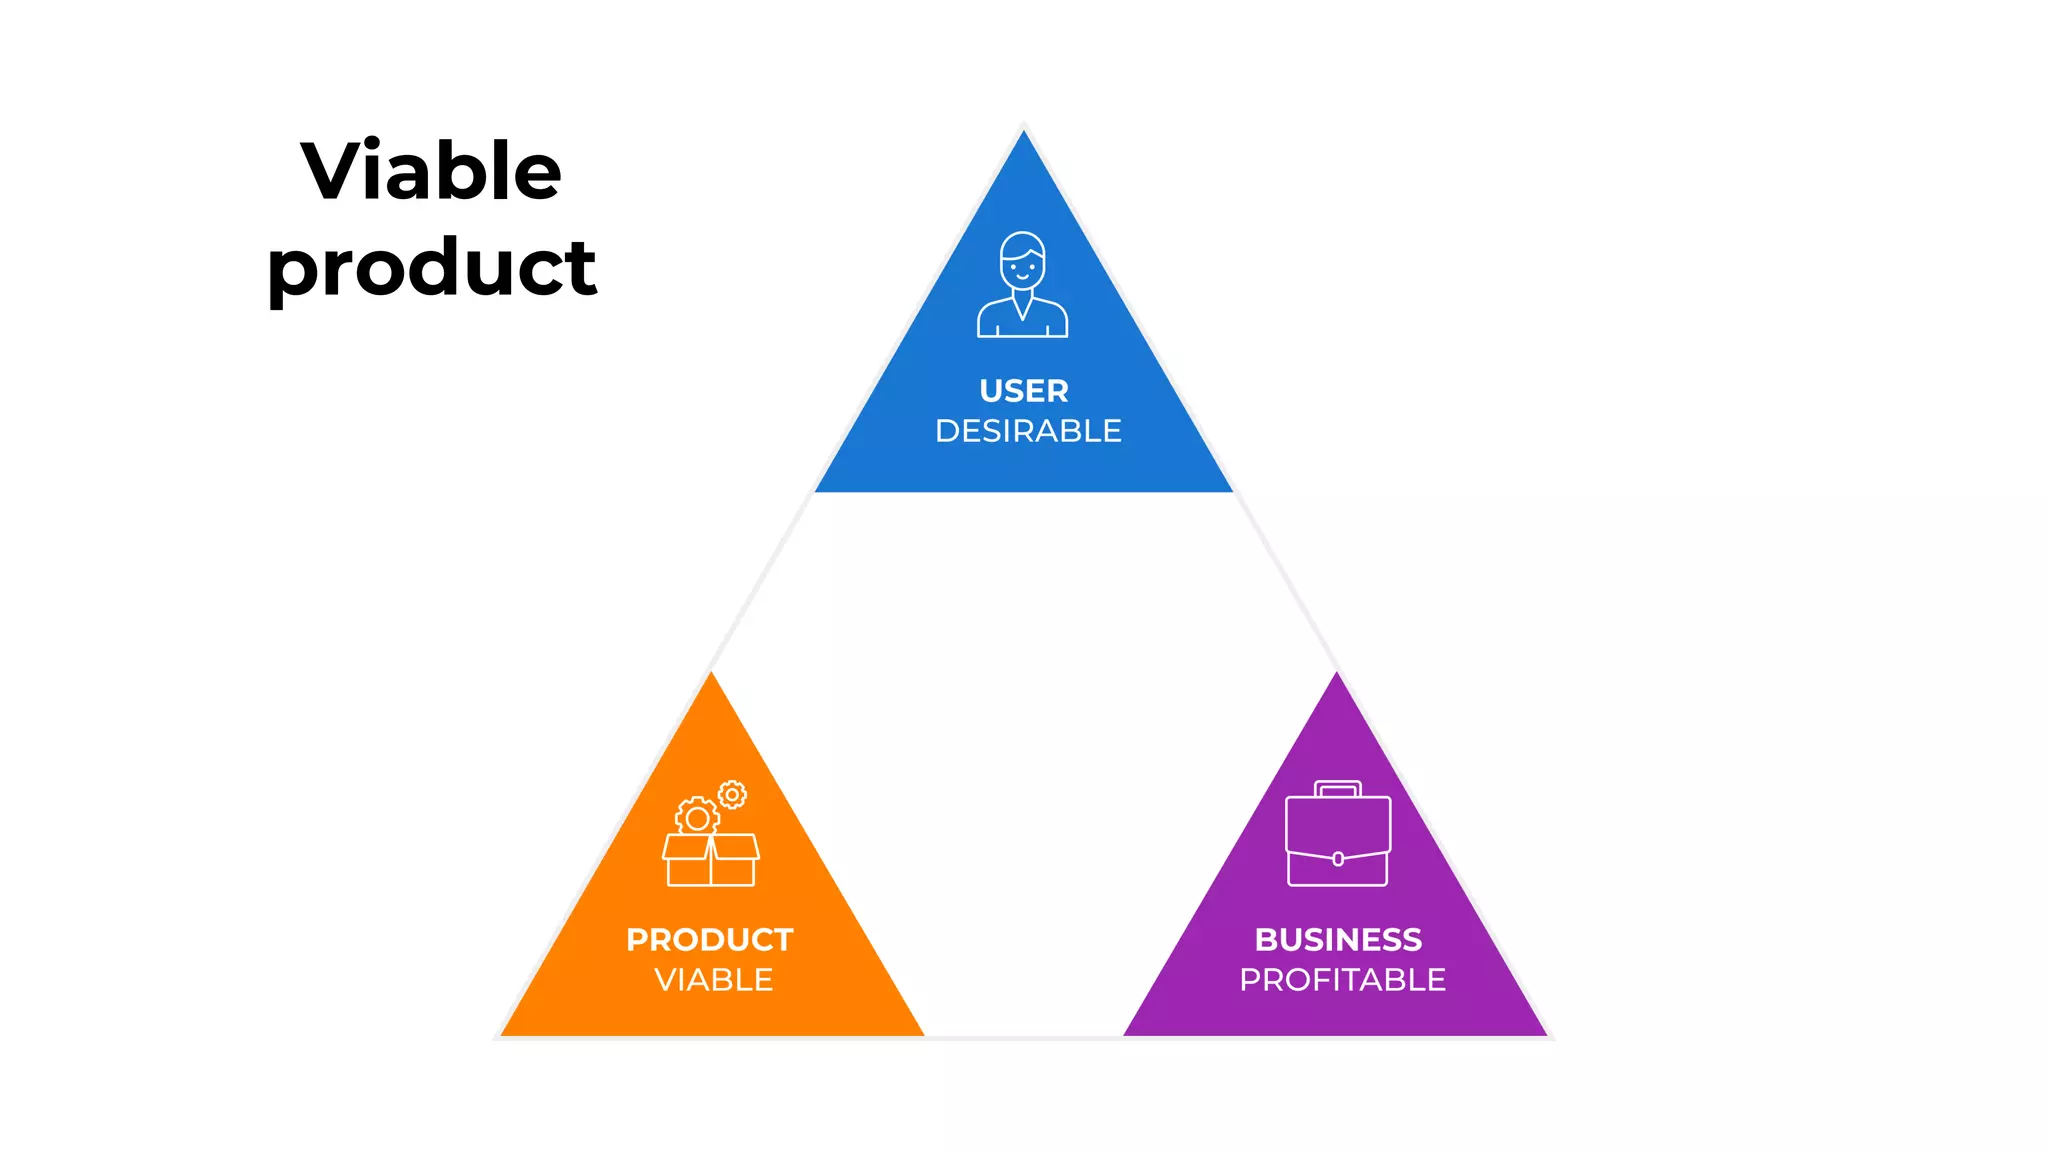
Explaining critical factors affecting product viability: desirability, feasibility, and profitability.
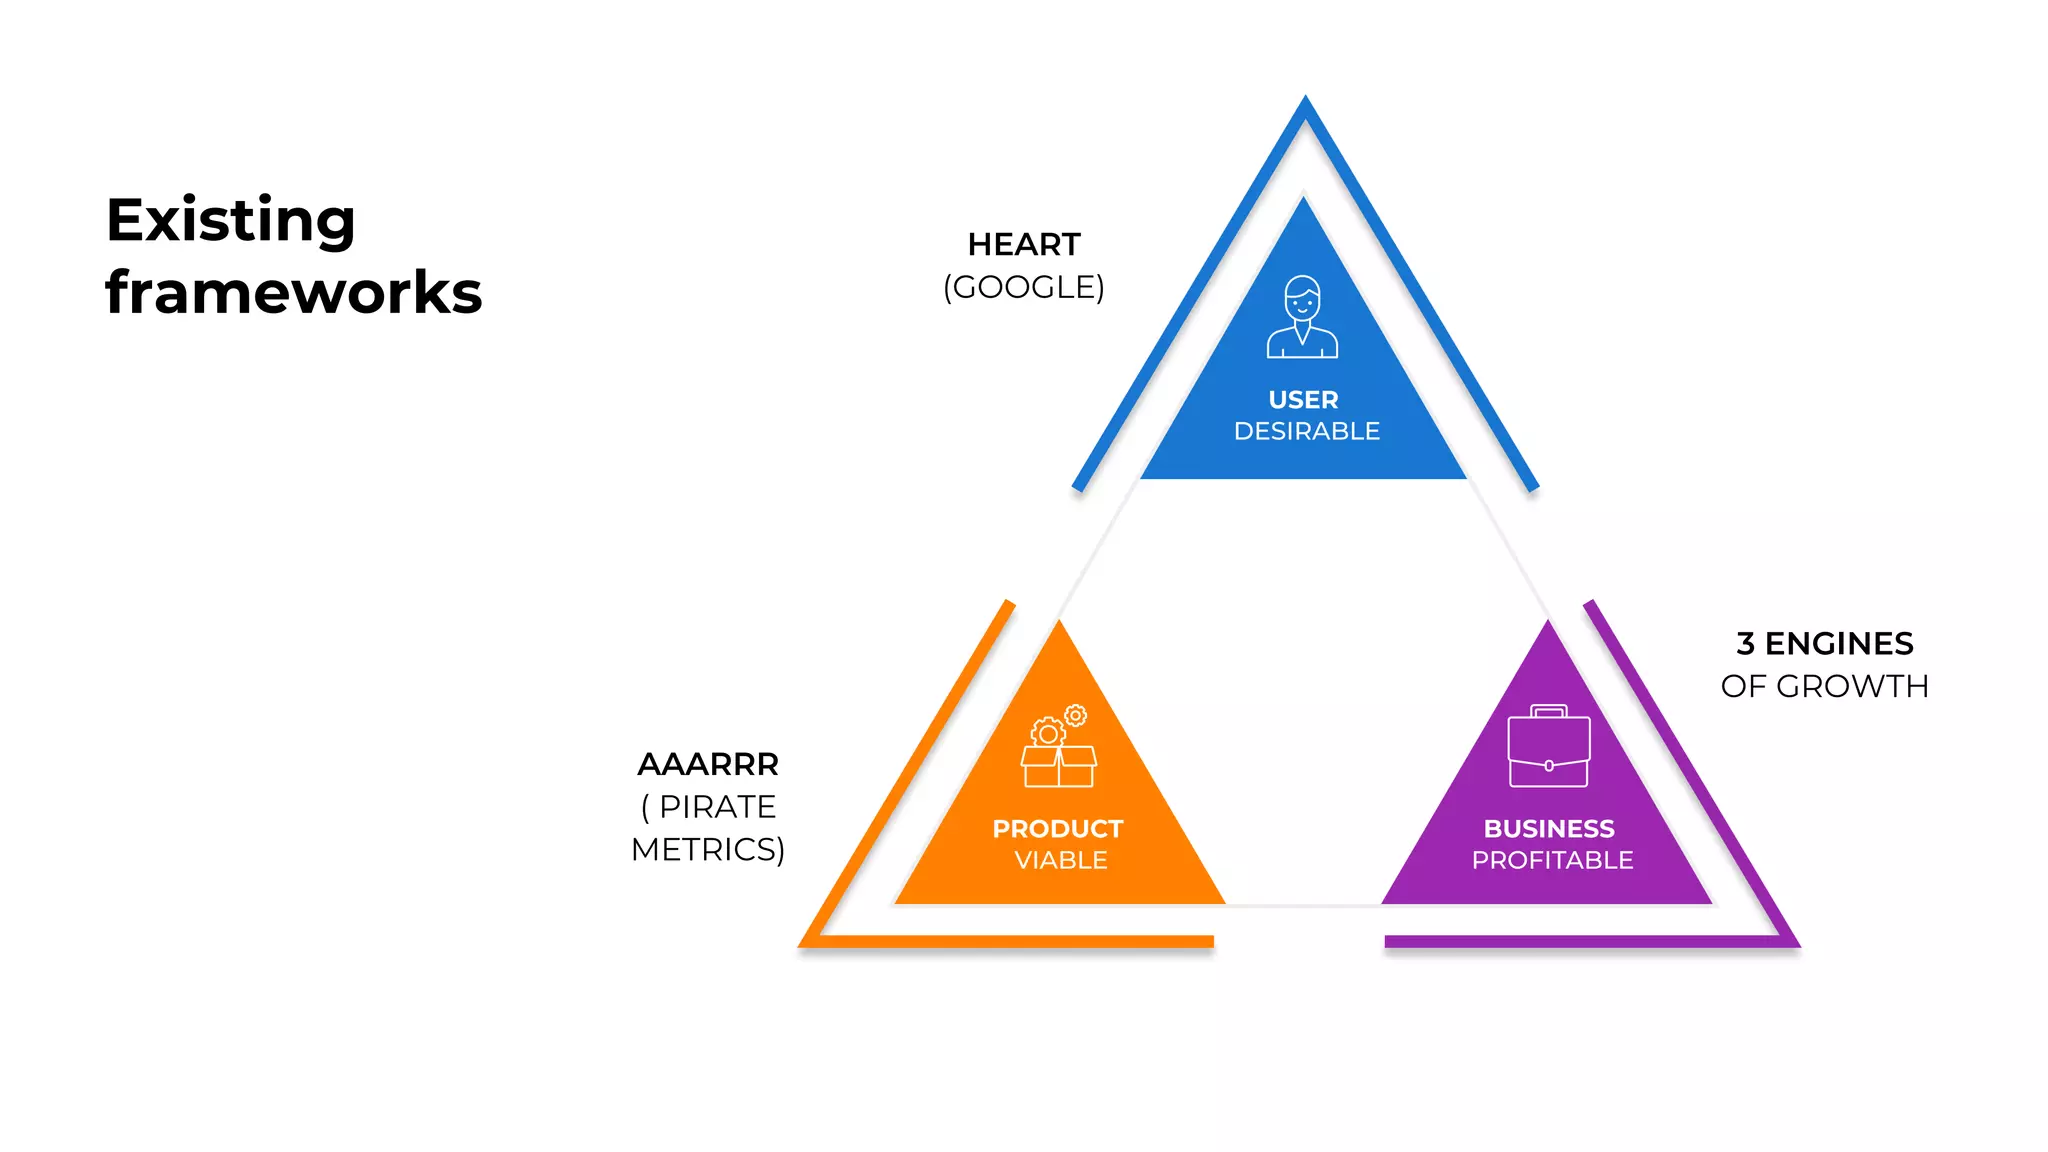
Introduction to existing frameworks like AAARRR (PIRATE METRICS), HEART, and 3 Engines of Growth.
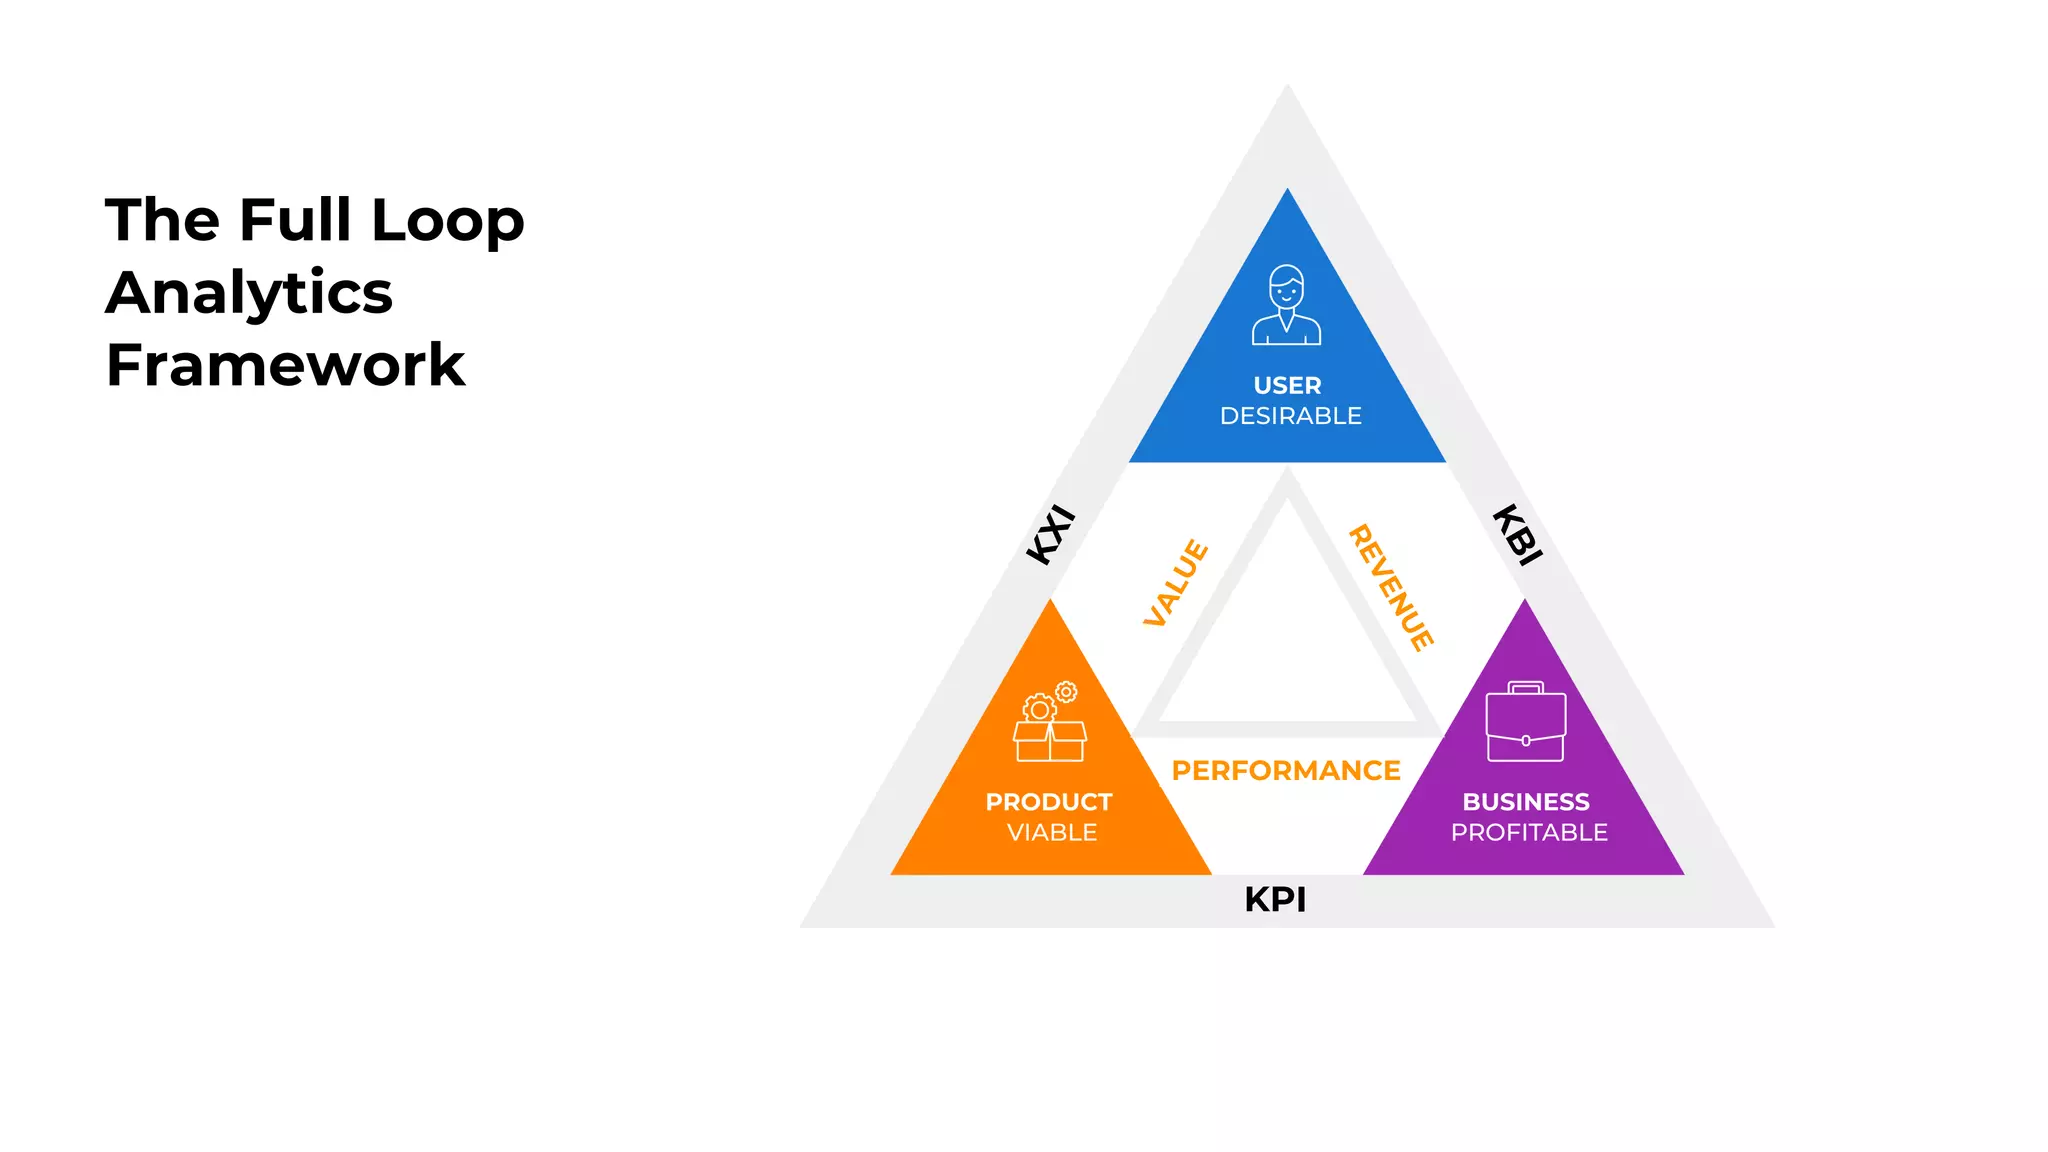
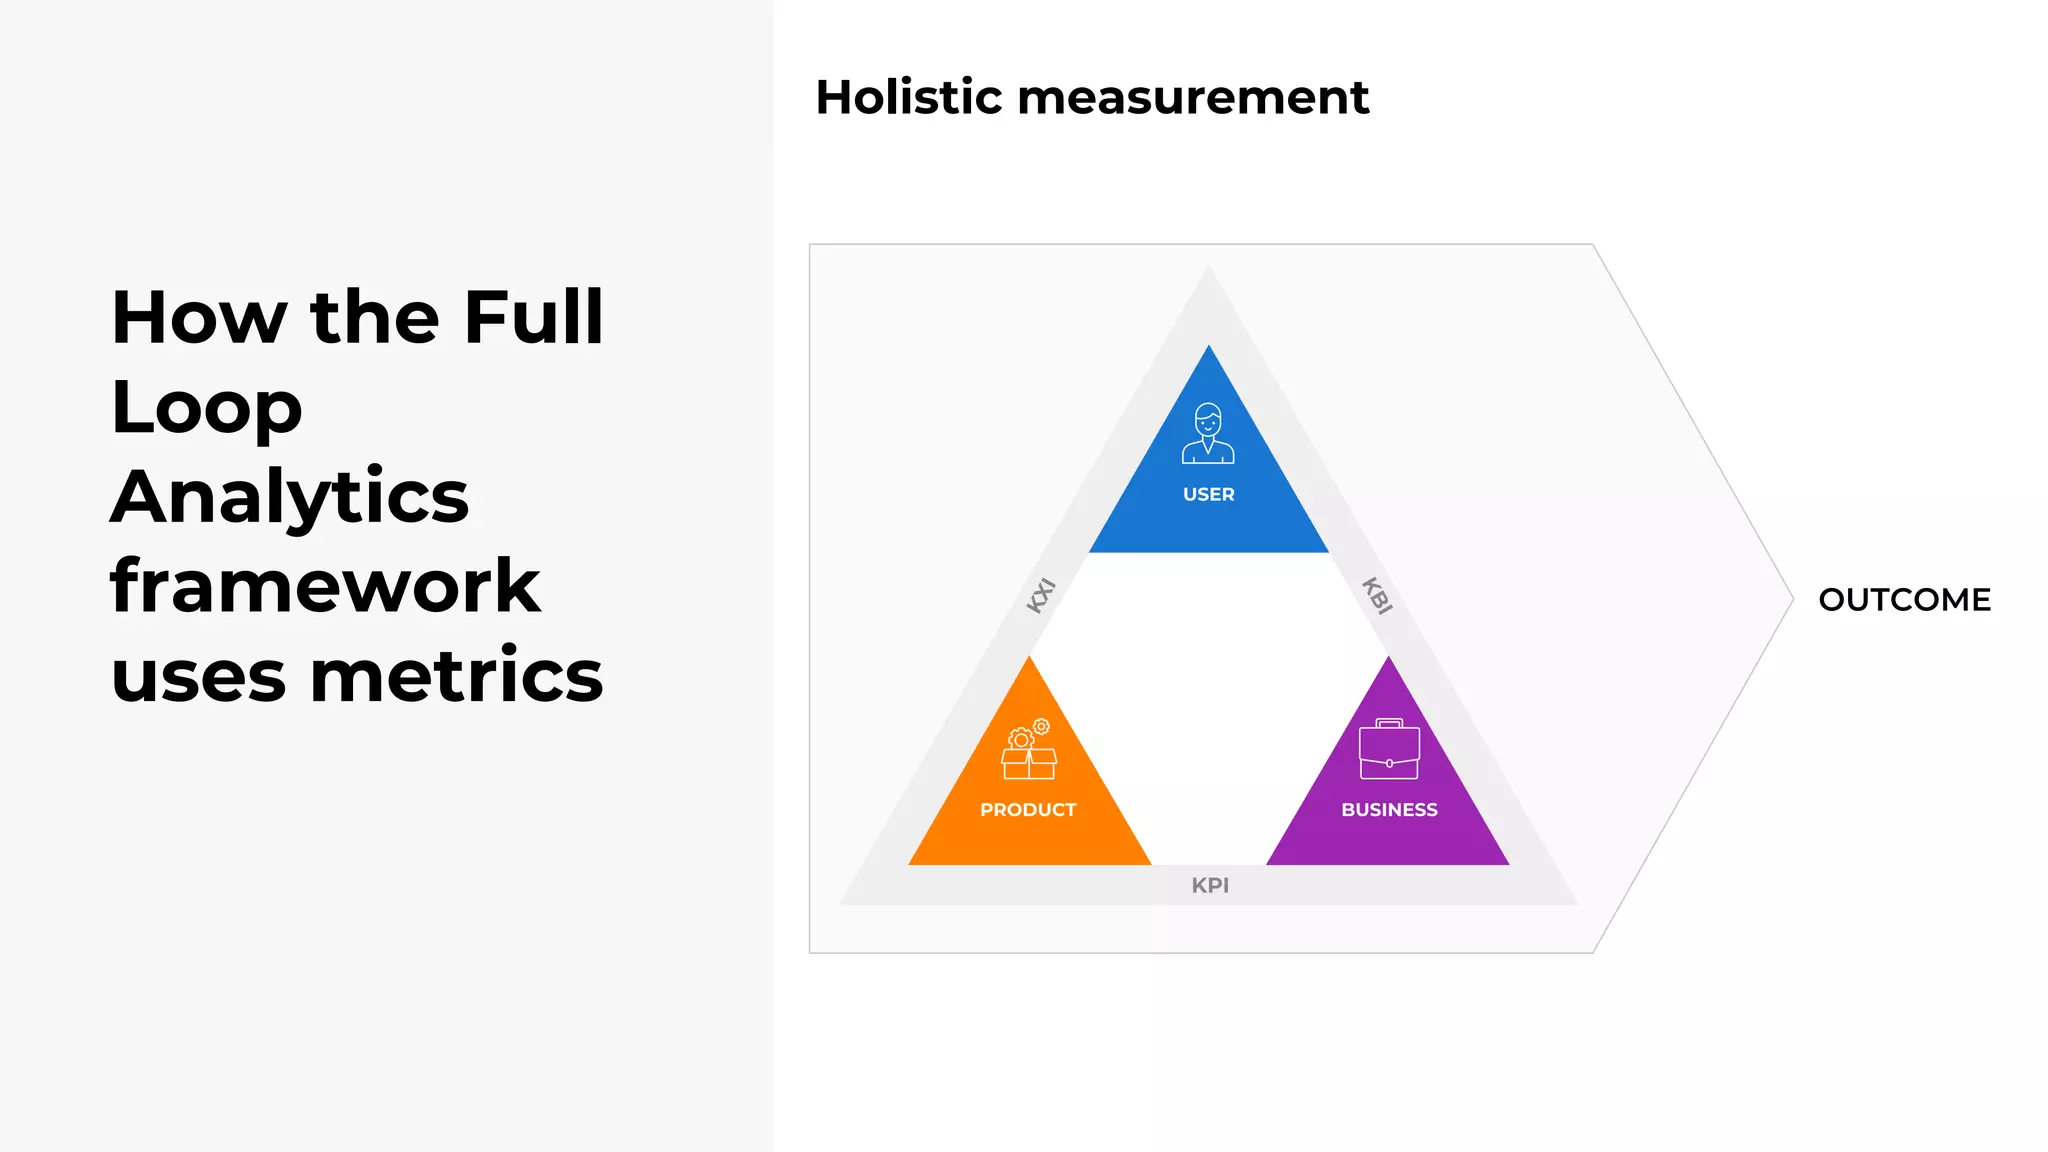
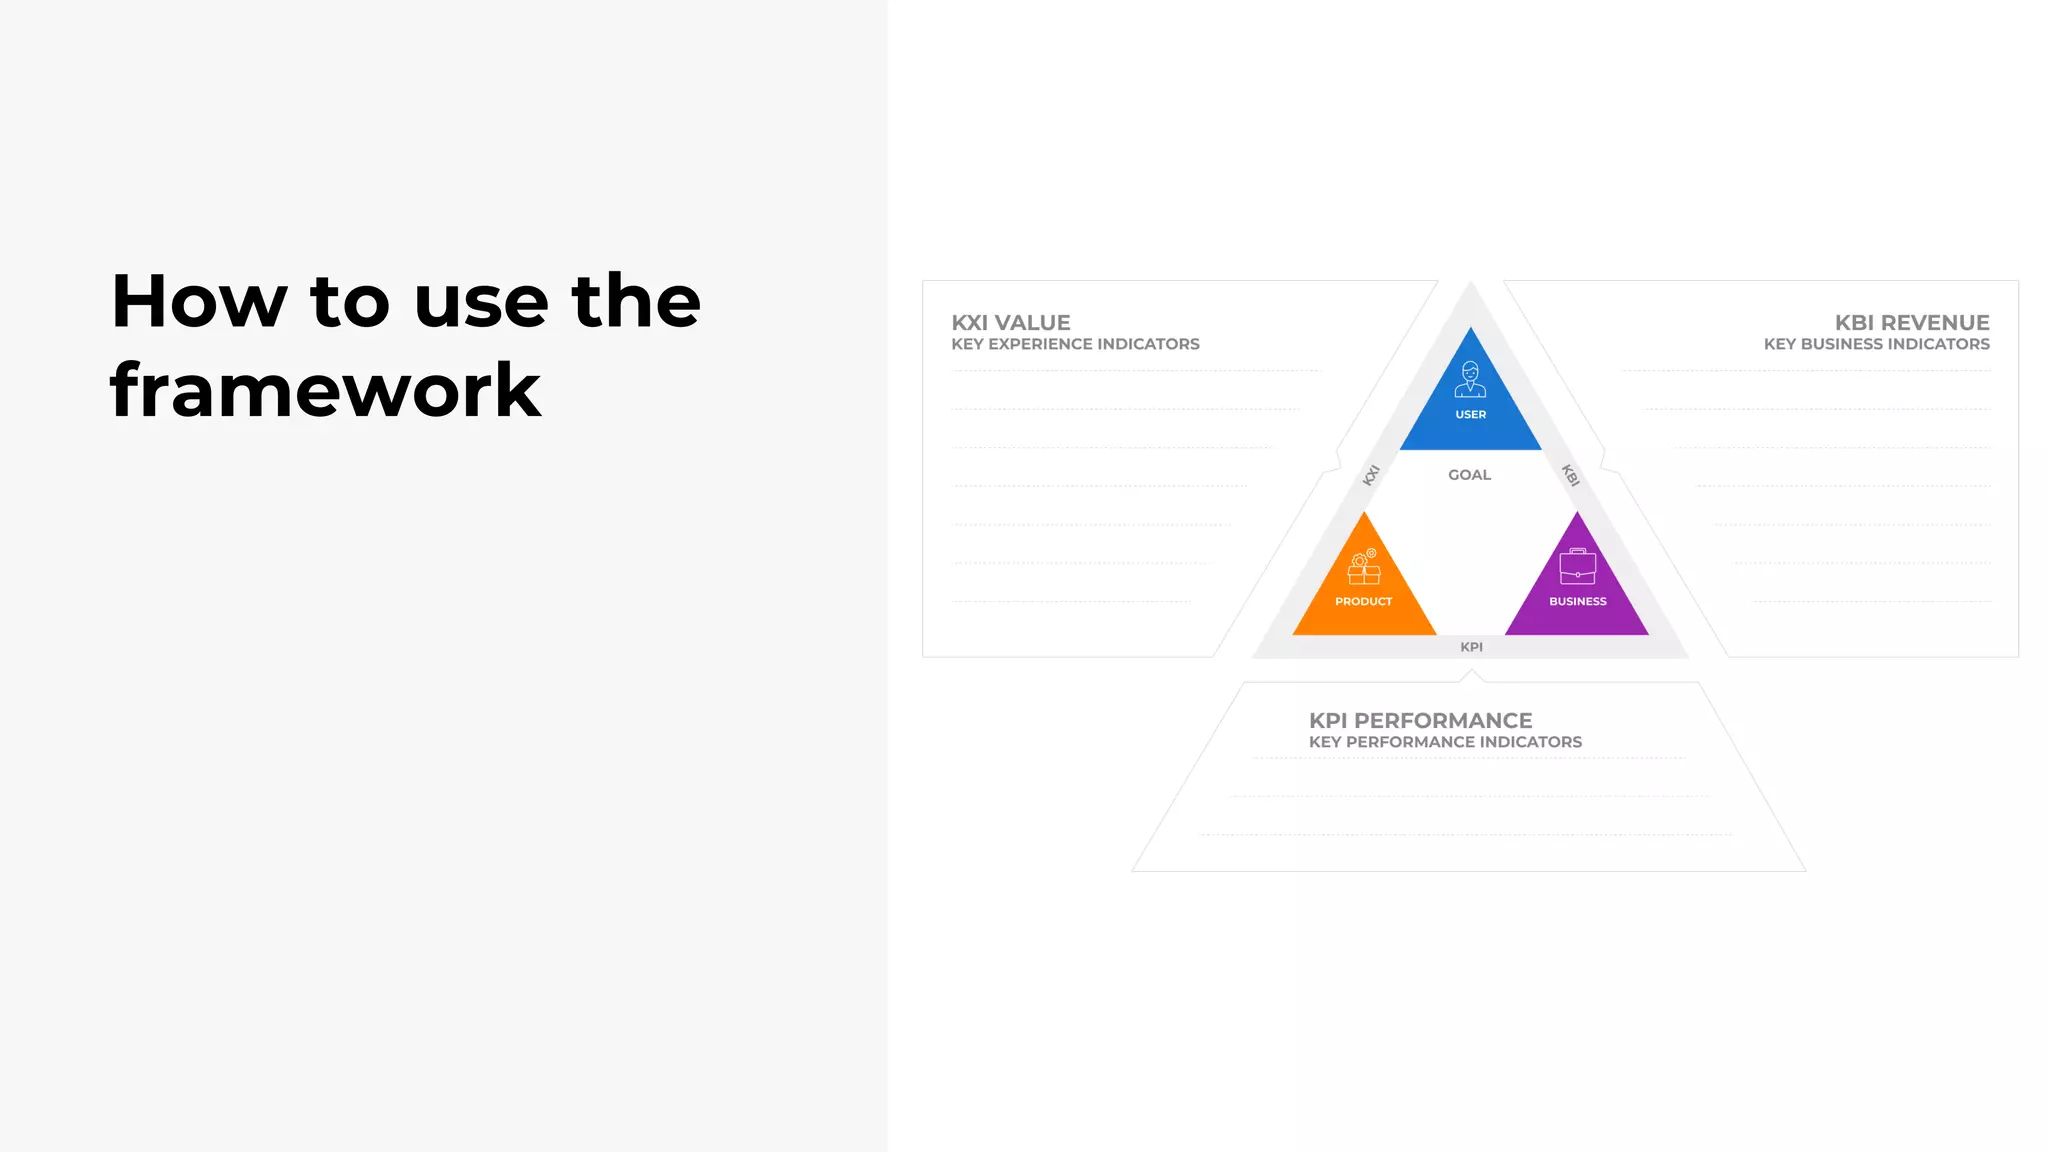
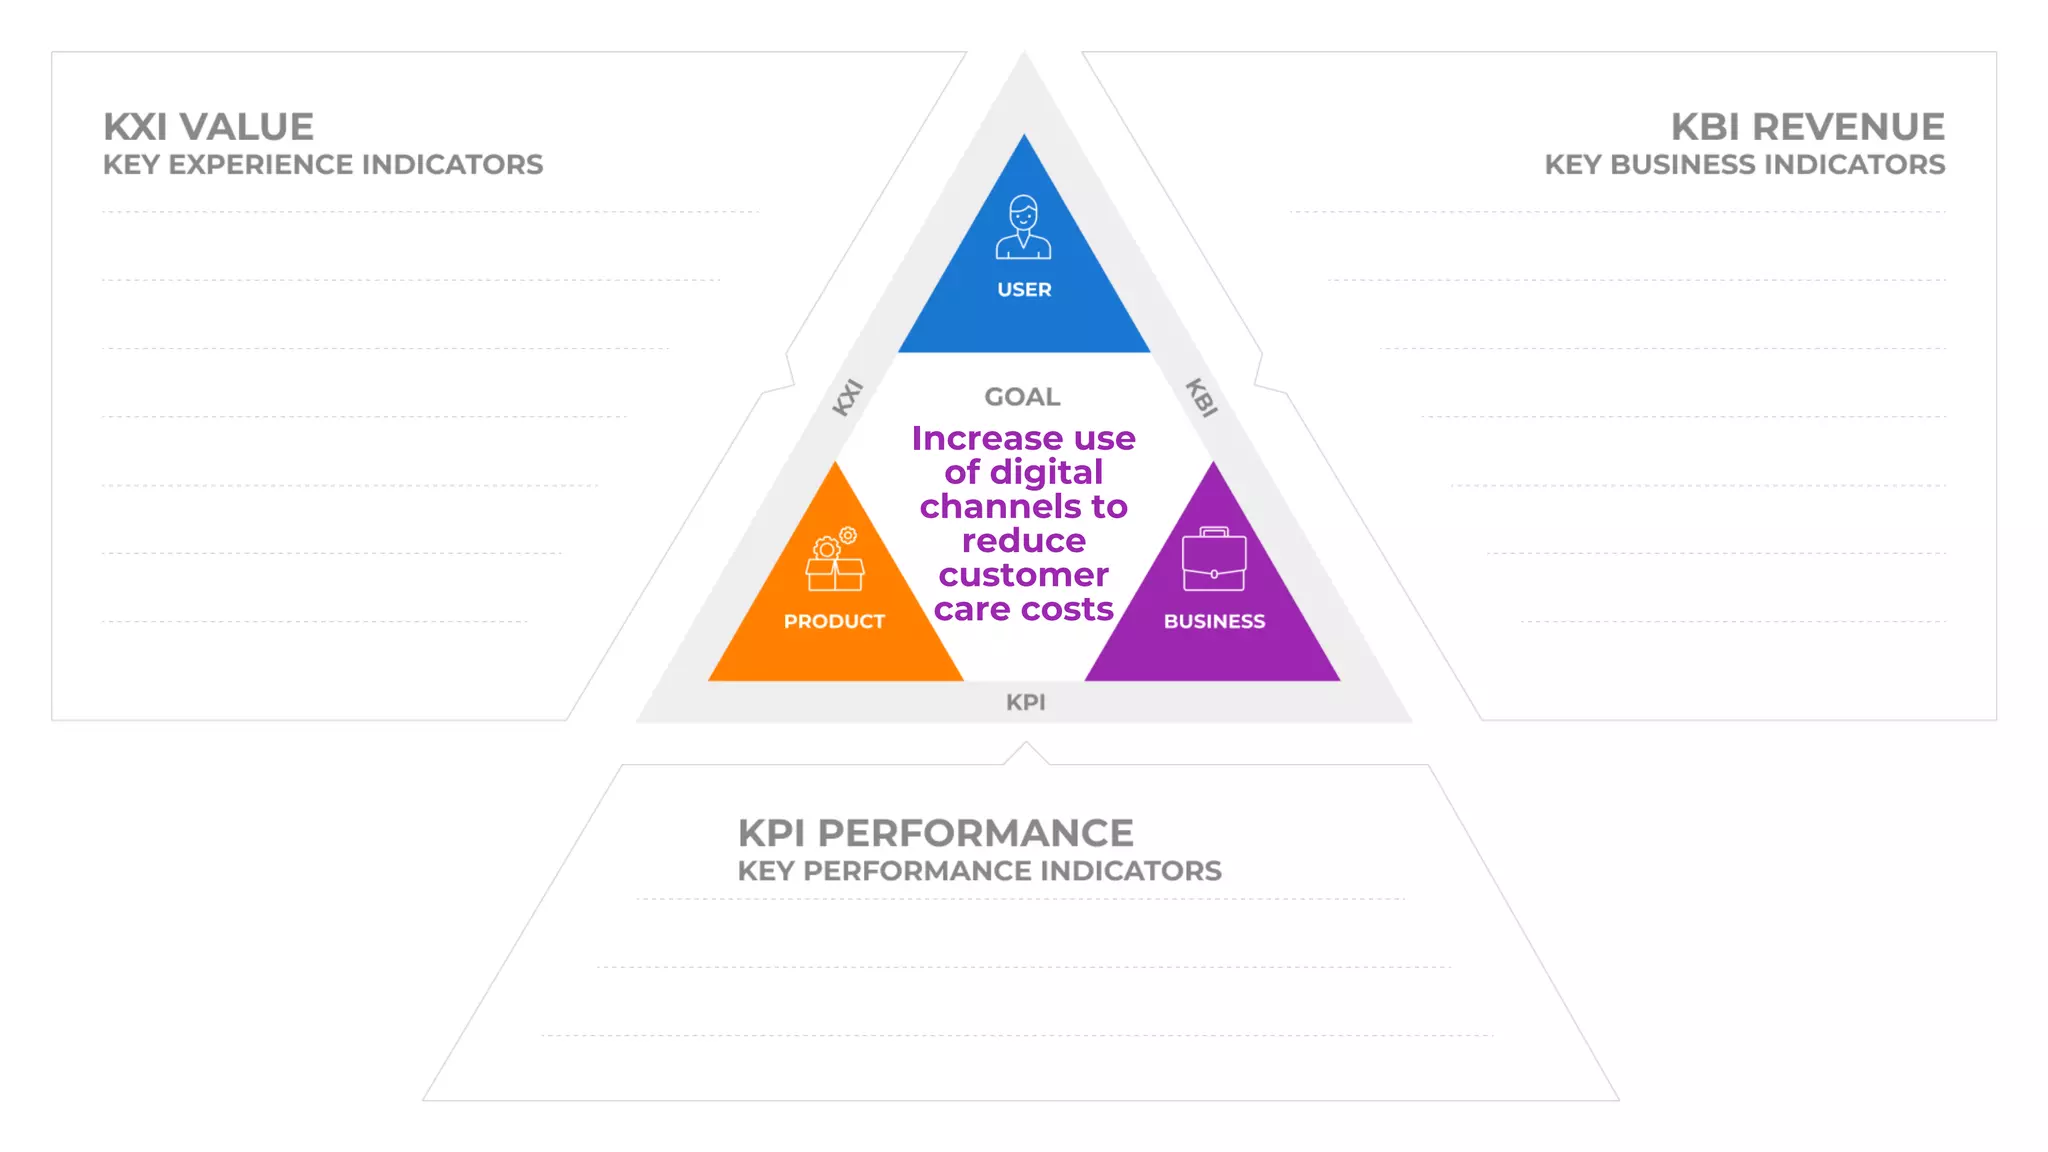
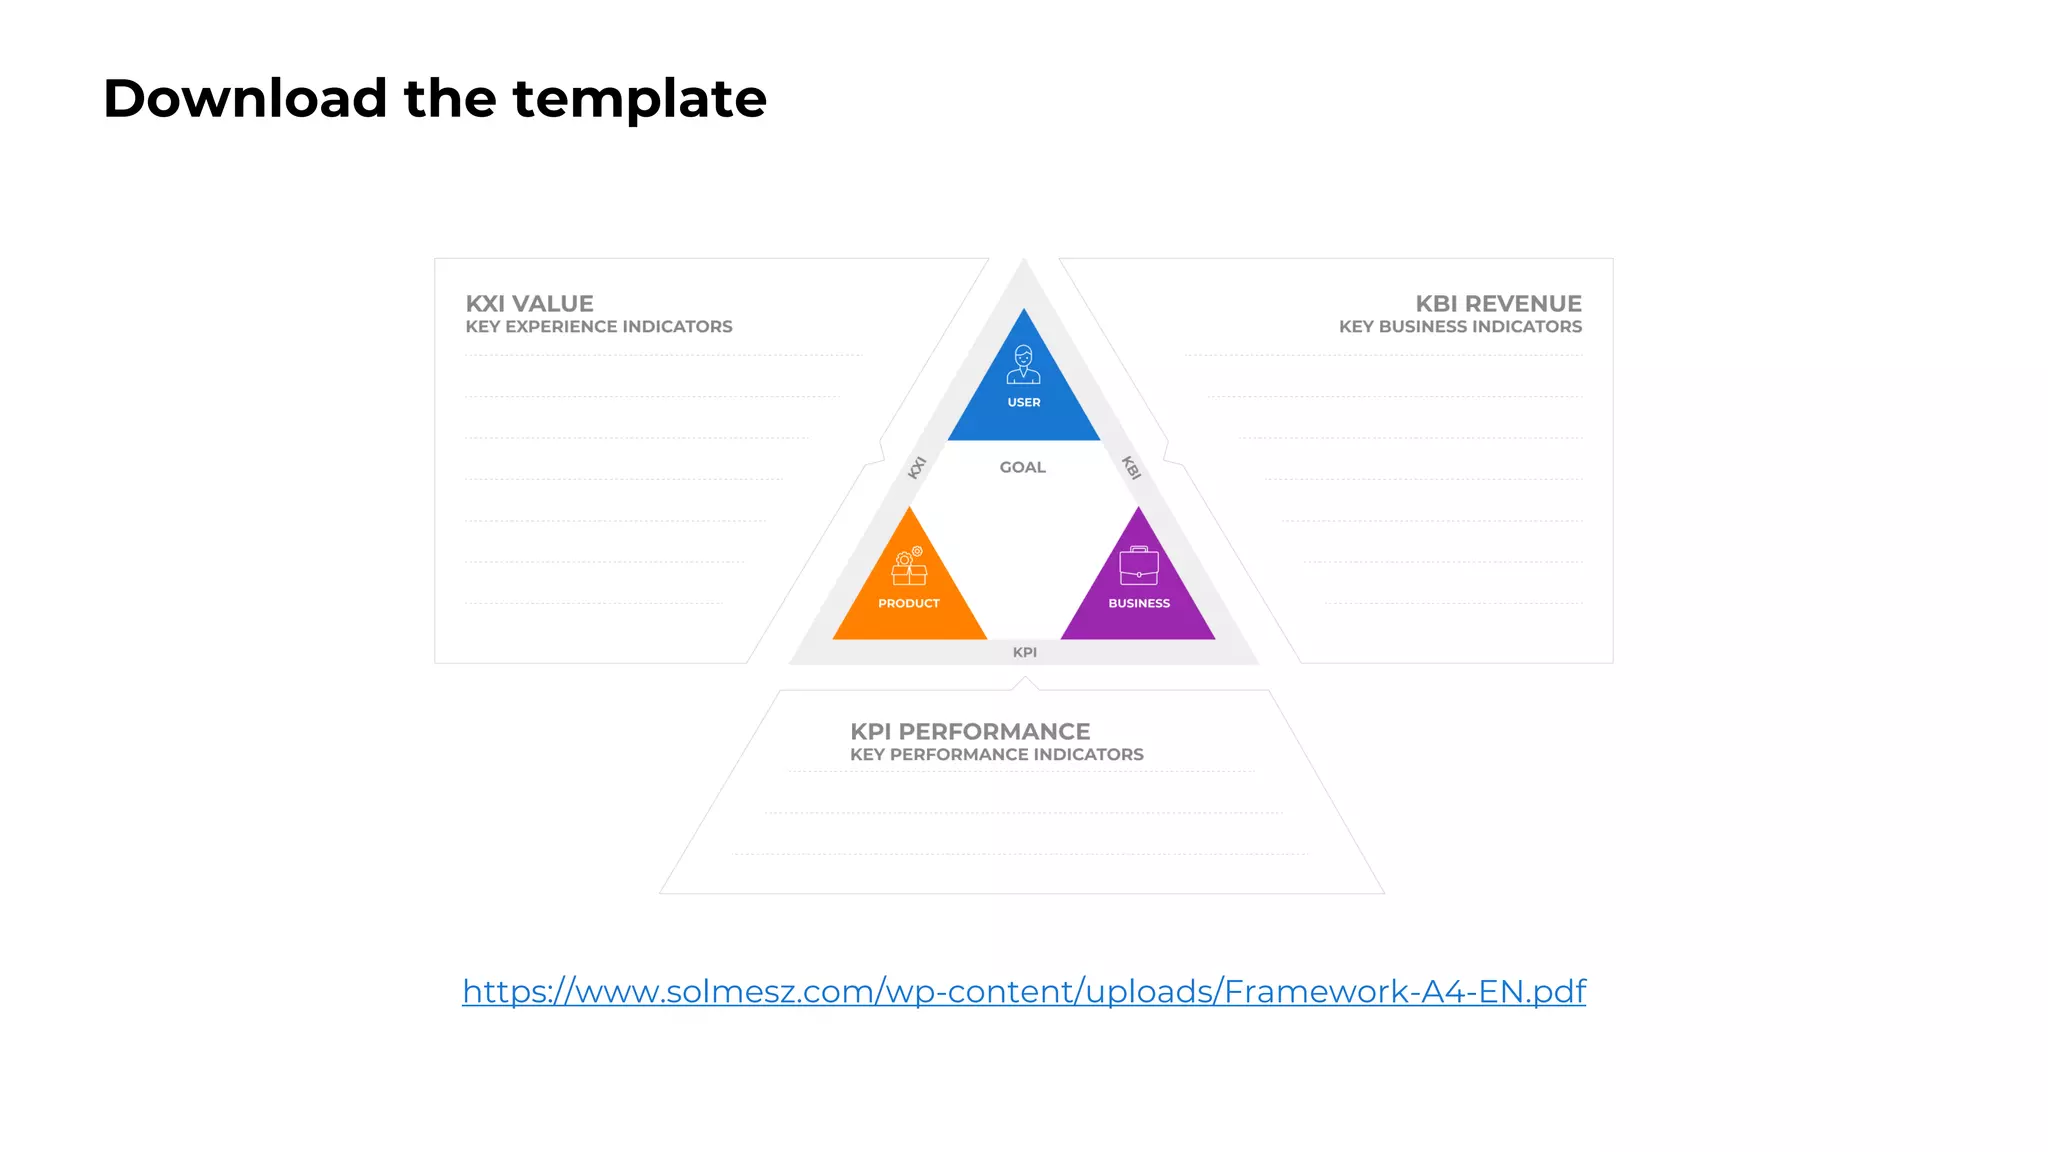
Detailed overview of the Full Loop Analytics Framework, emphasizing user desirability and business viability.
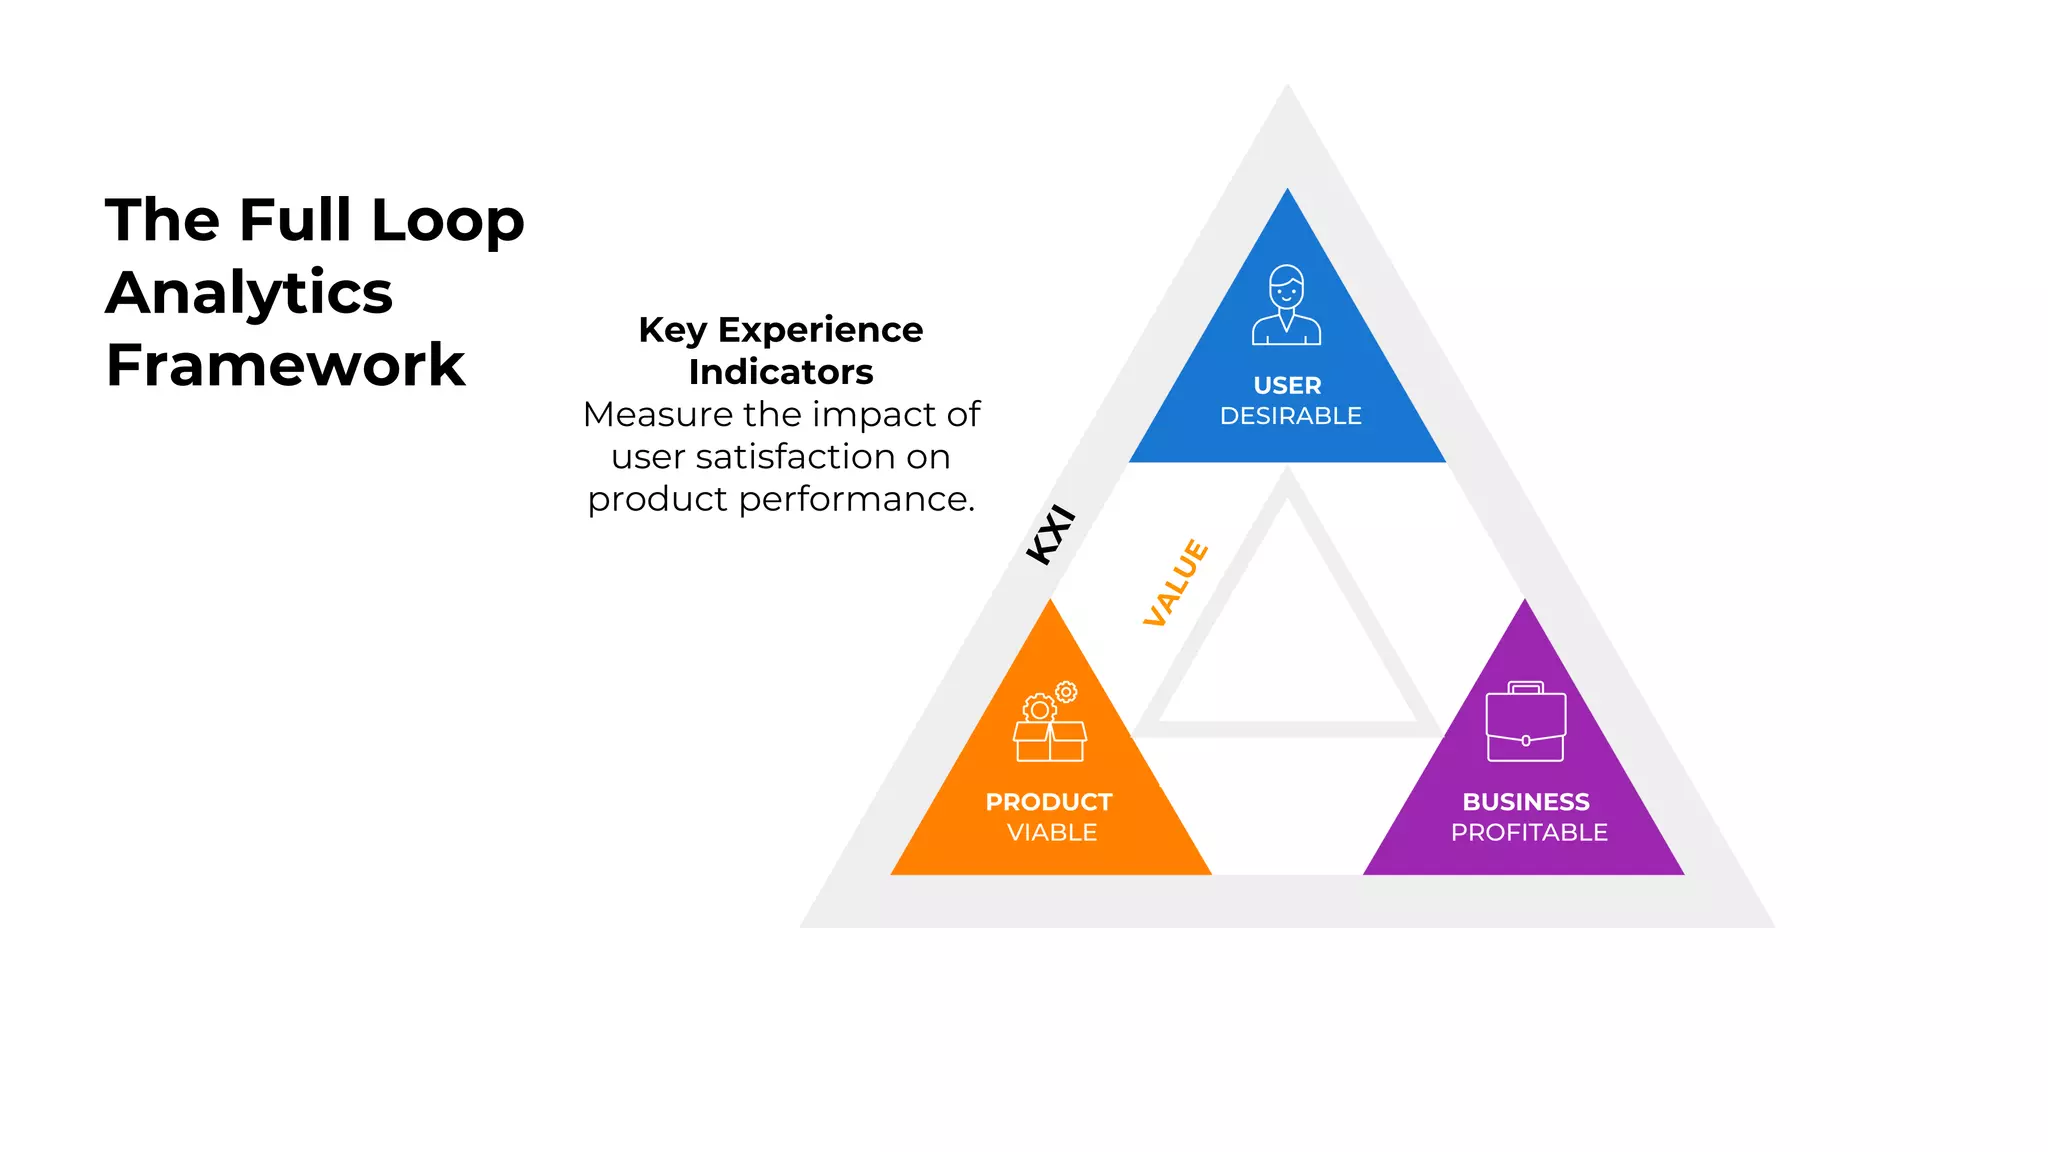
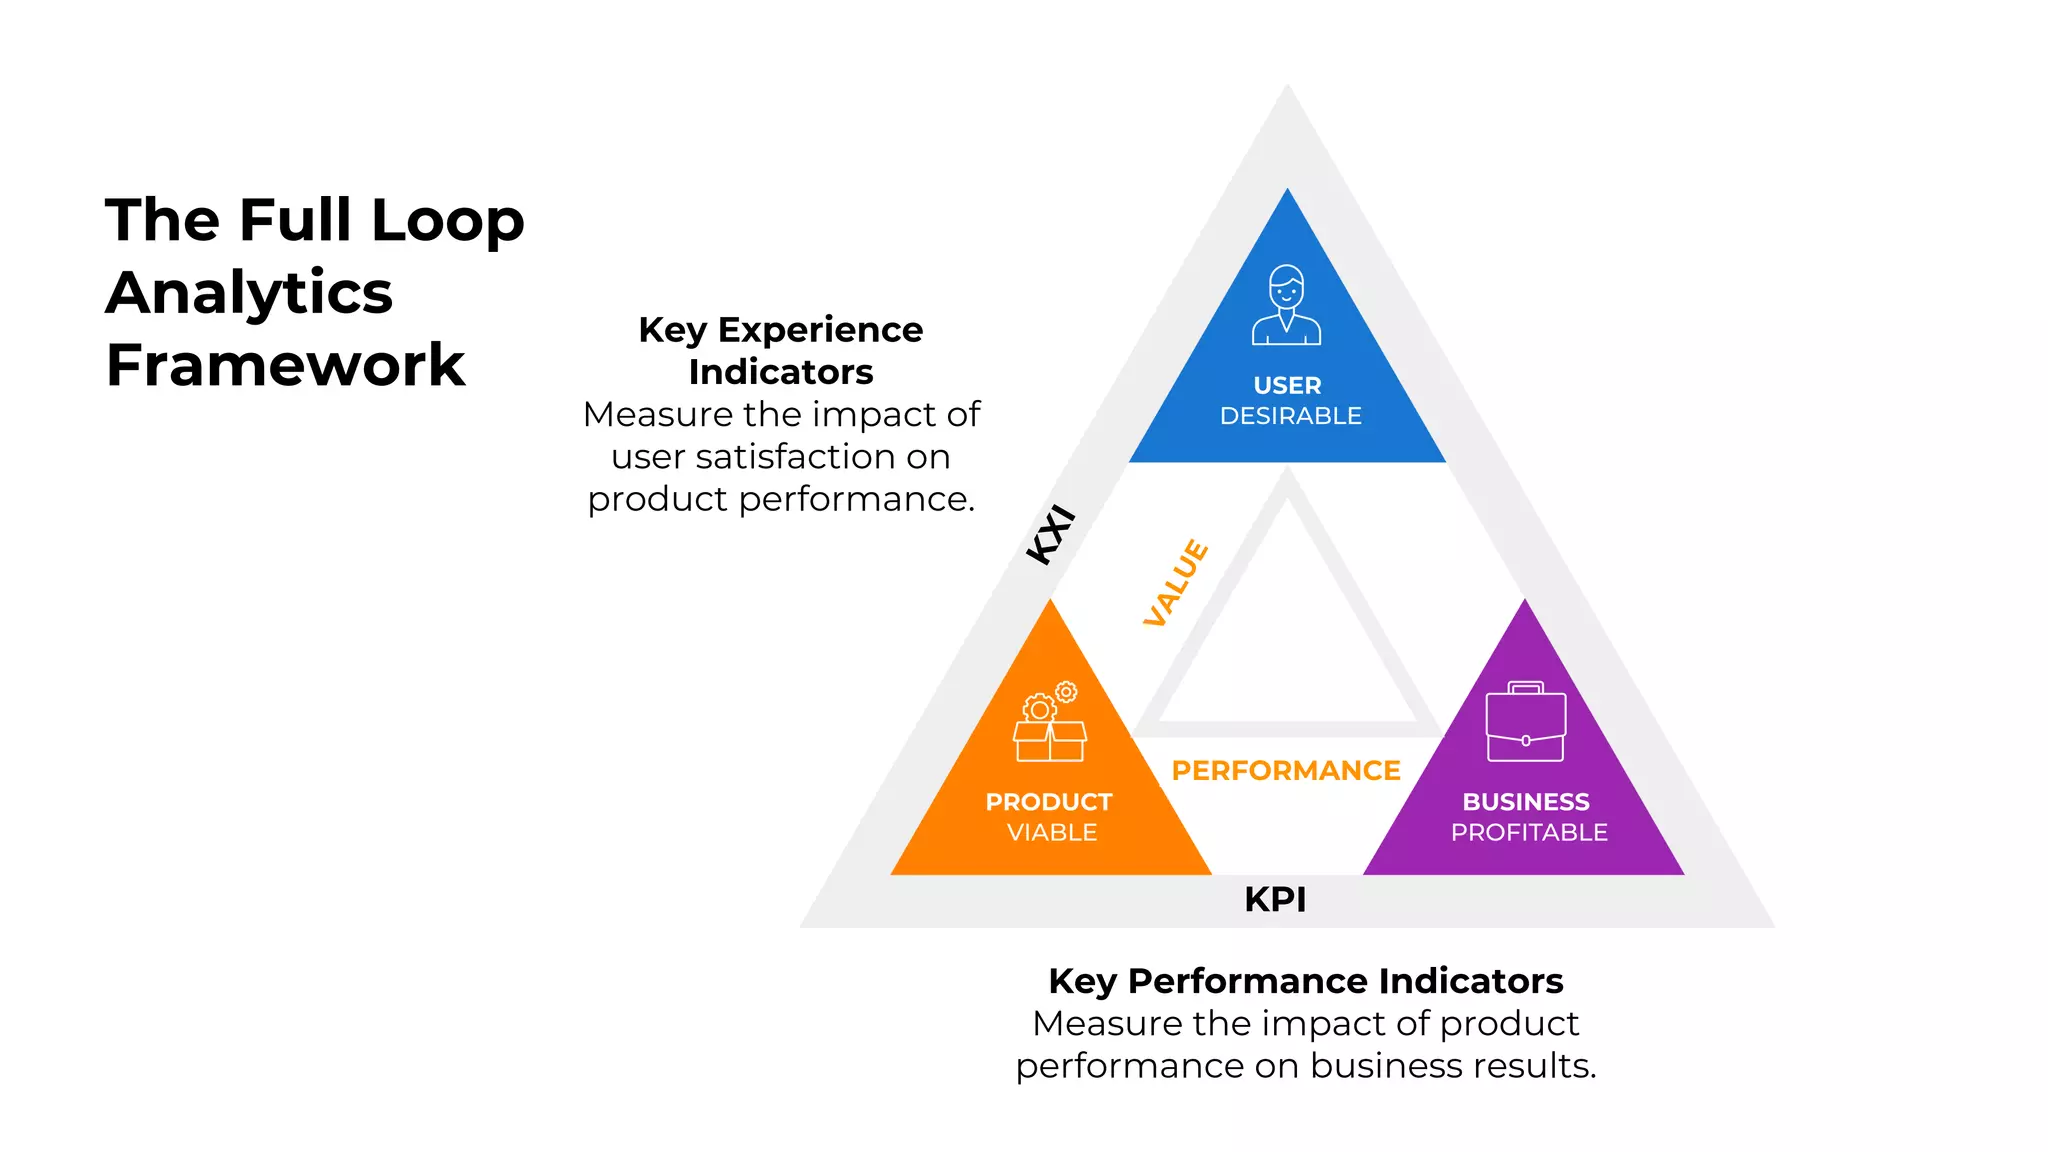
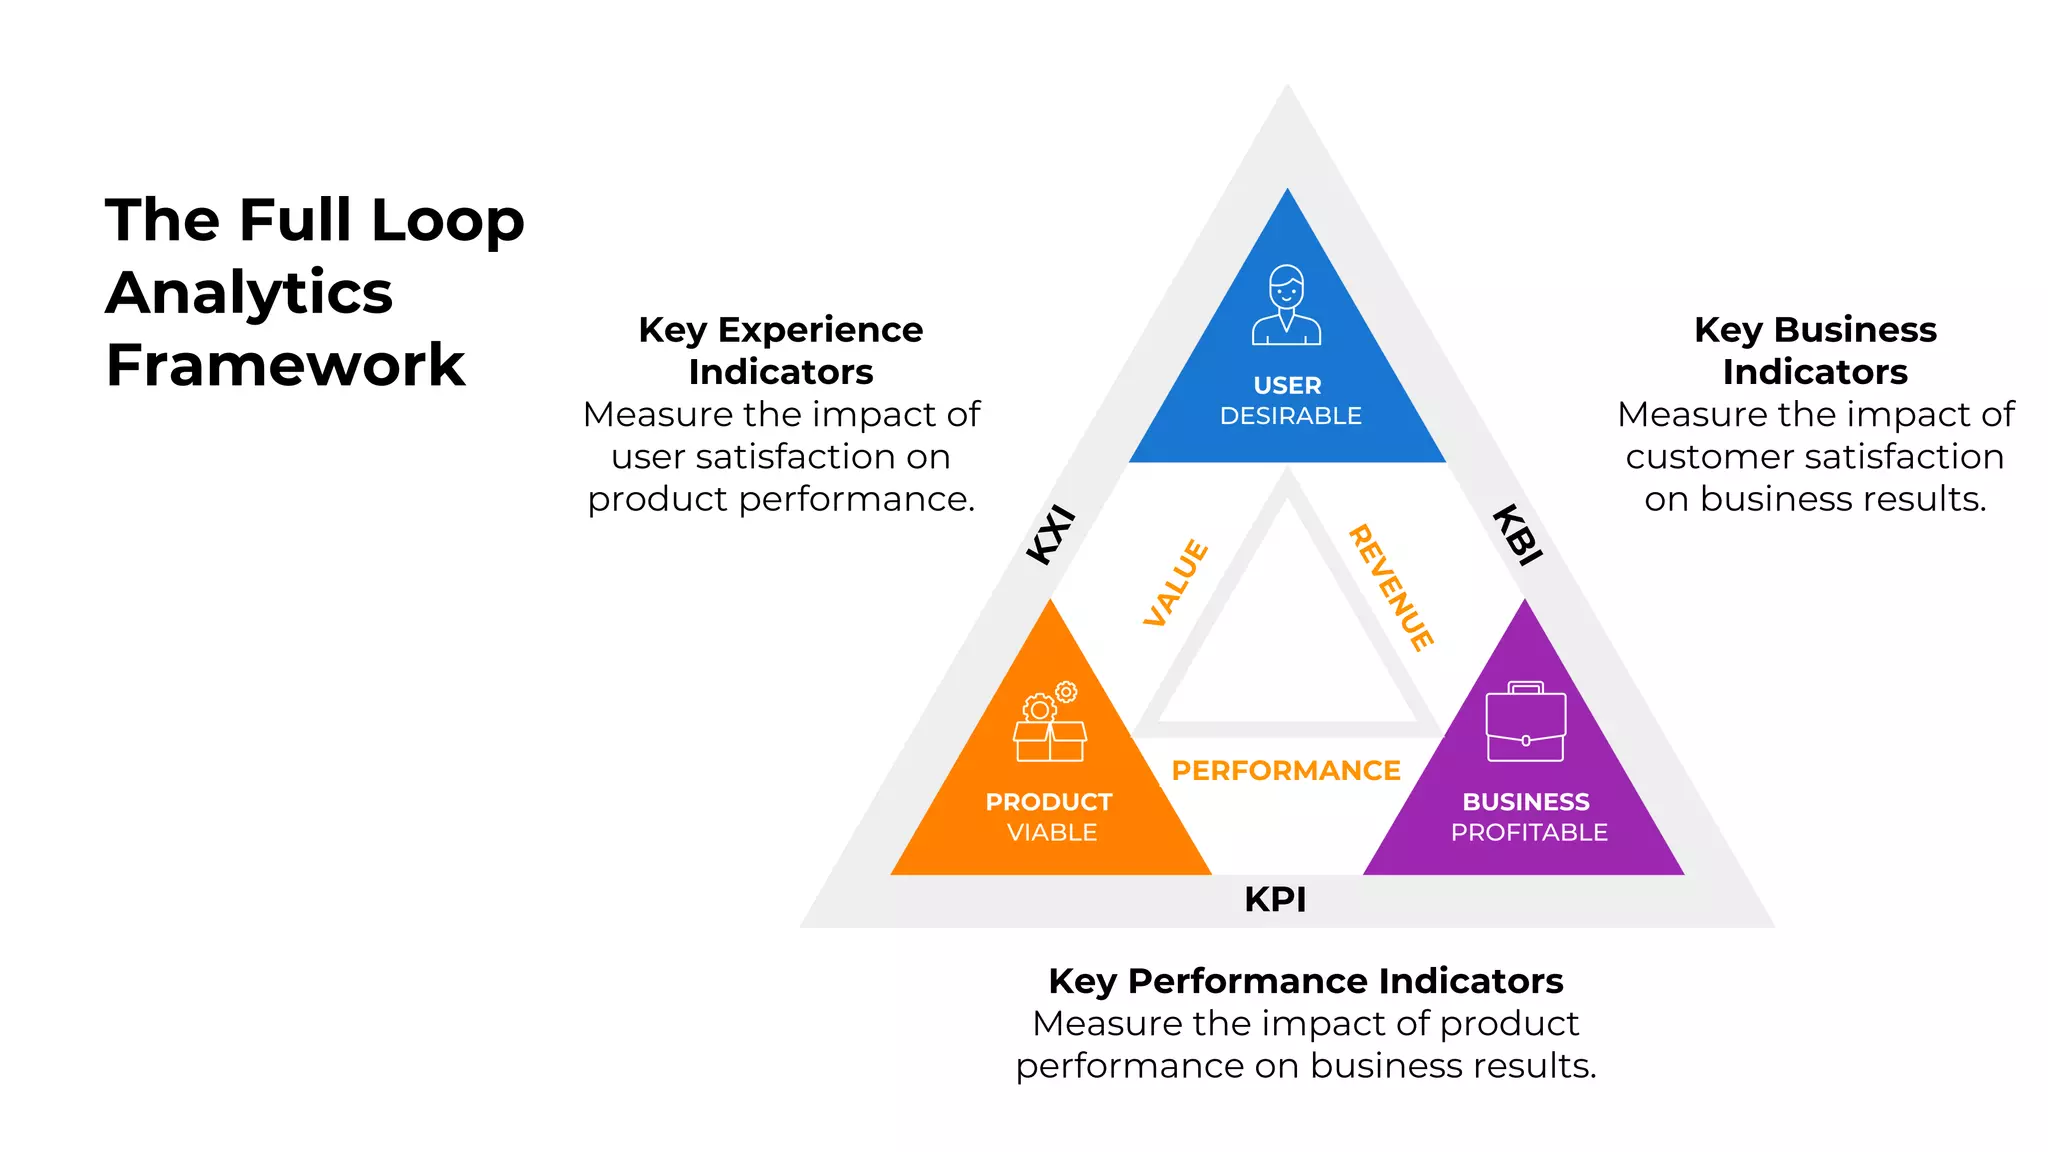
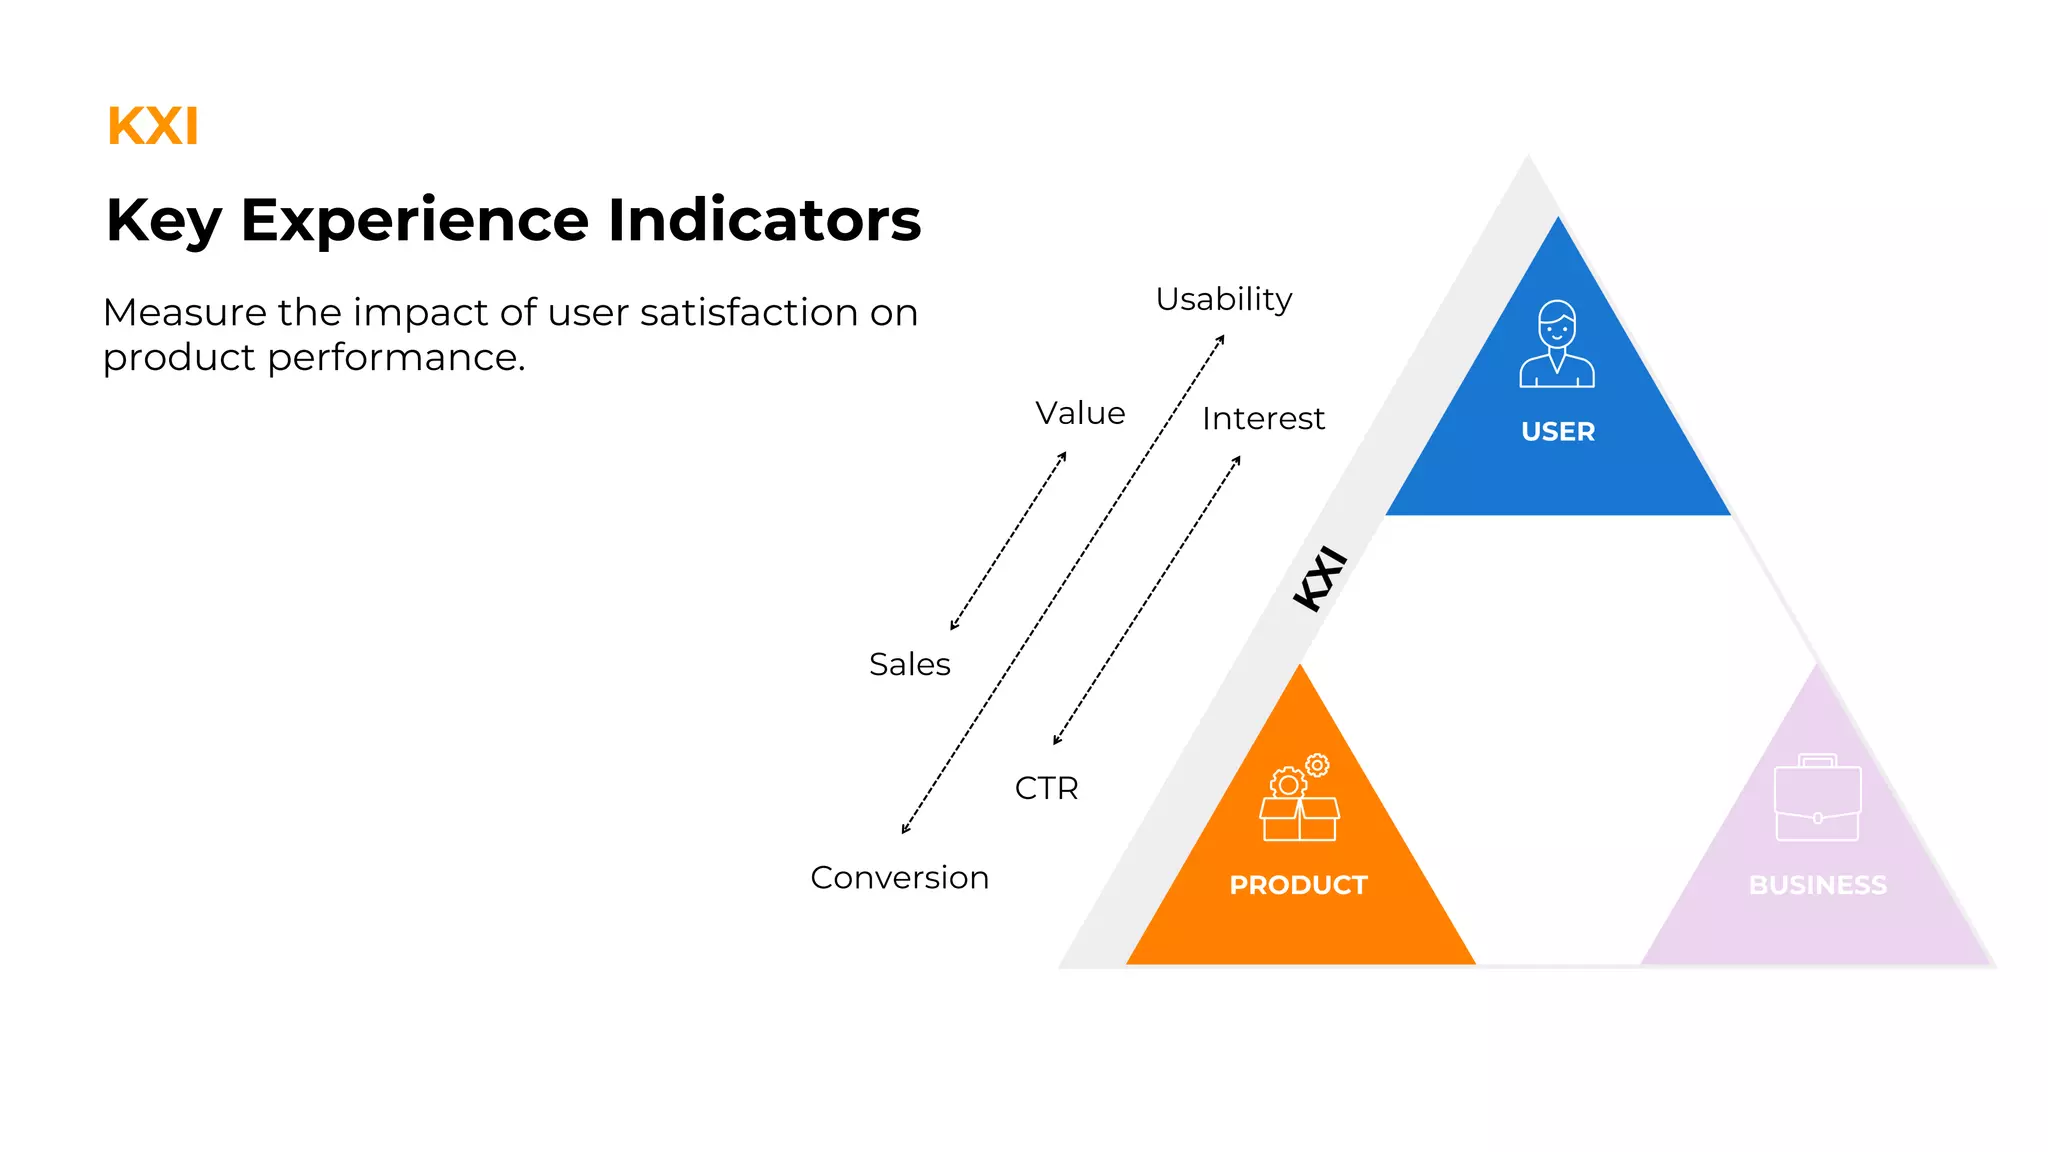
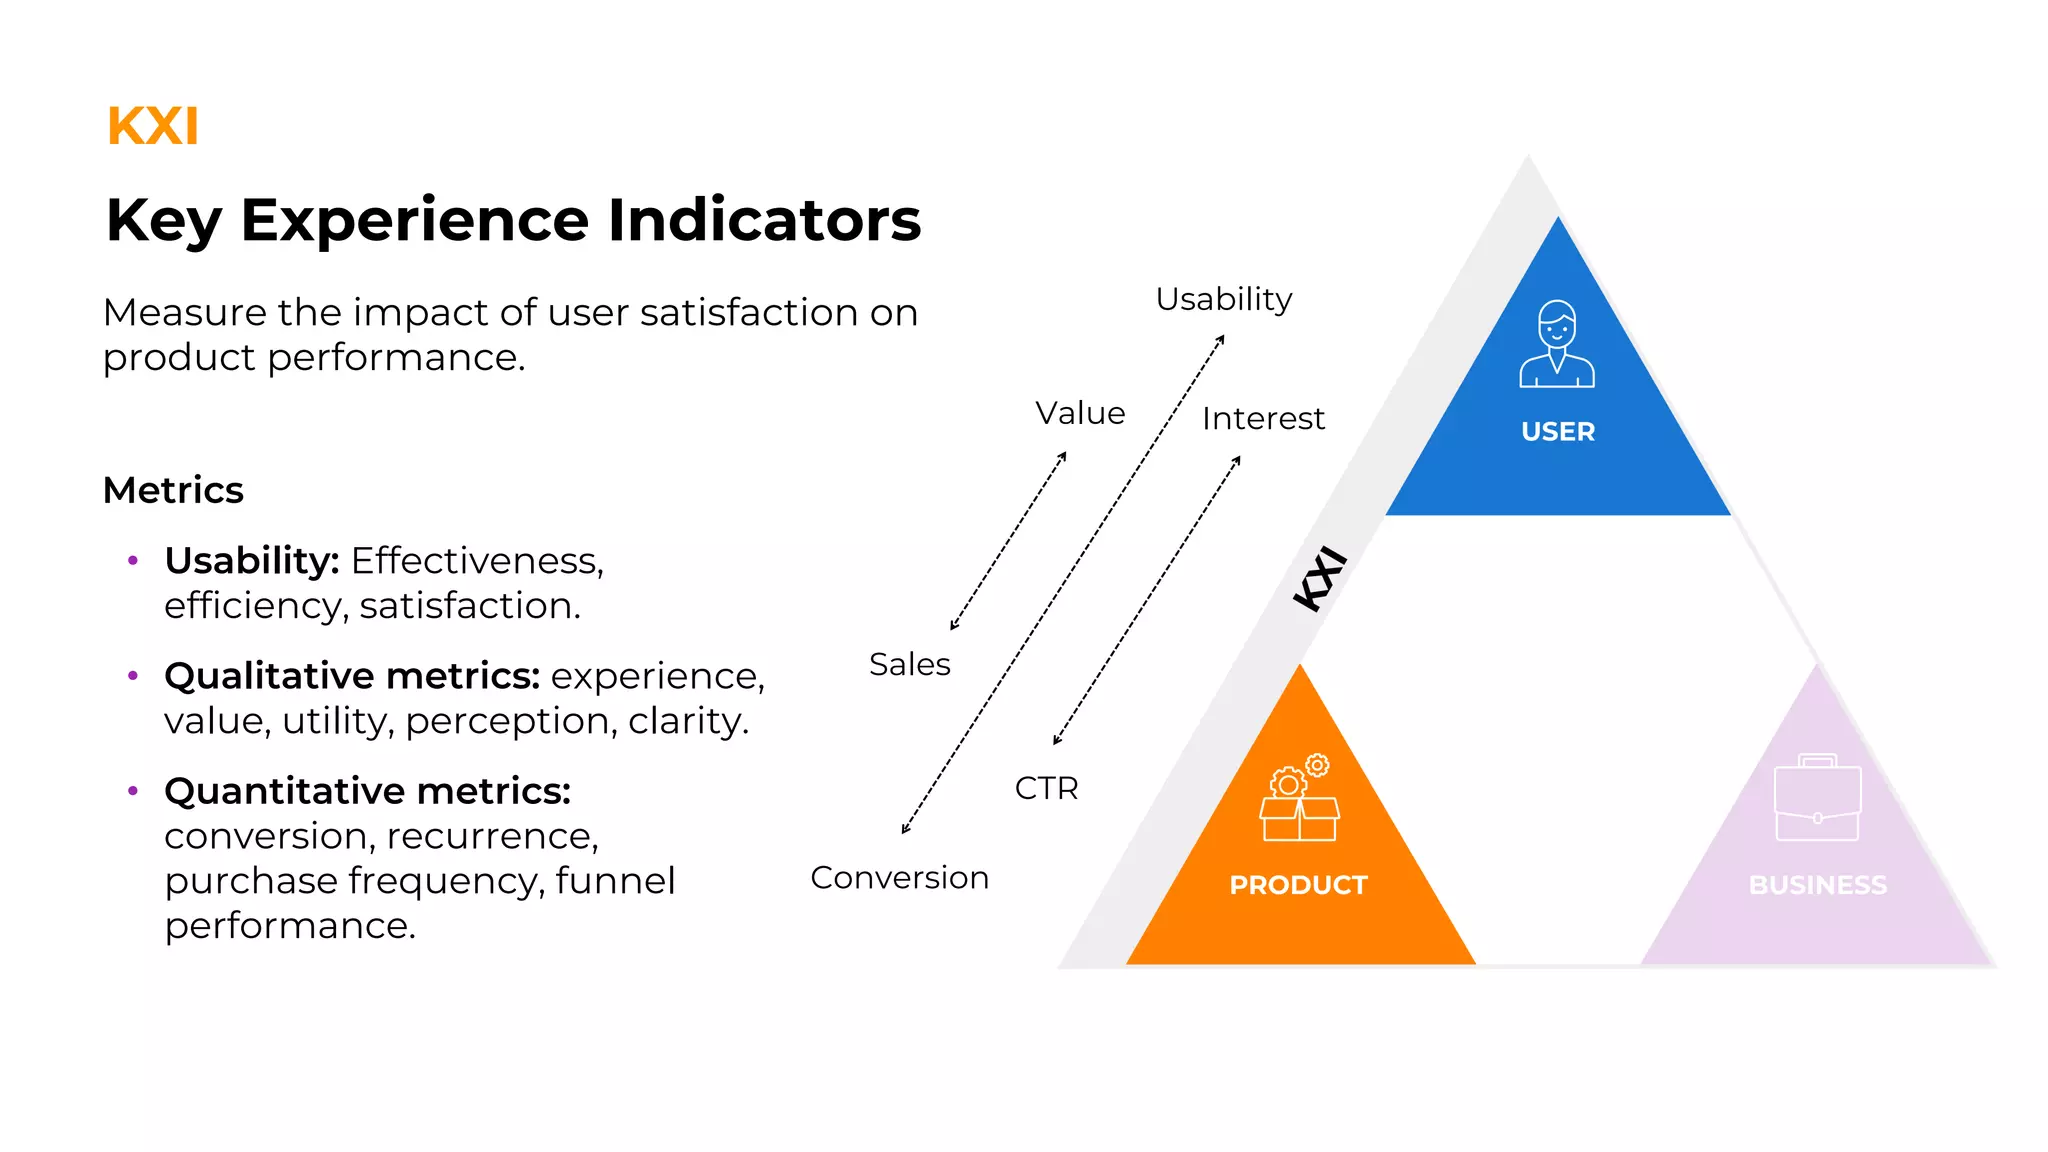
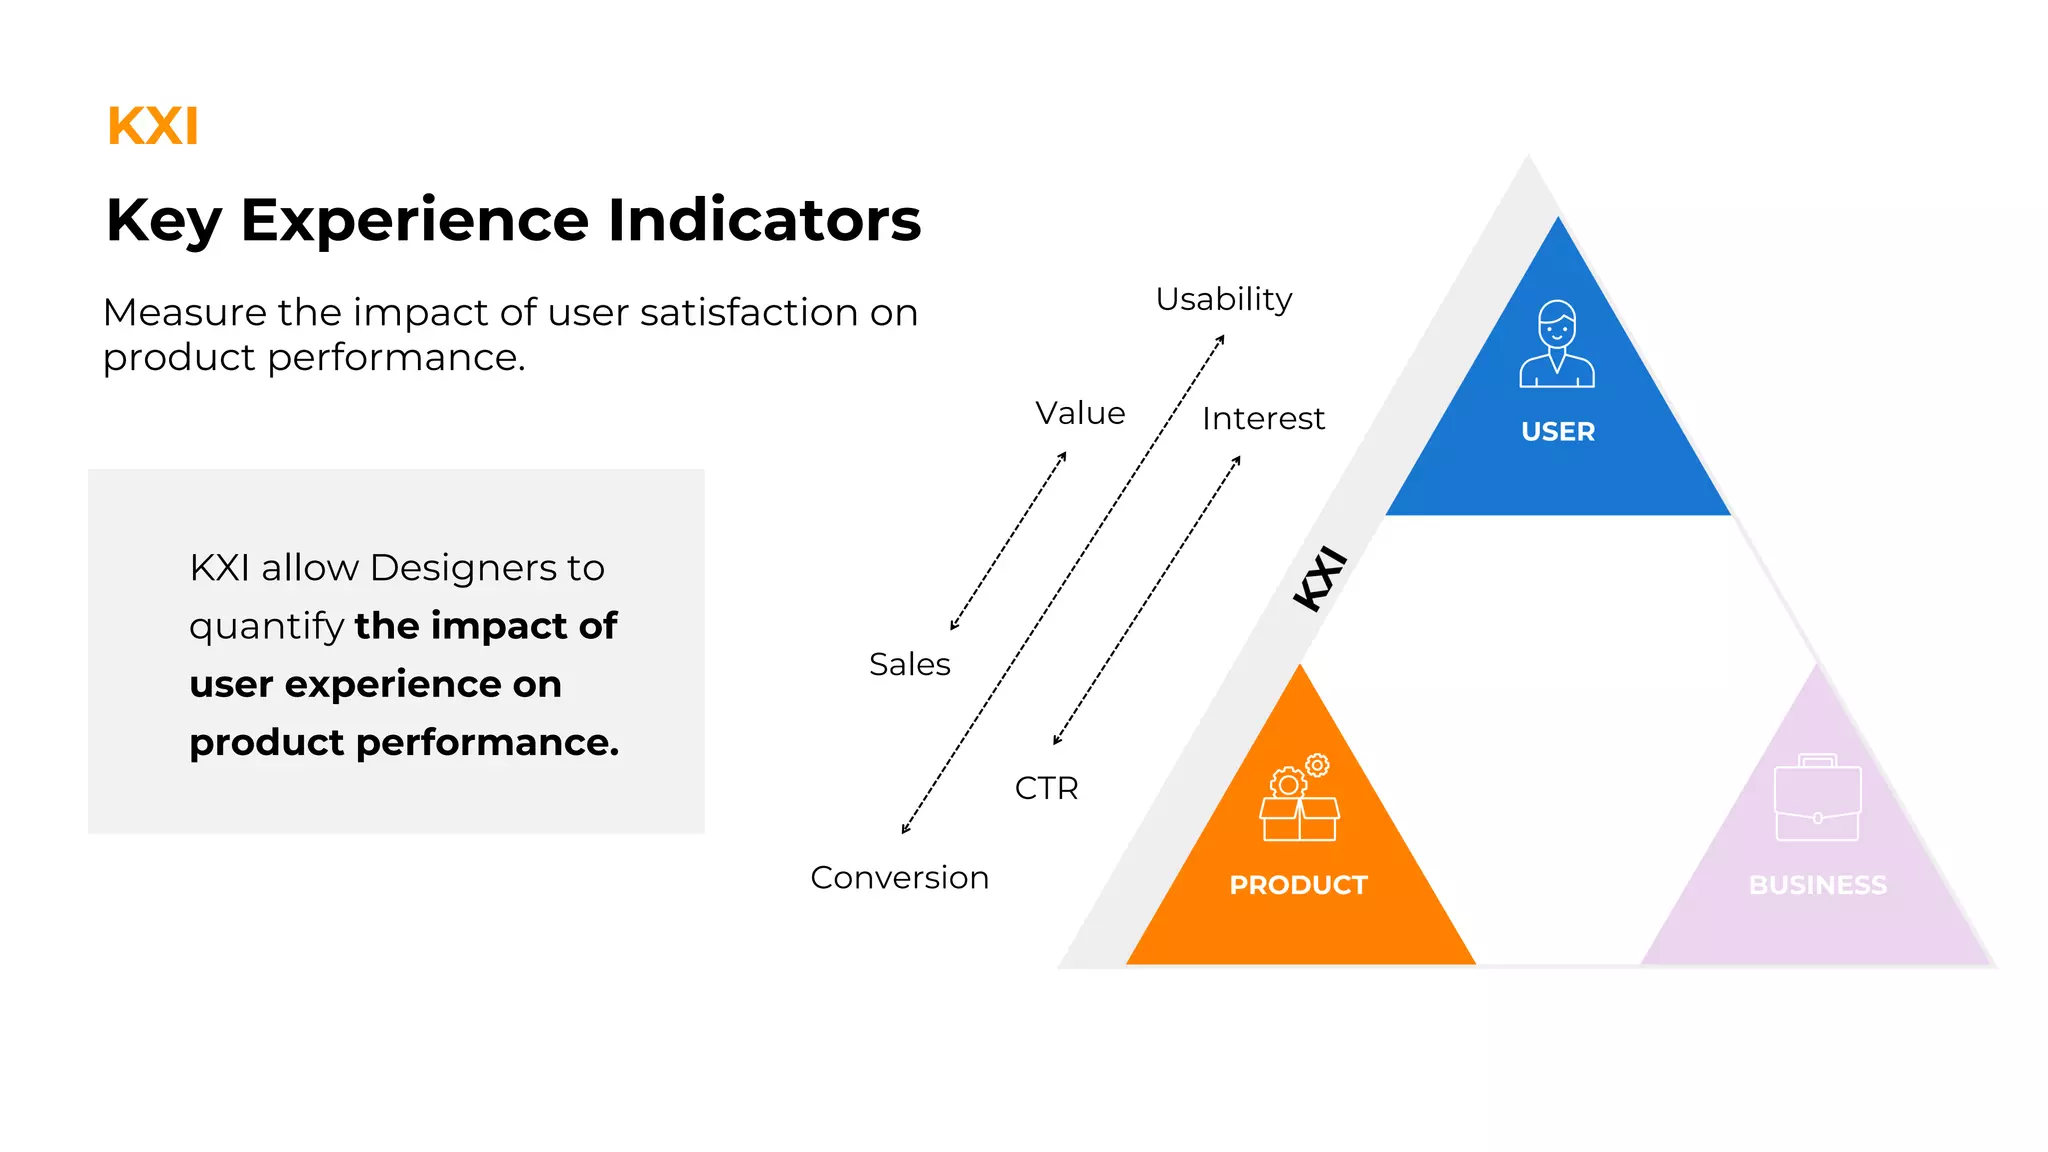
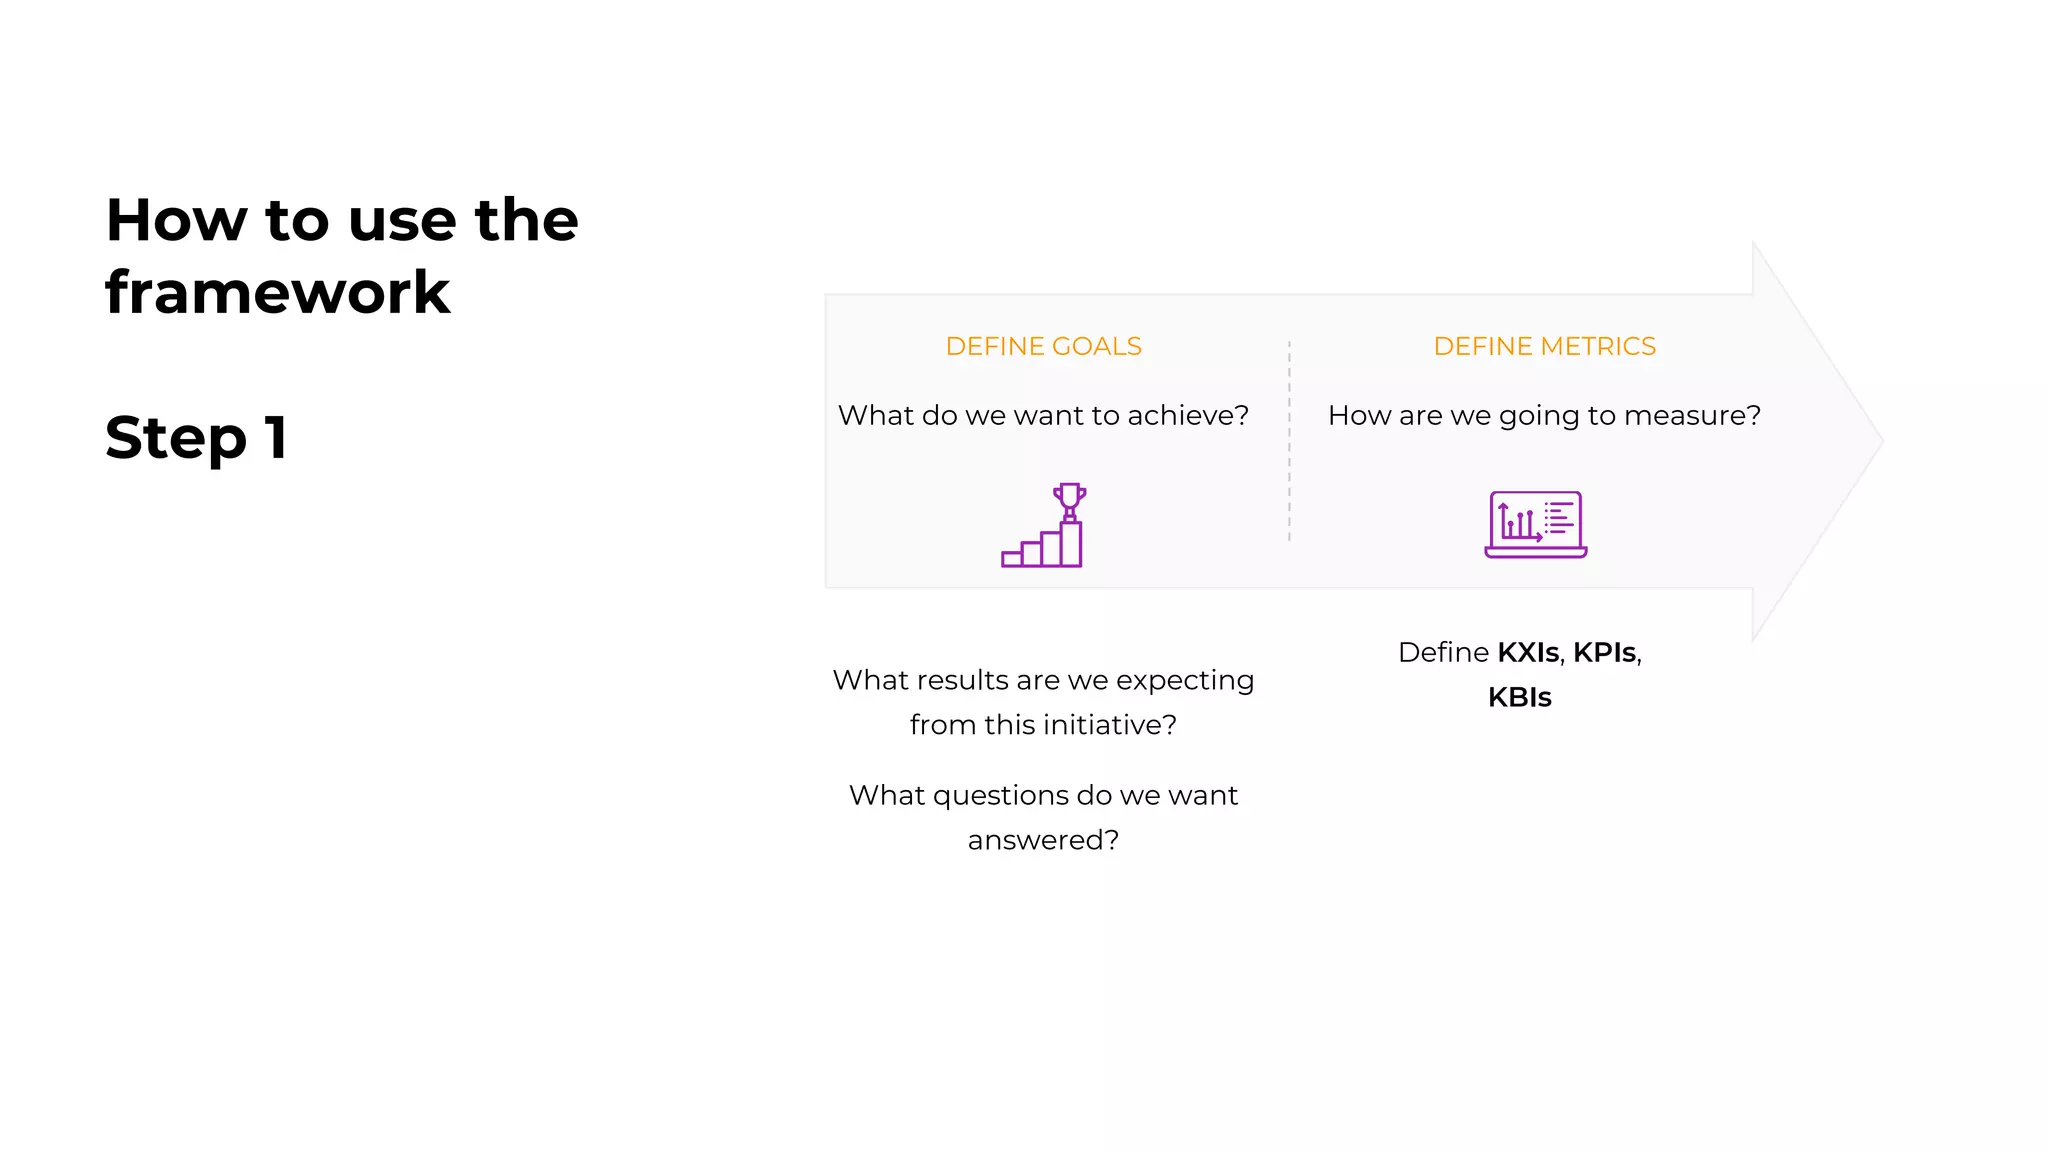
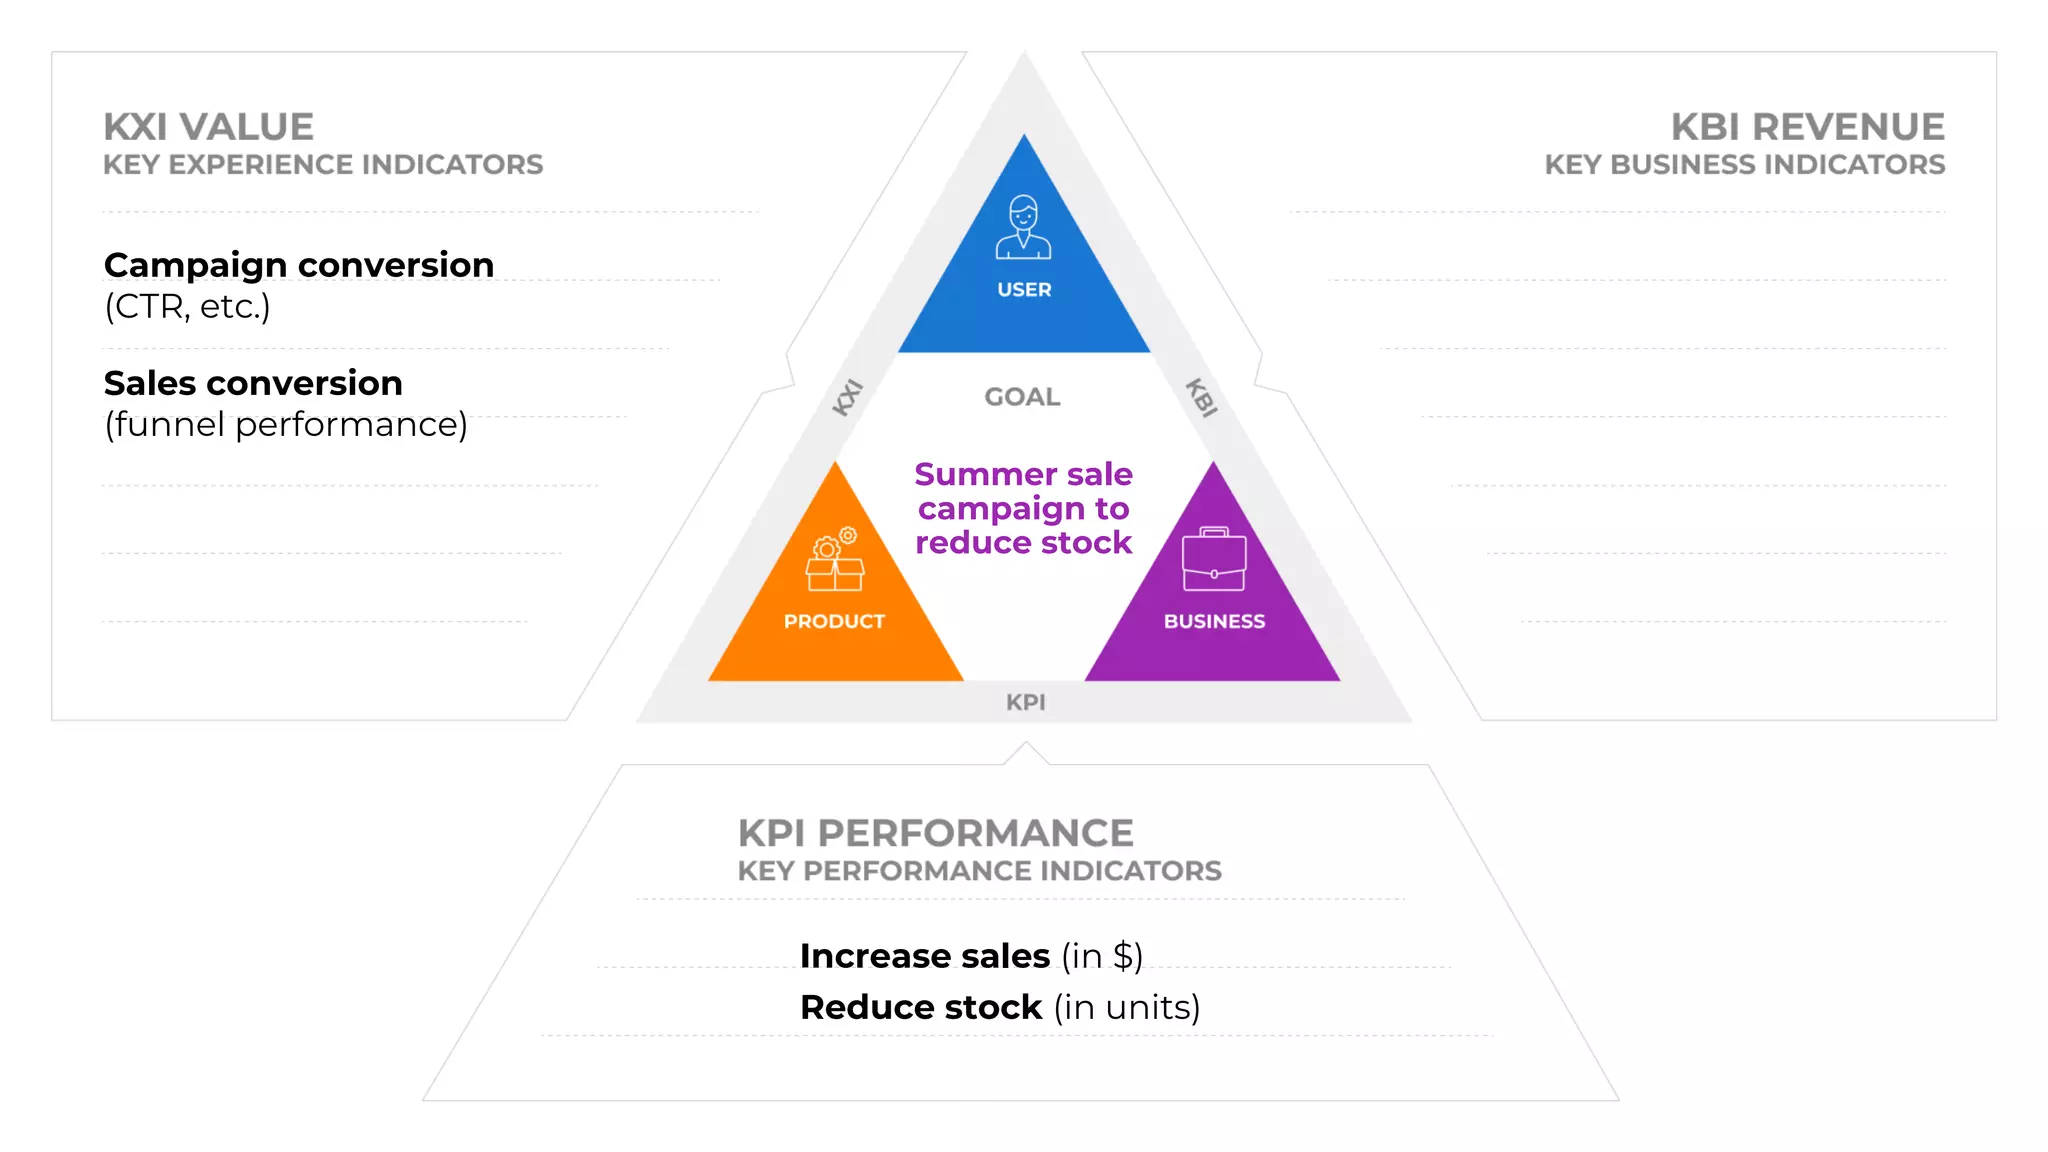
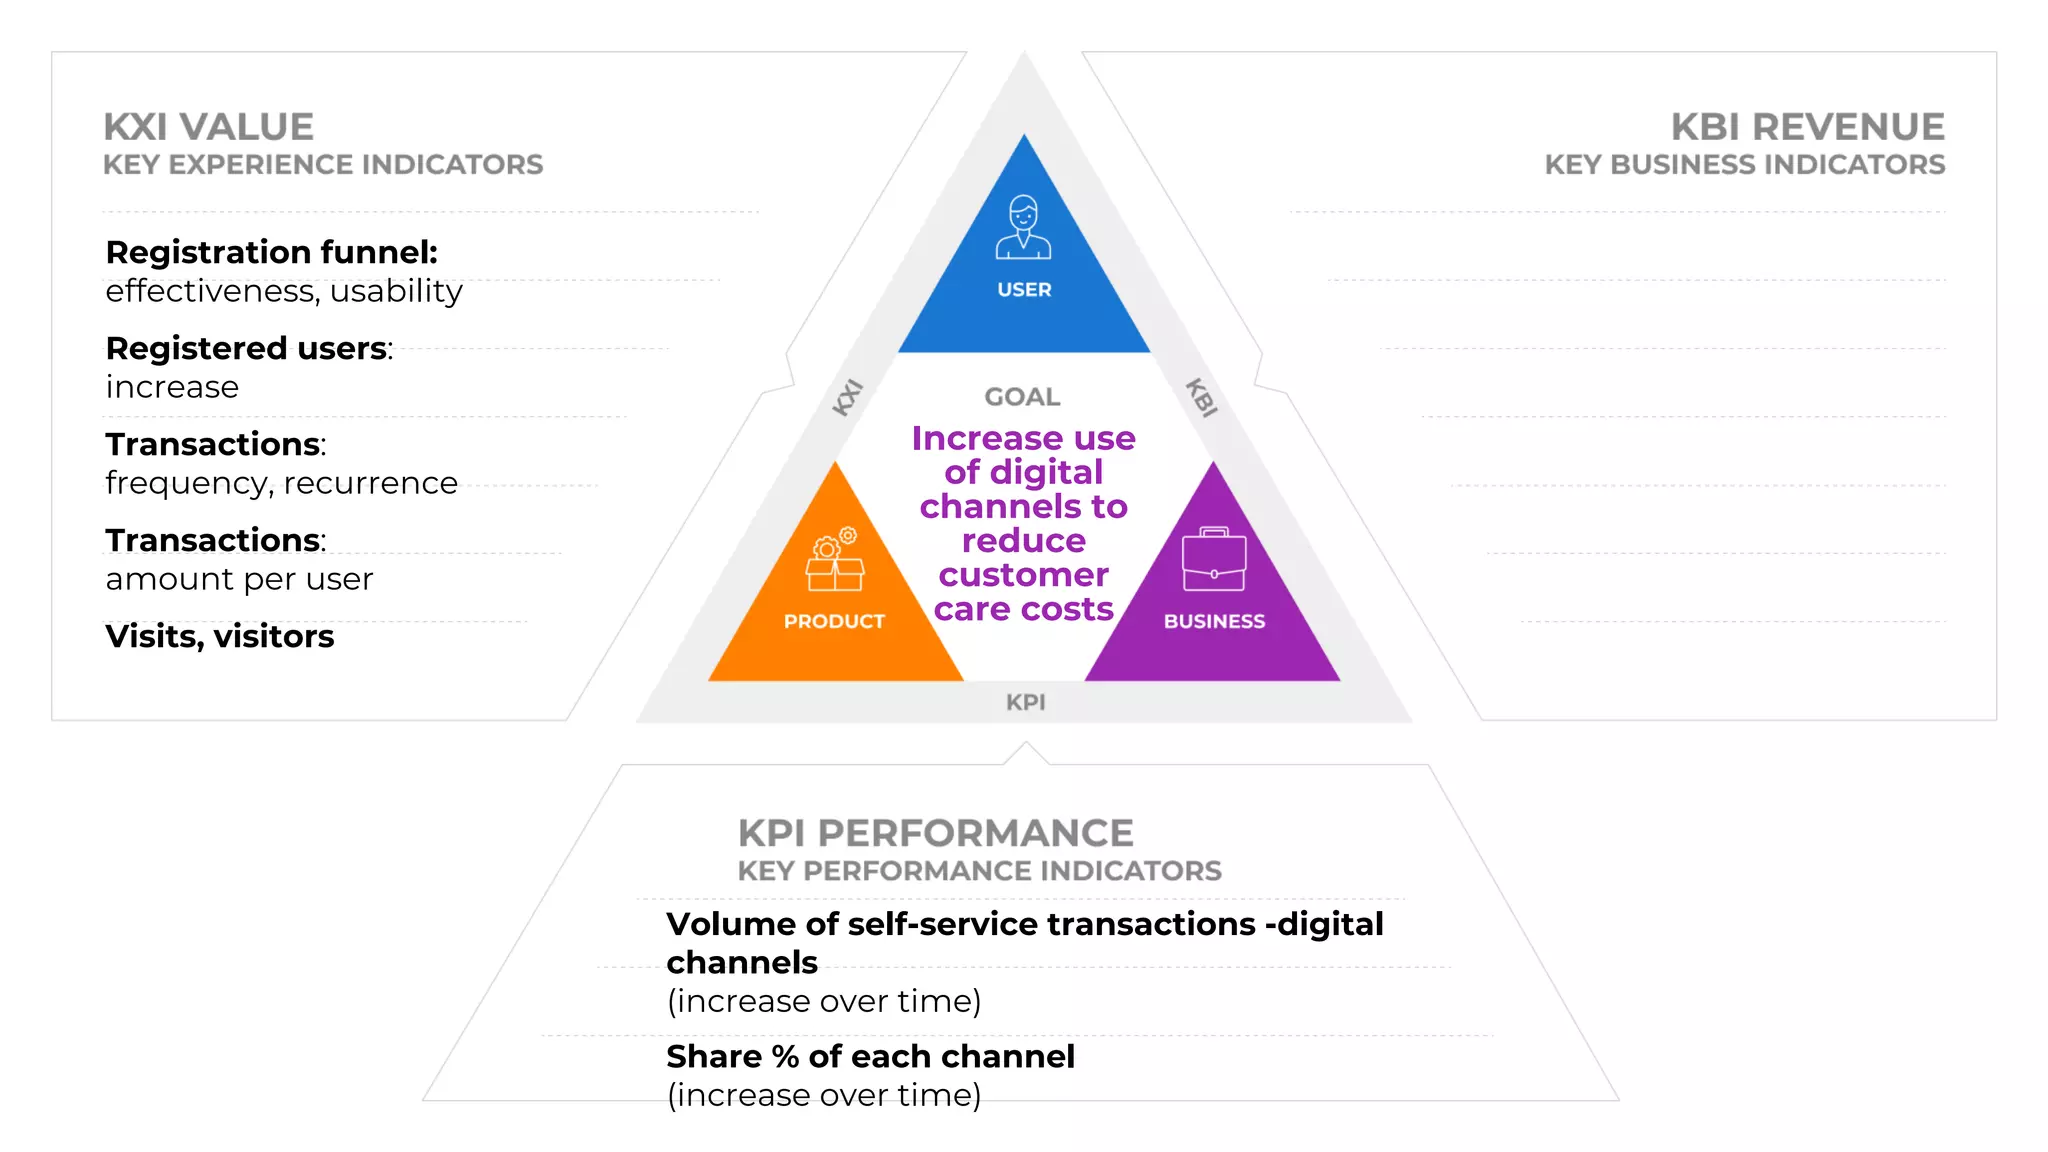
Focus on KXIs, which measure user satisfaction impact on product performance with qualitative and quantitative metrics.
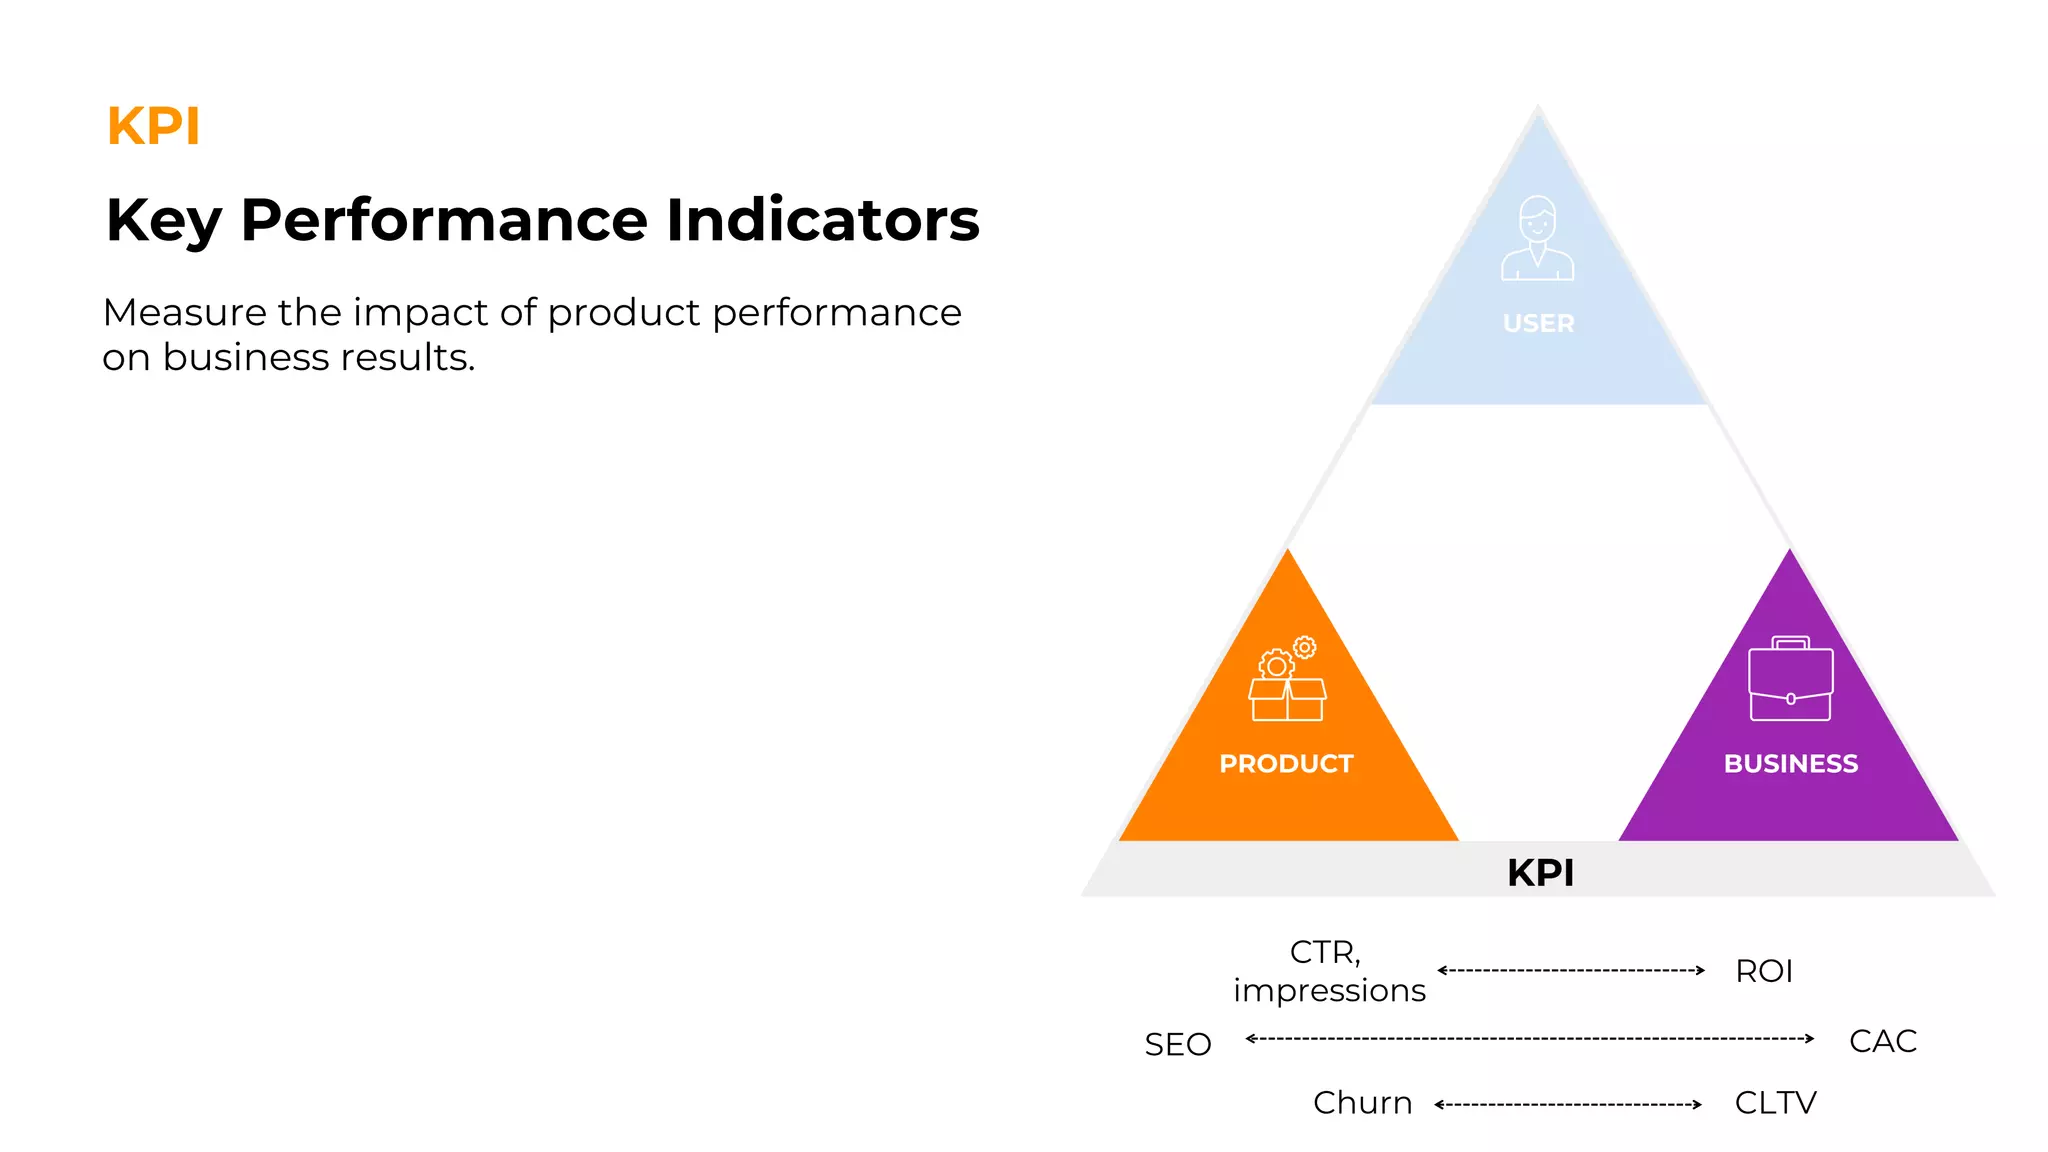
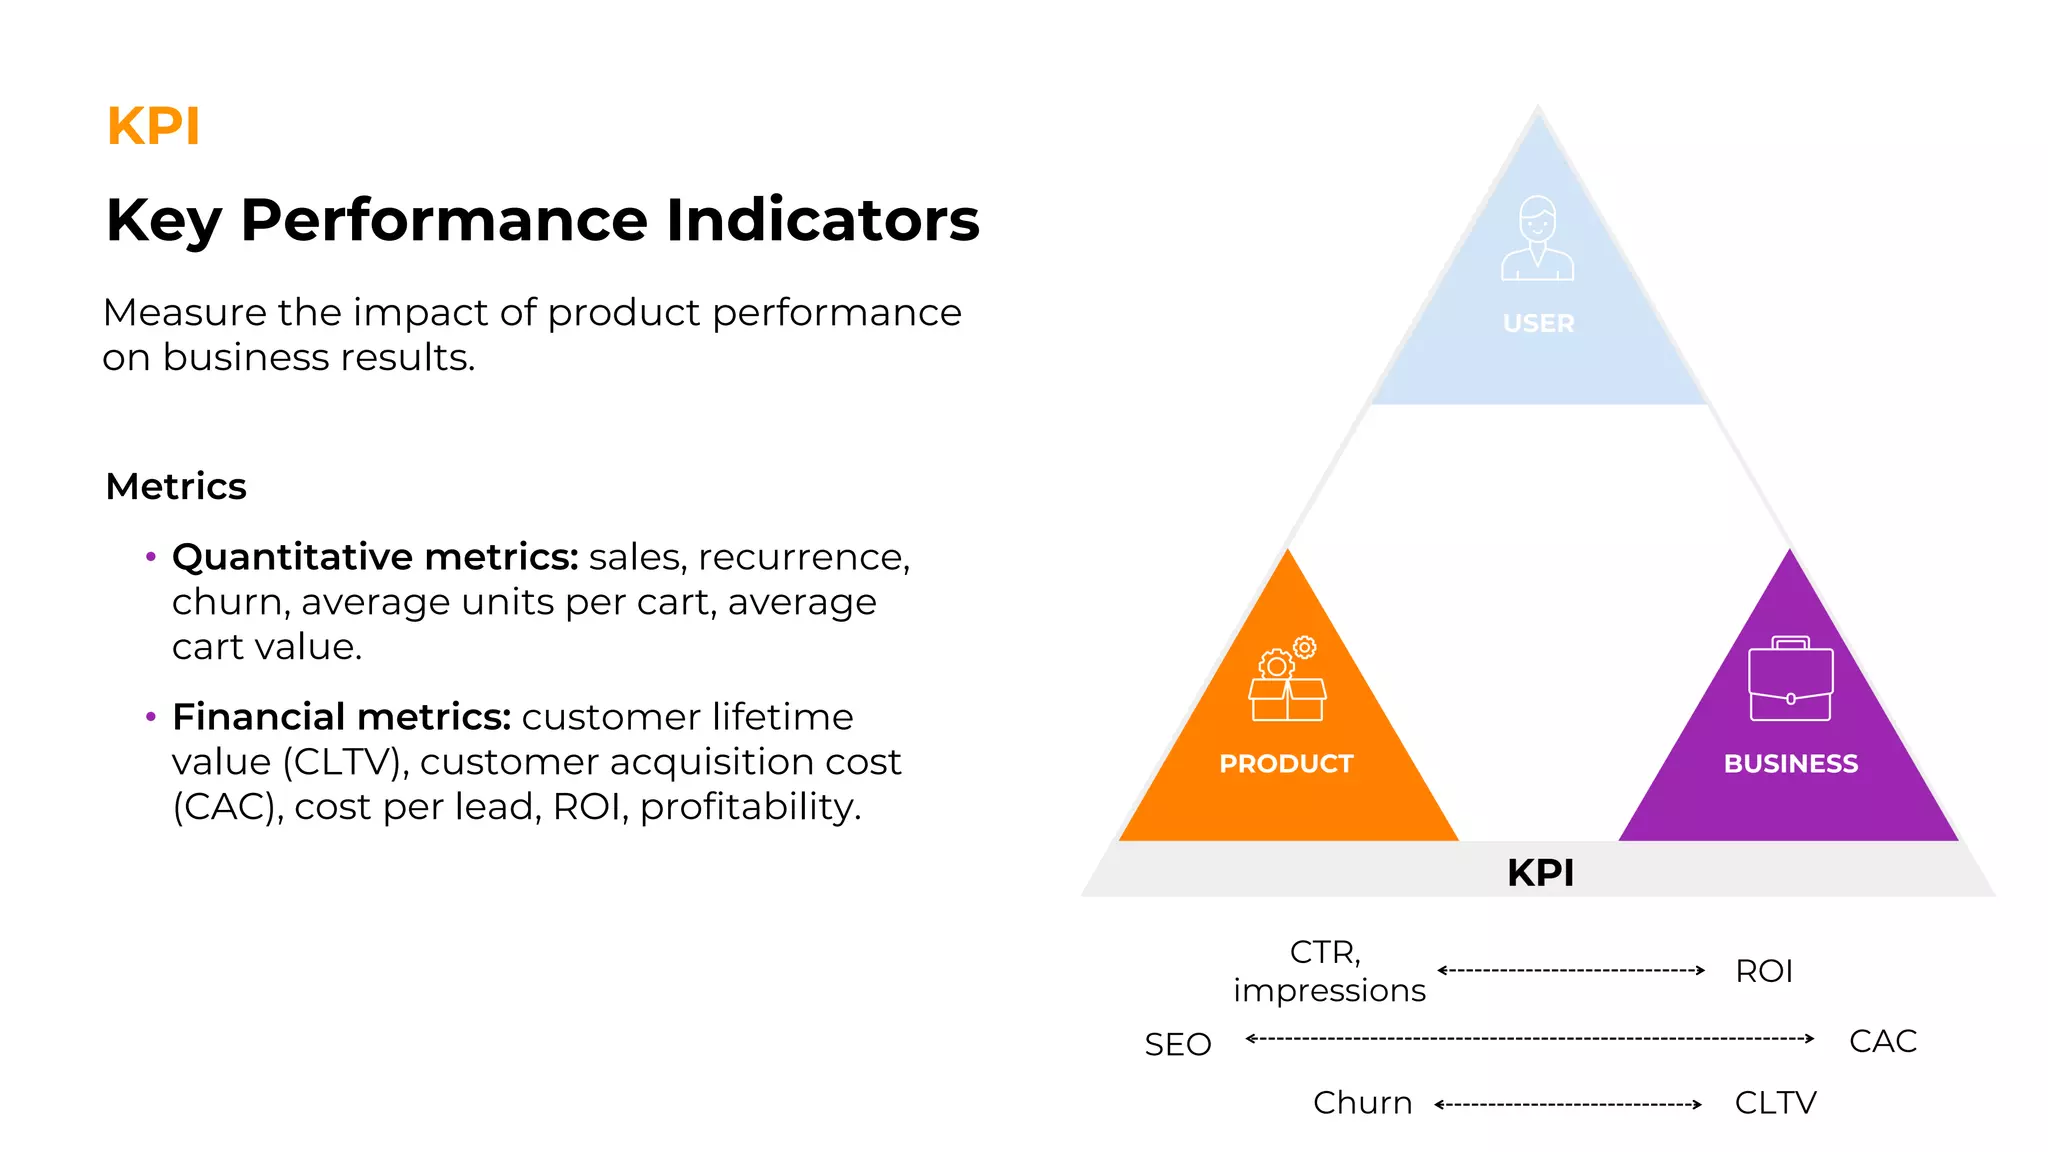
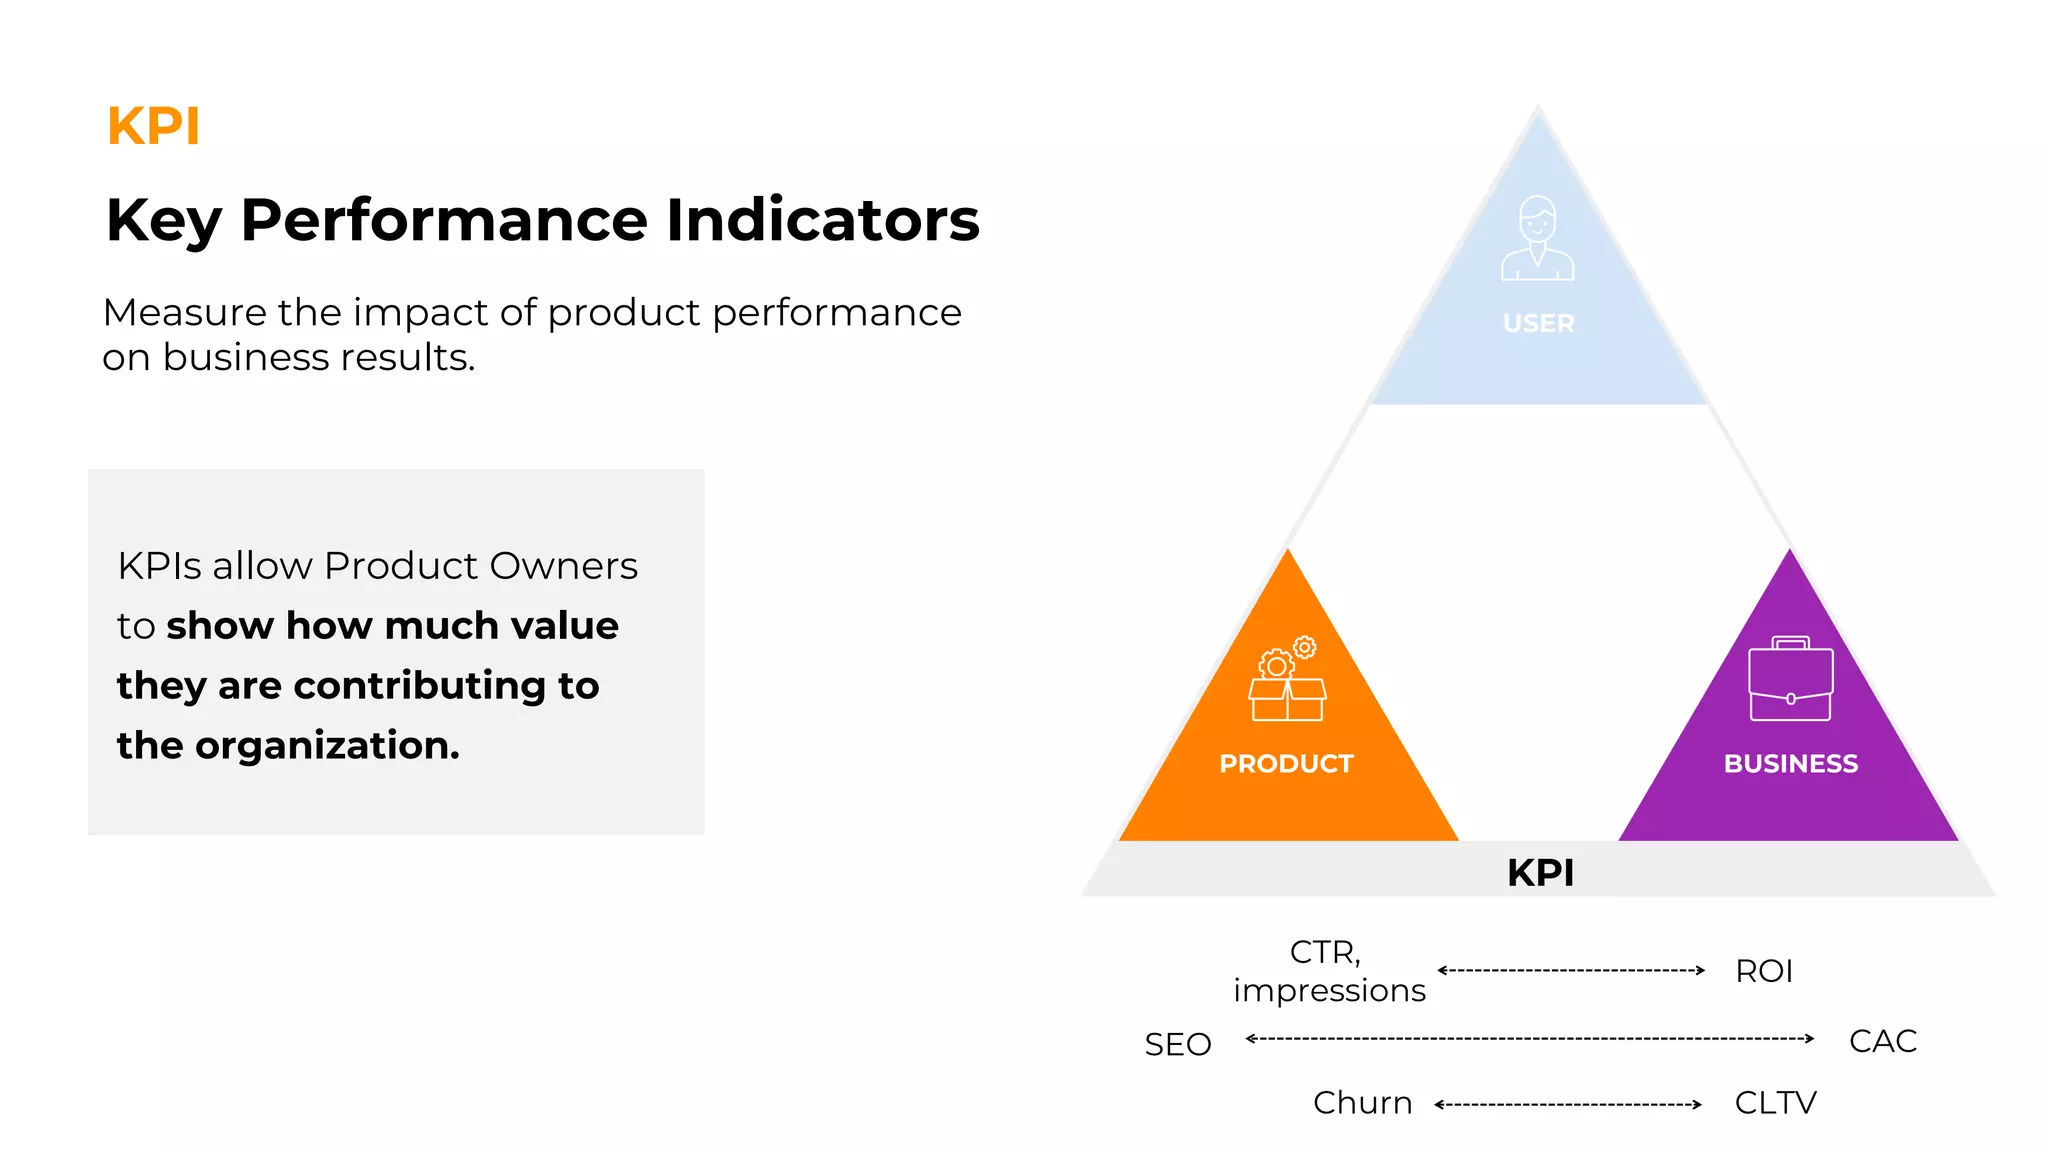
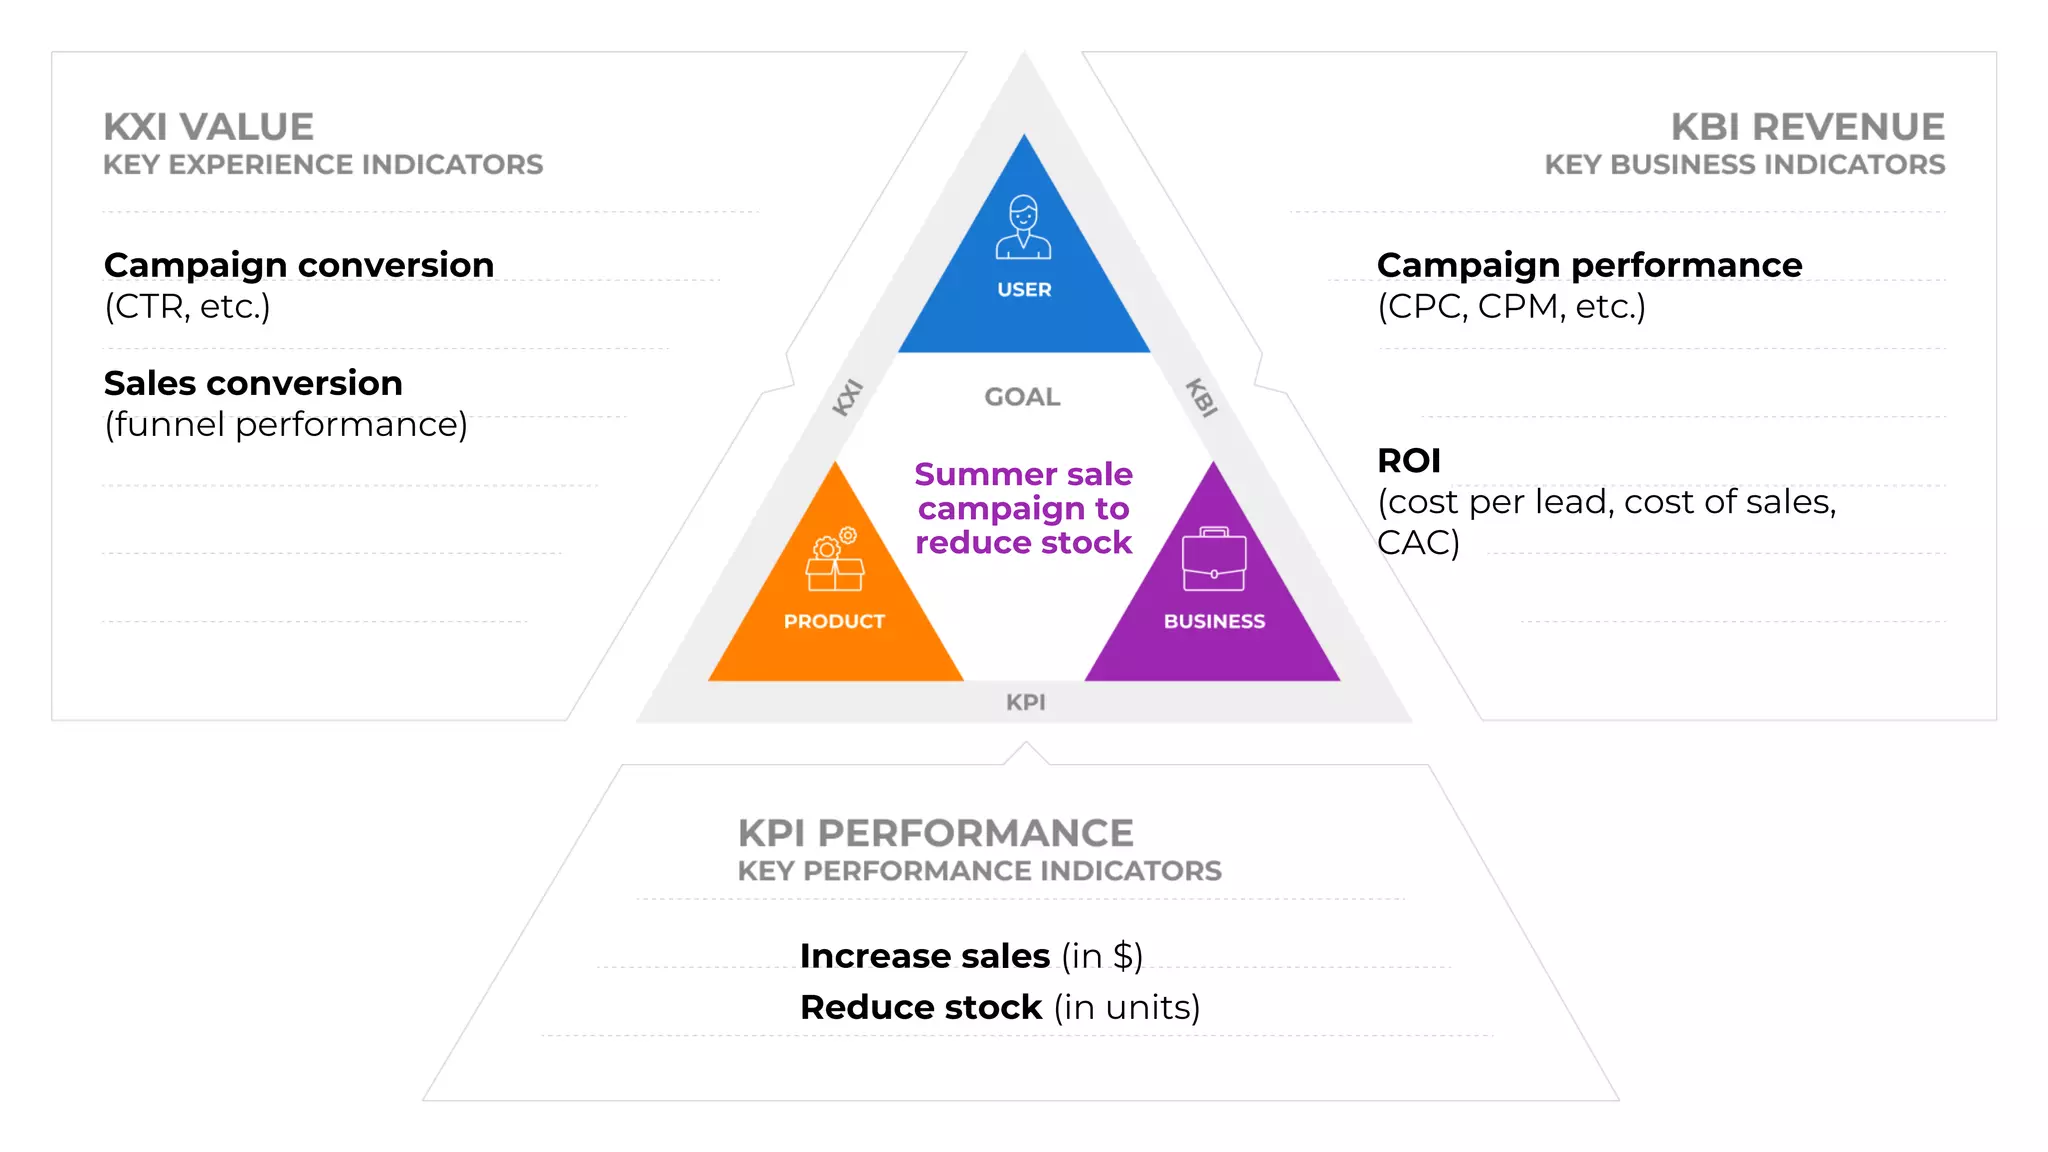
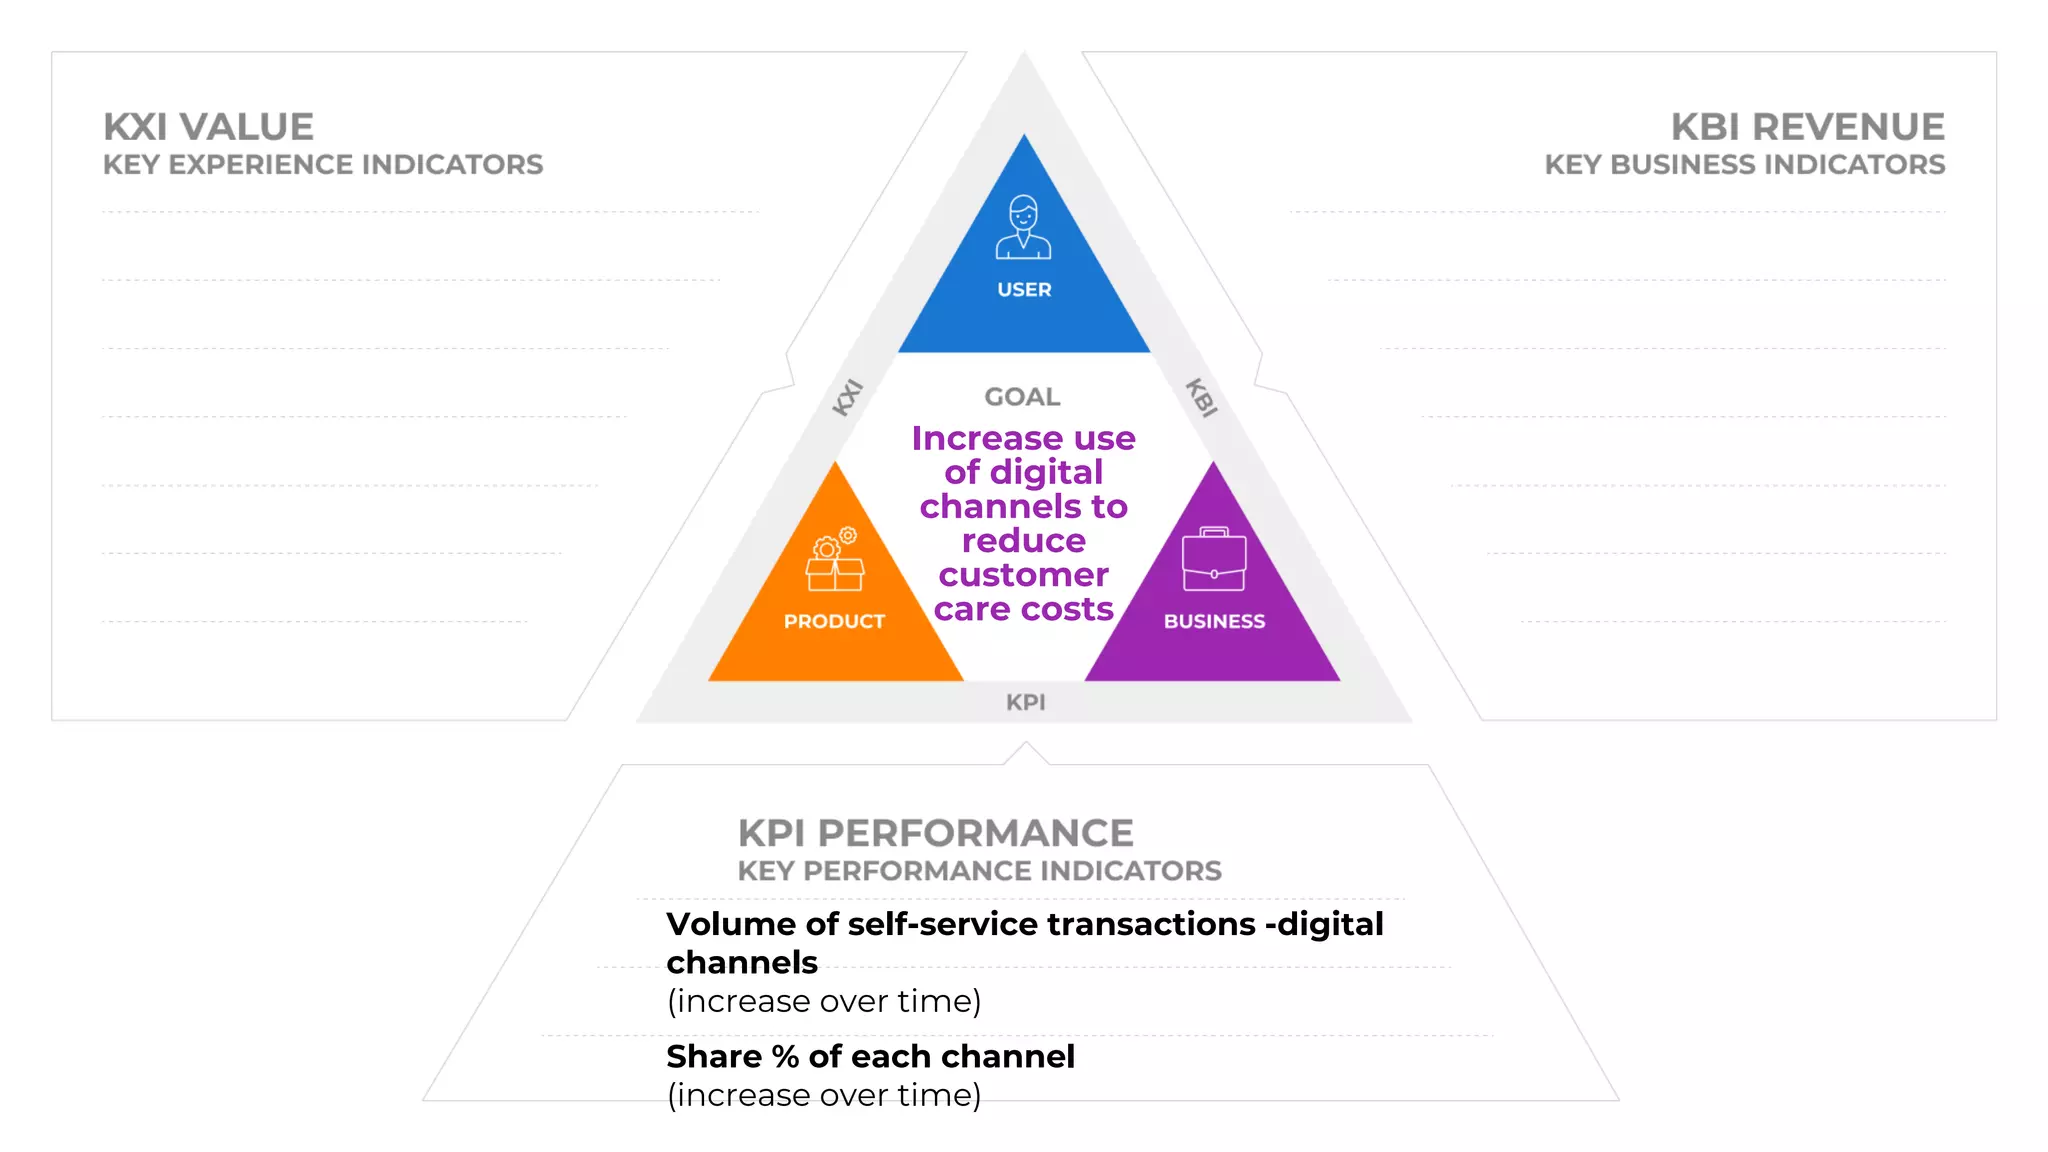
Explanation of KPIs that assess product performance's impact on business results, including metrics like CTR, ROI.
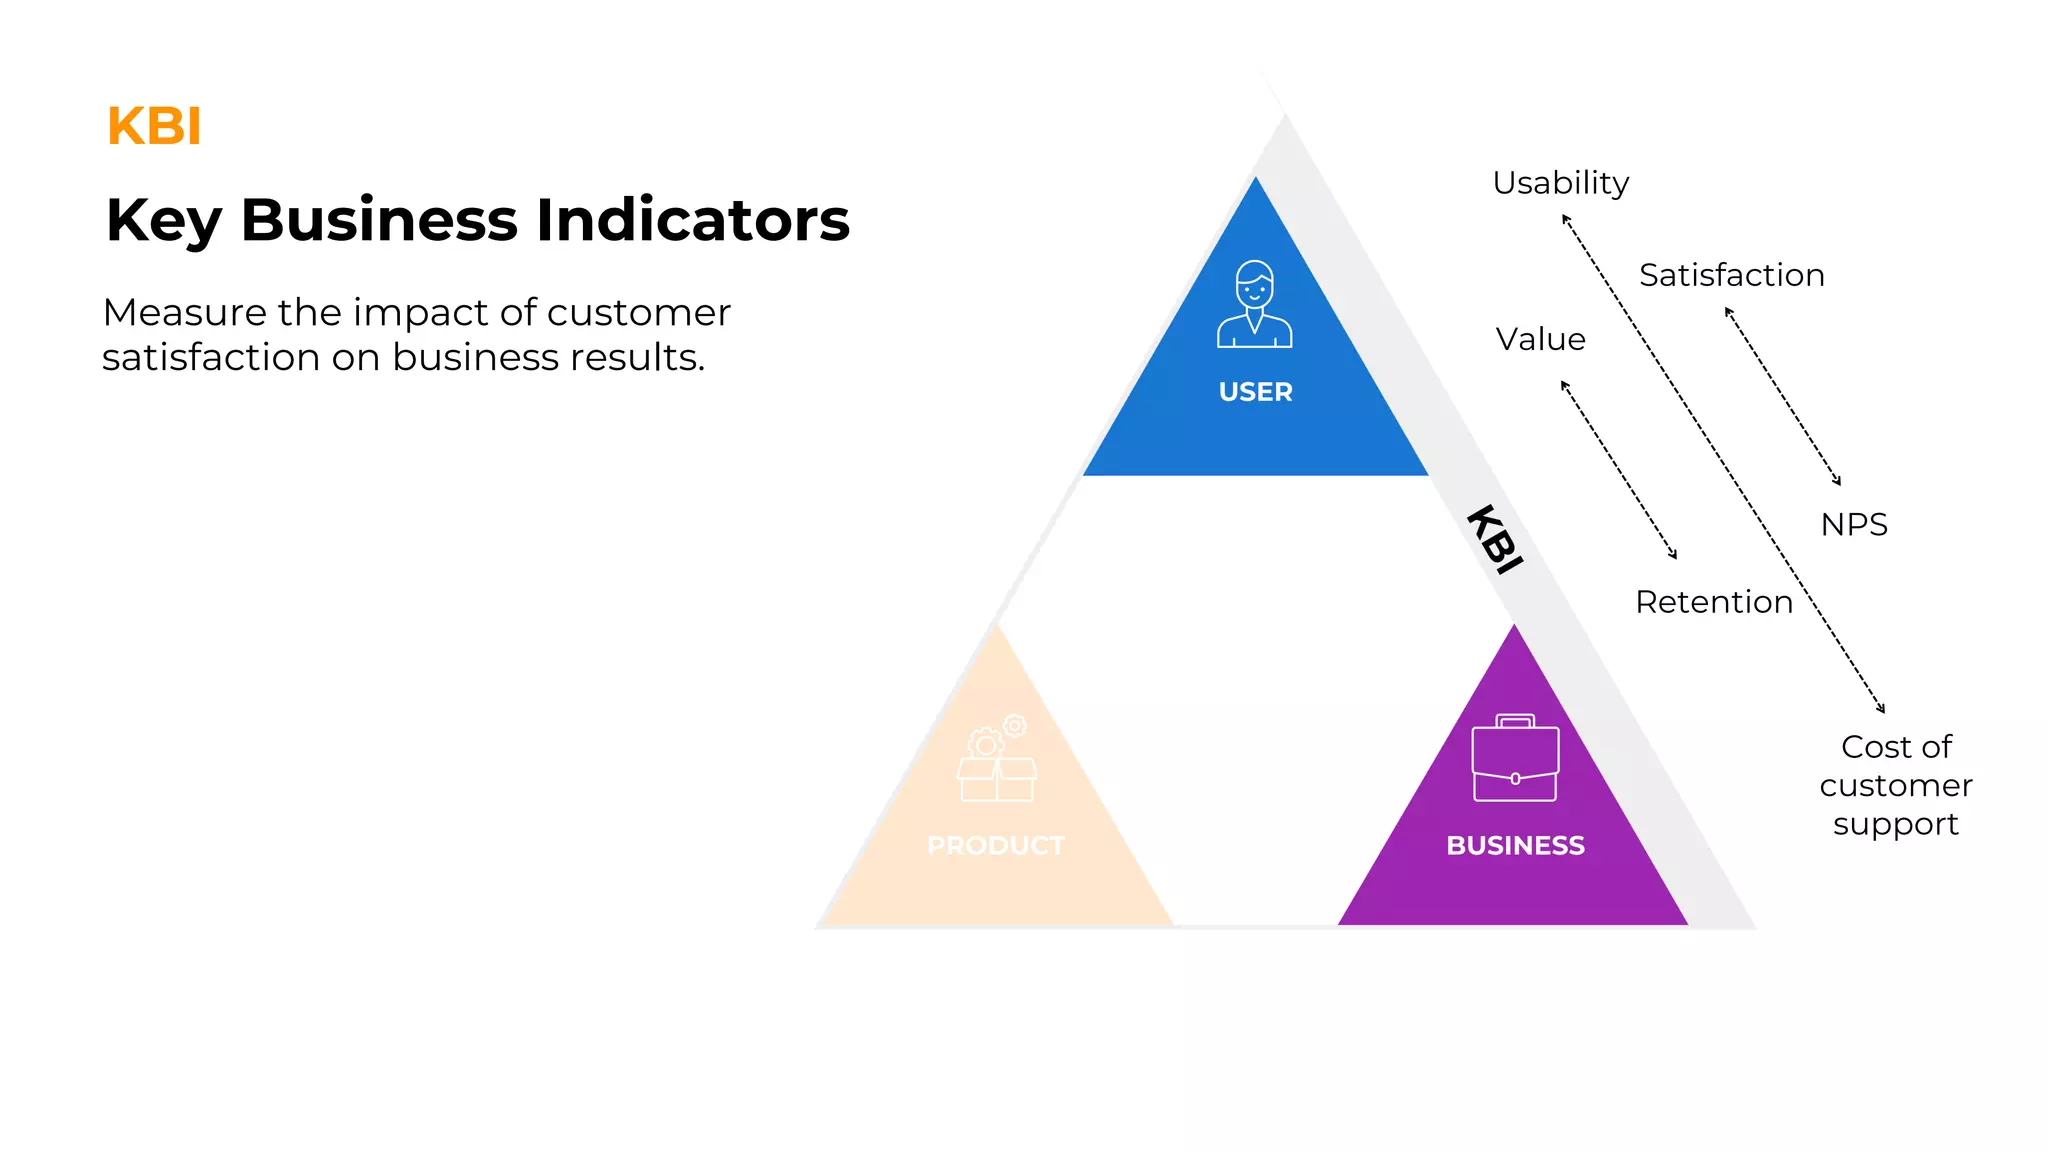
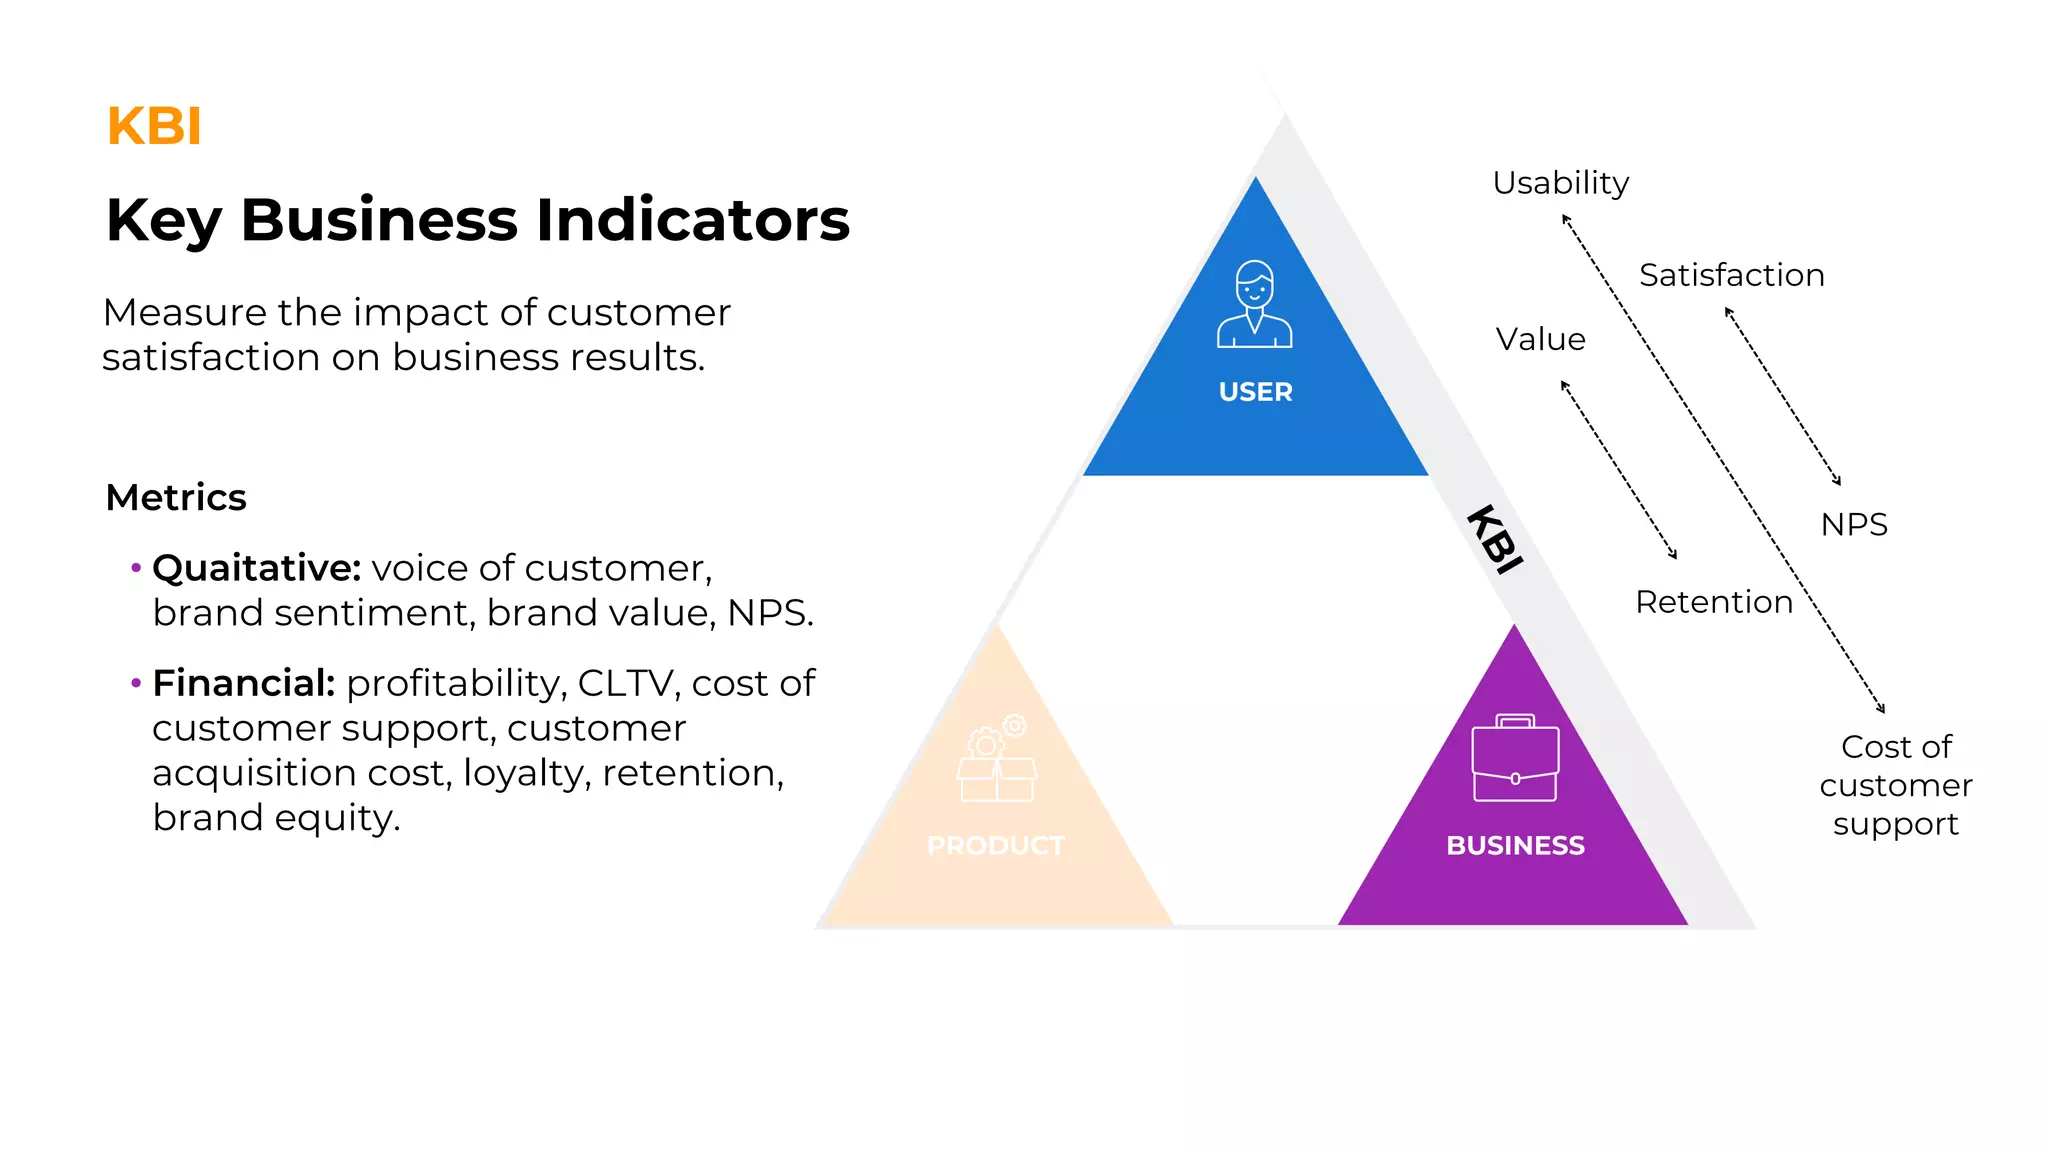
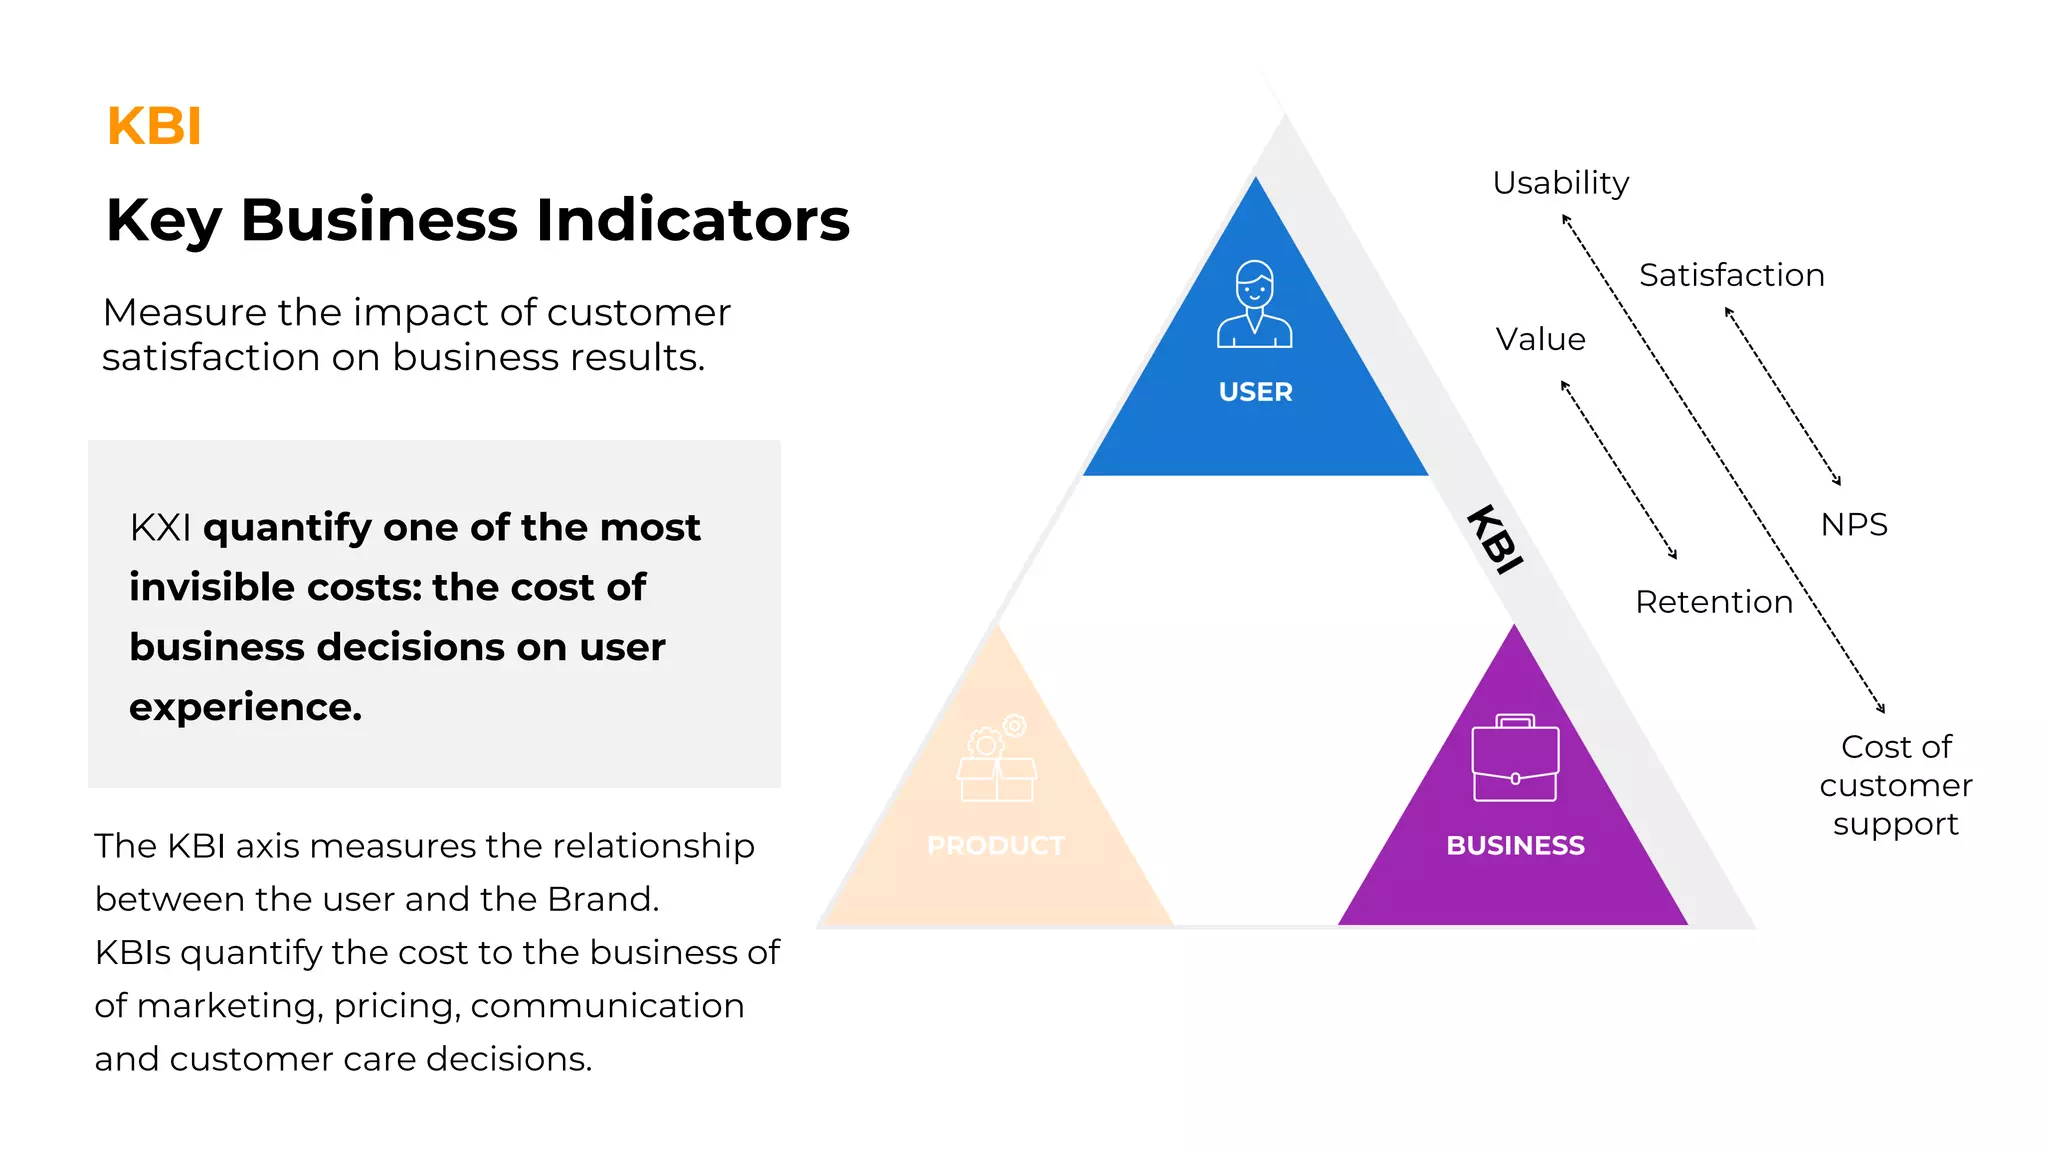
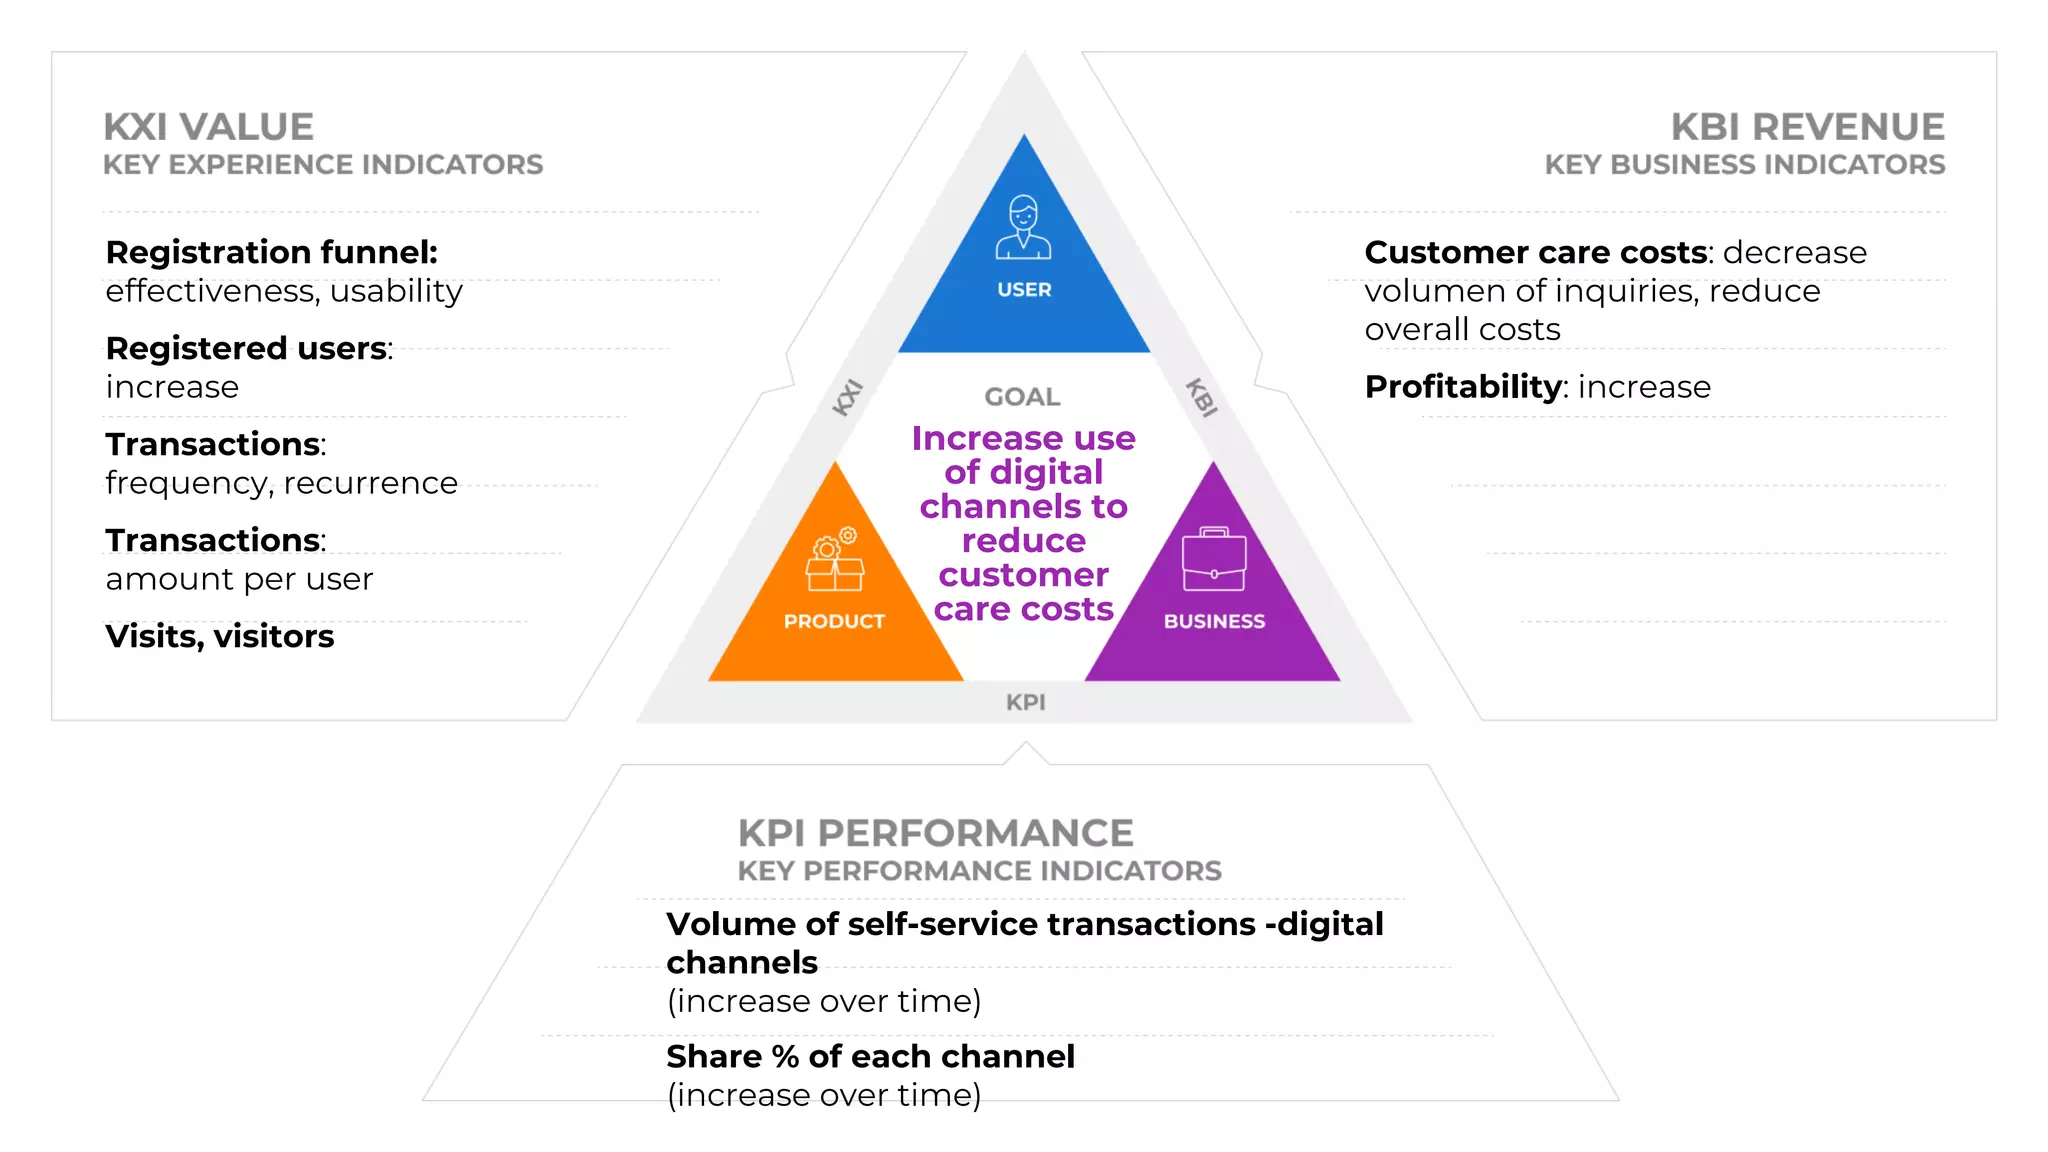
Defining KBIs that link customer satisfaction to business results, emphasizing customer experience's cost implications.
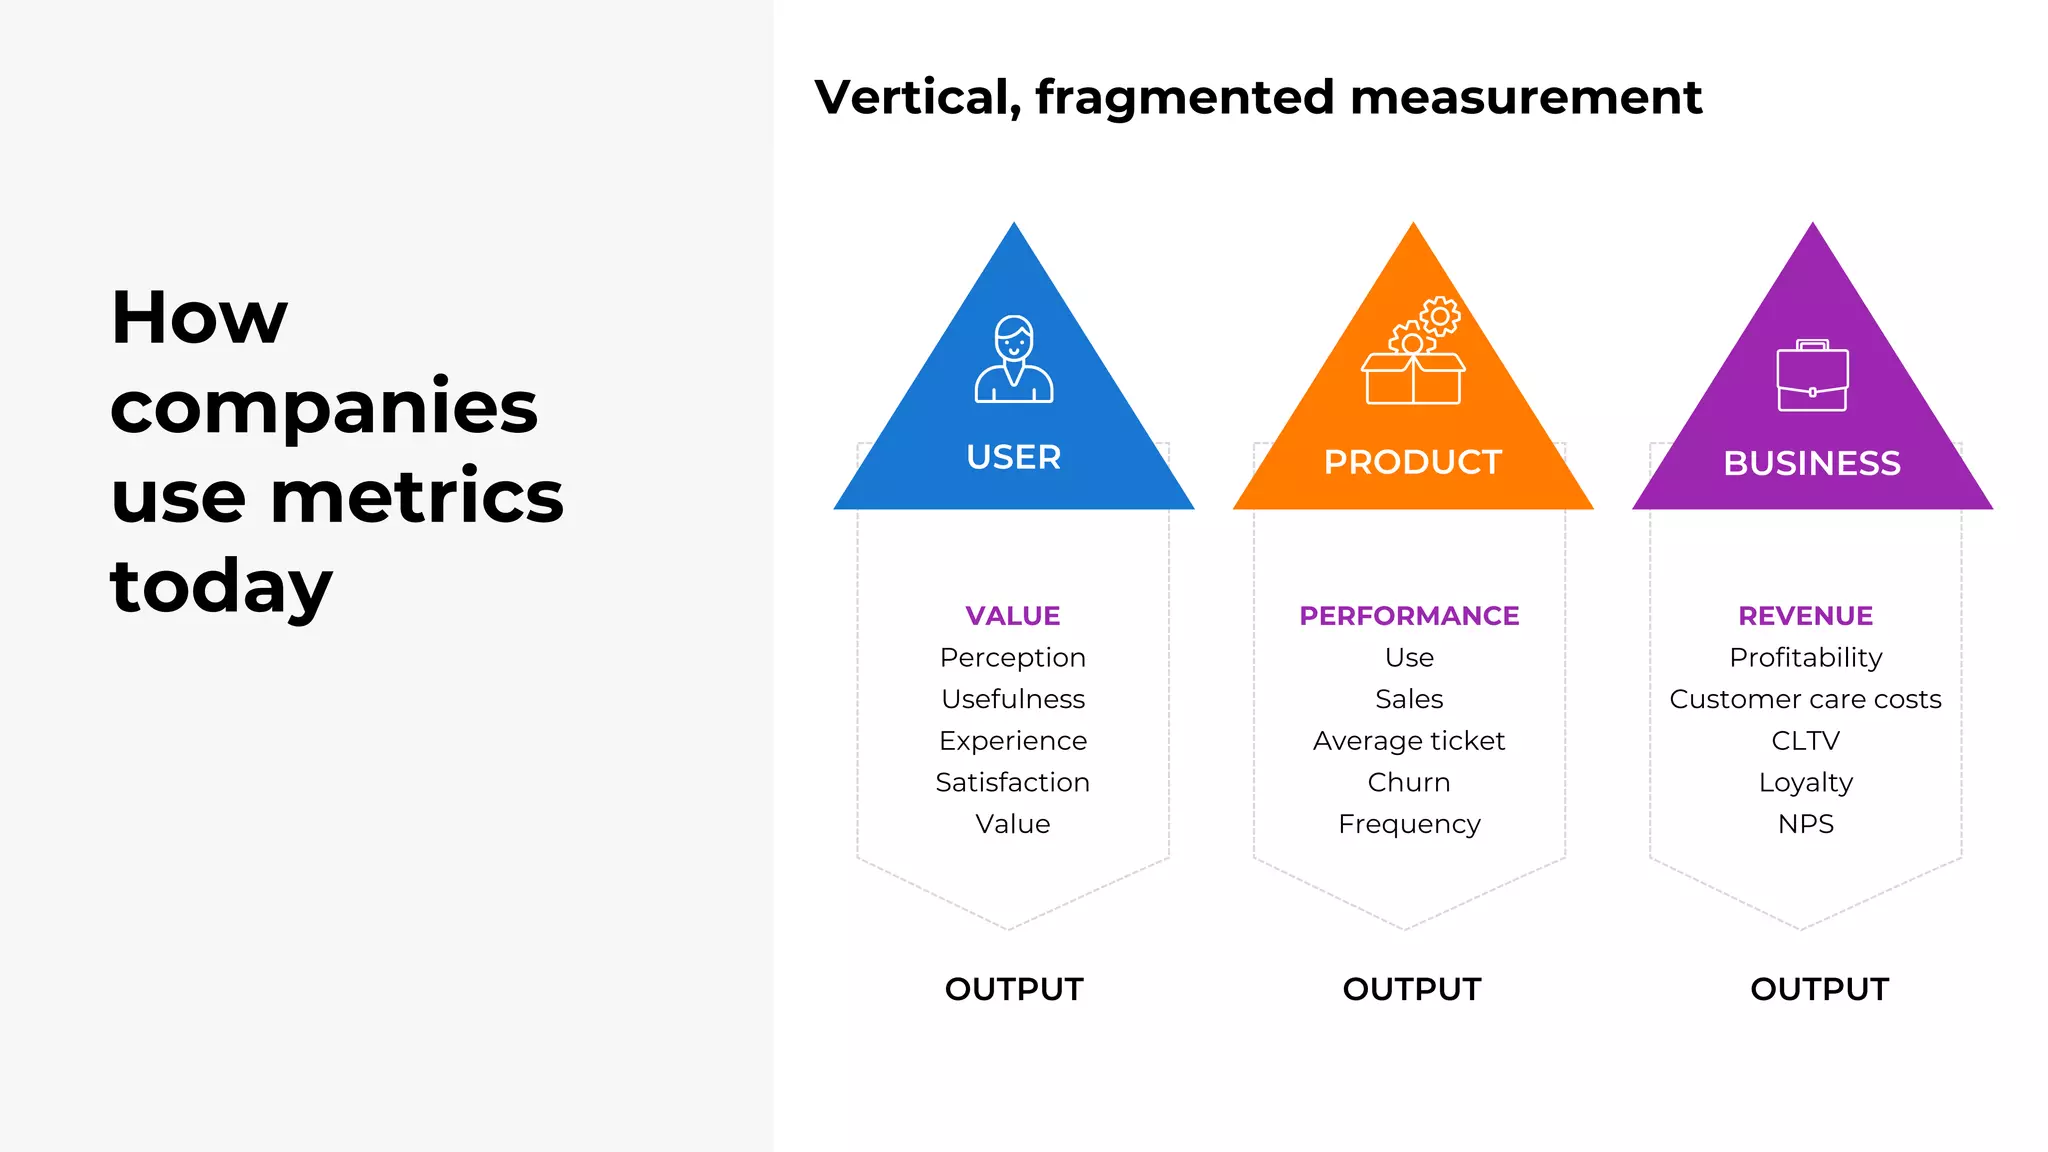
Contrasting vertical, fragmented measurement with holistic measurement practices using the Full Loop Analytics framework.
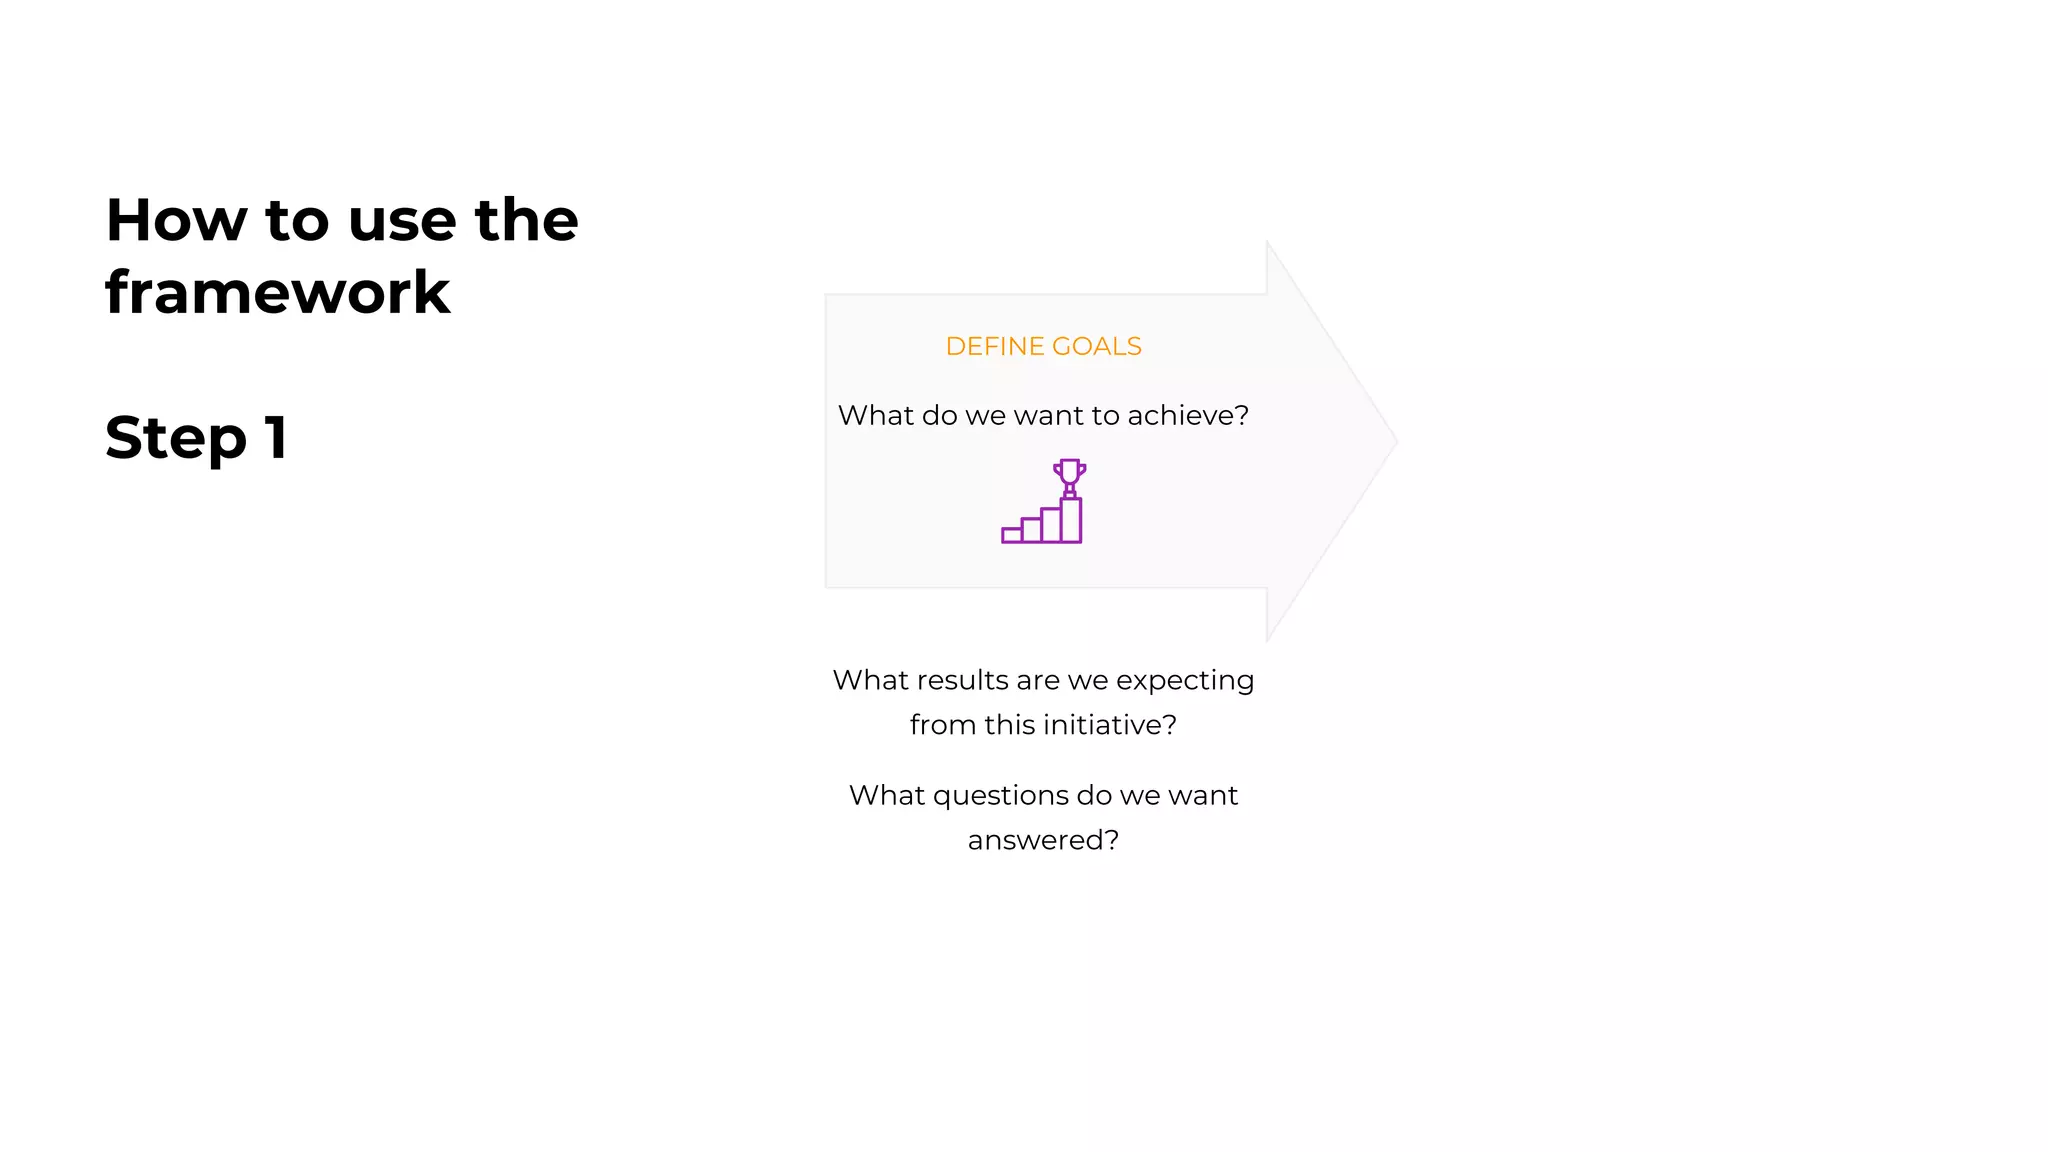
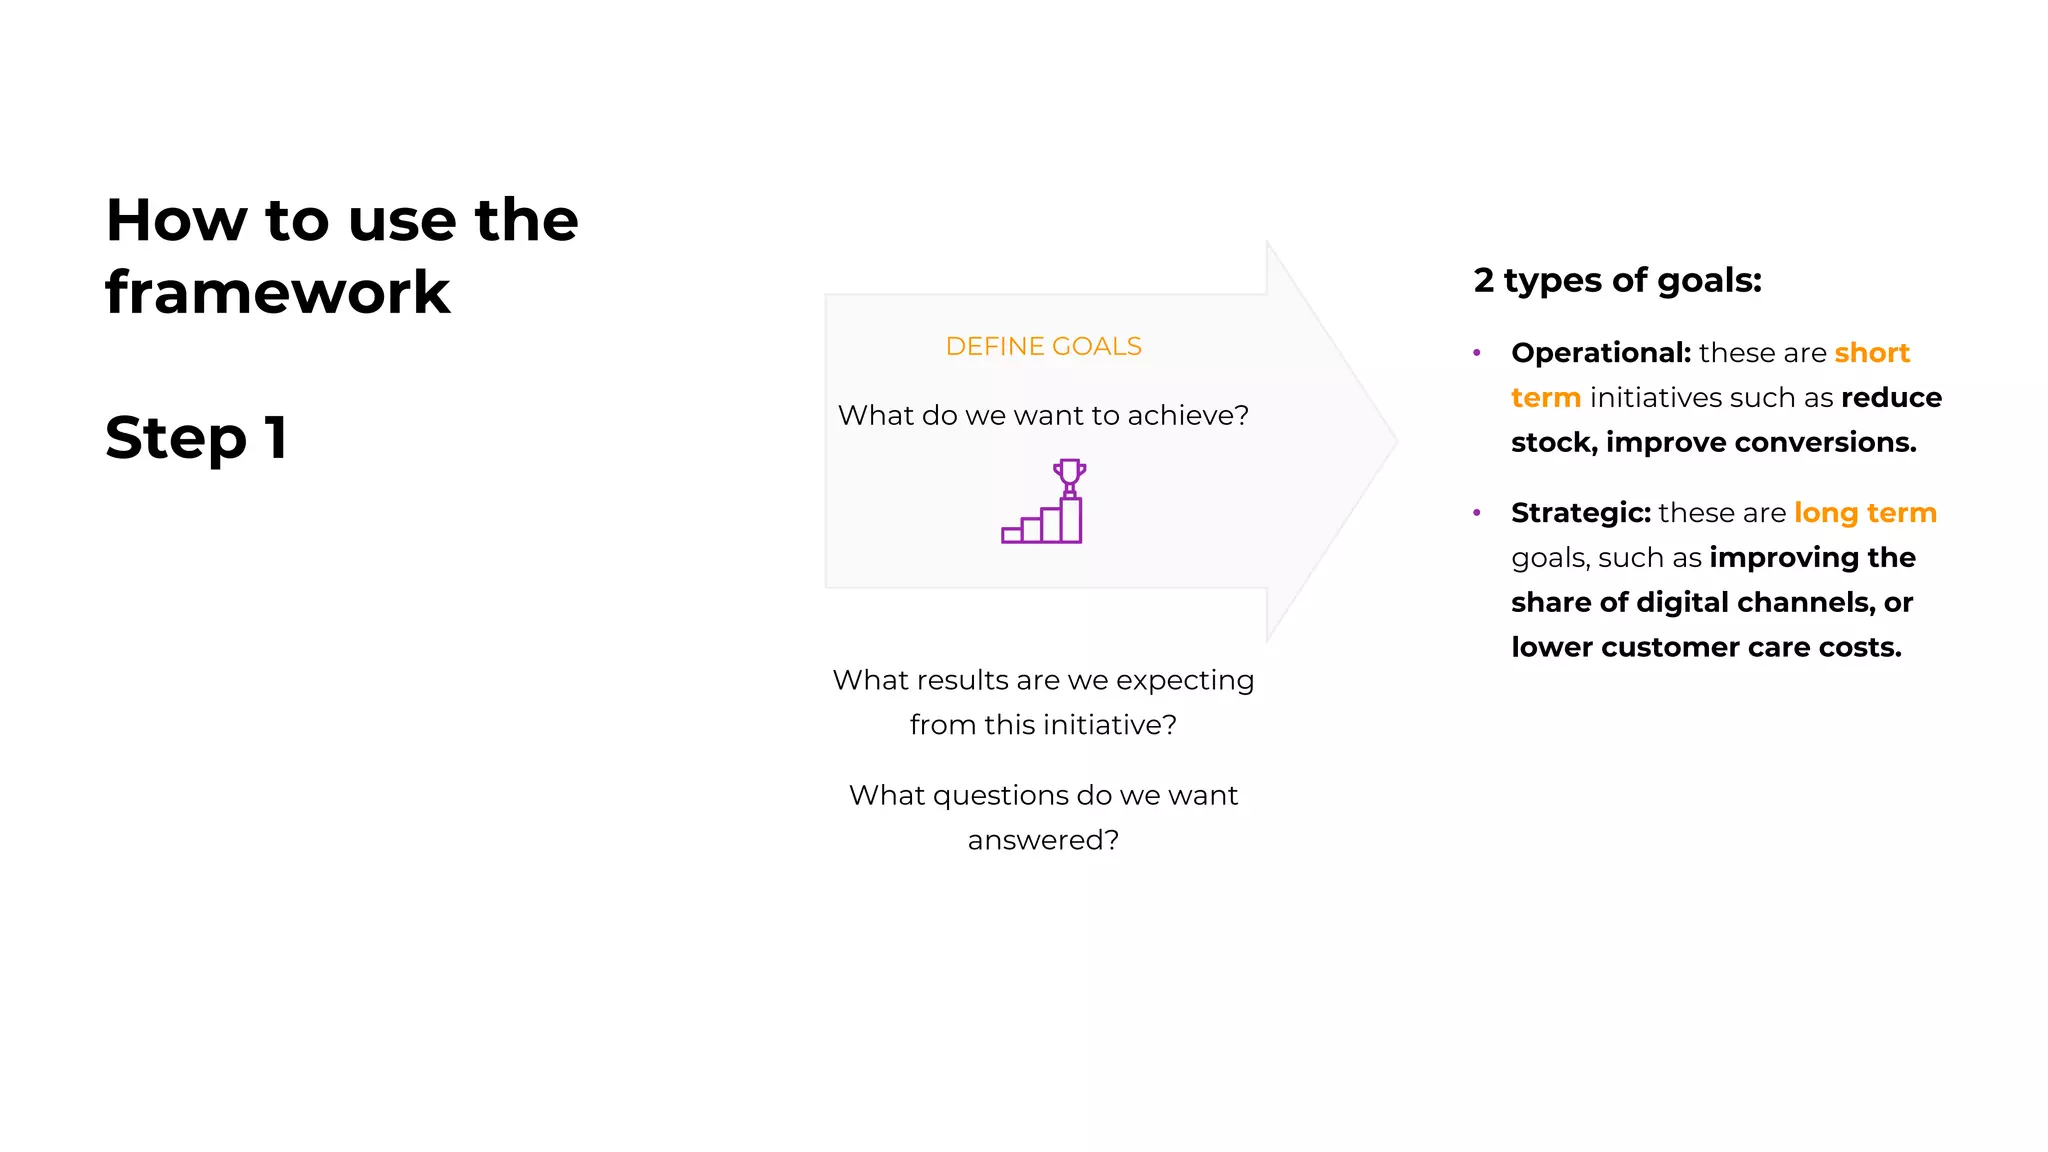
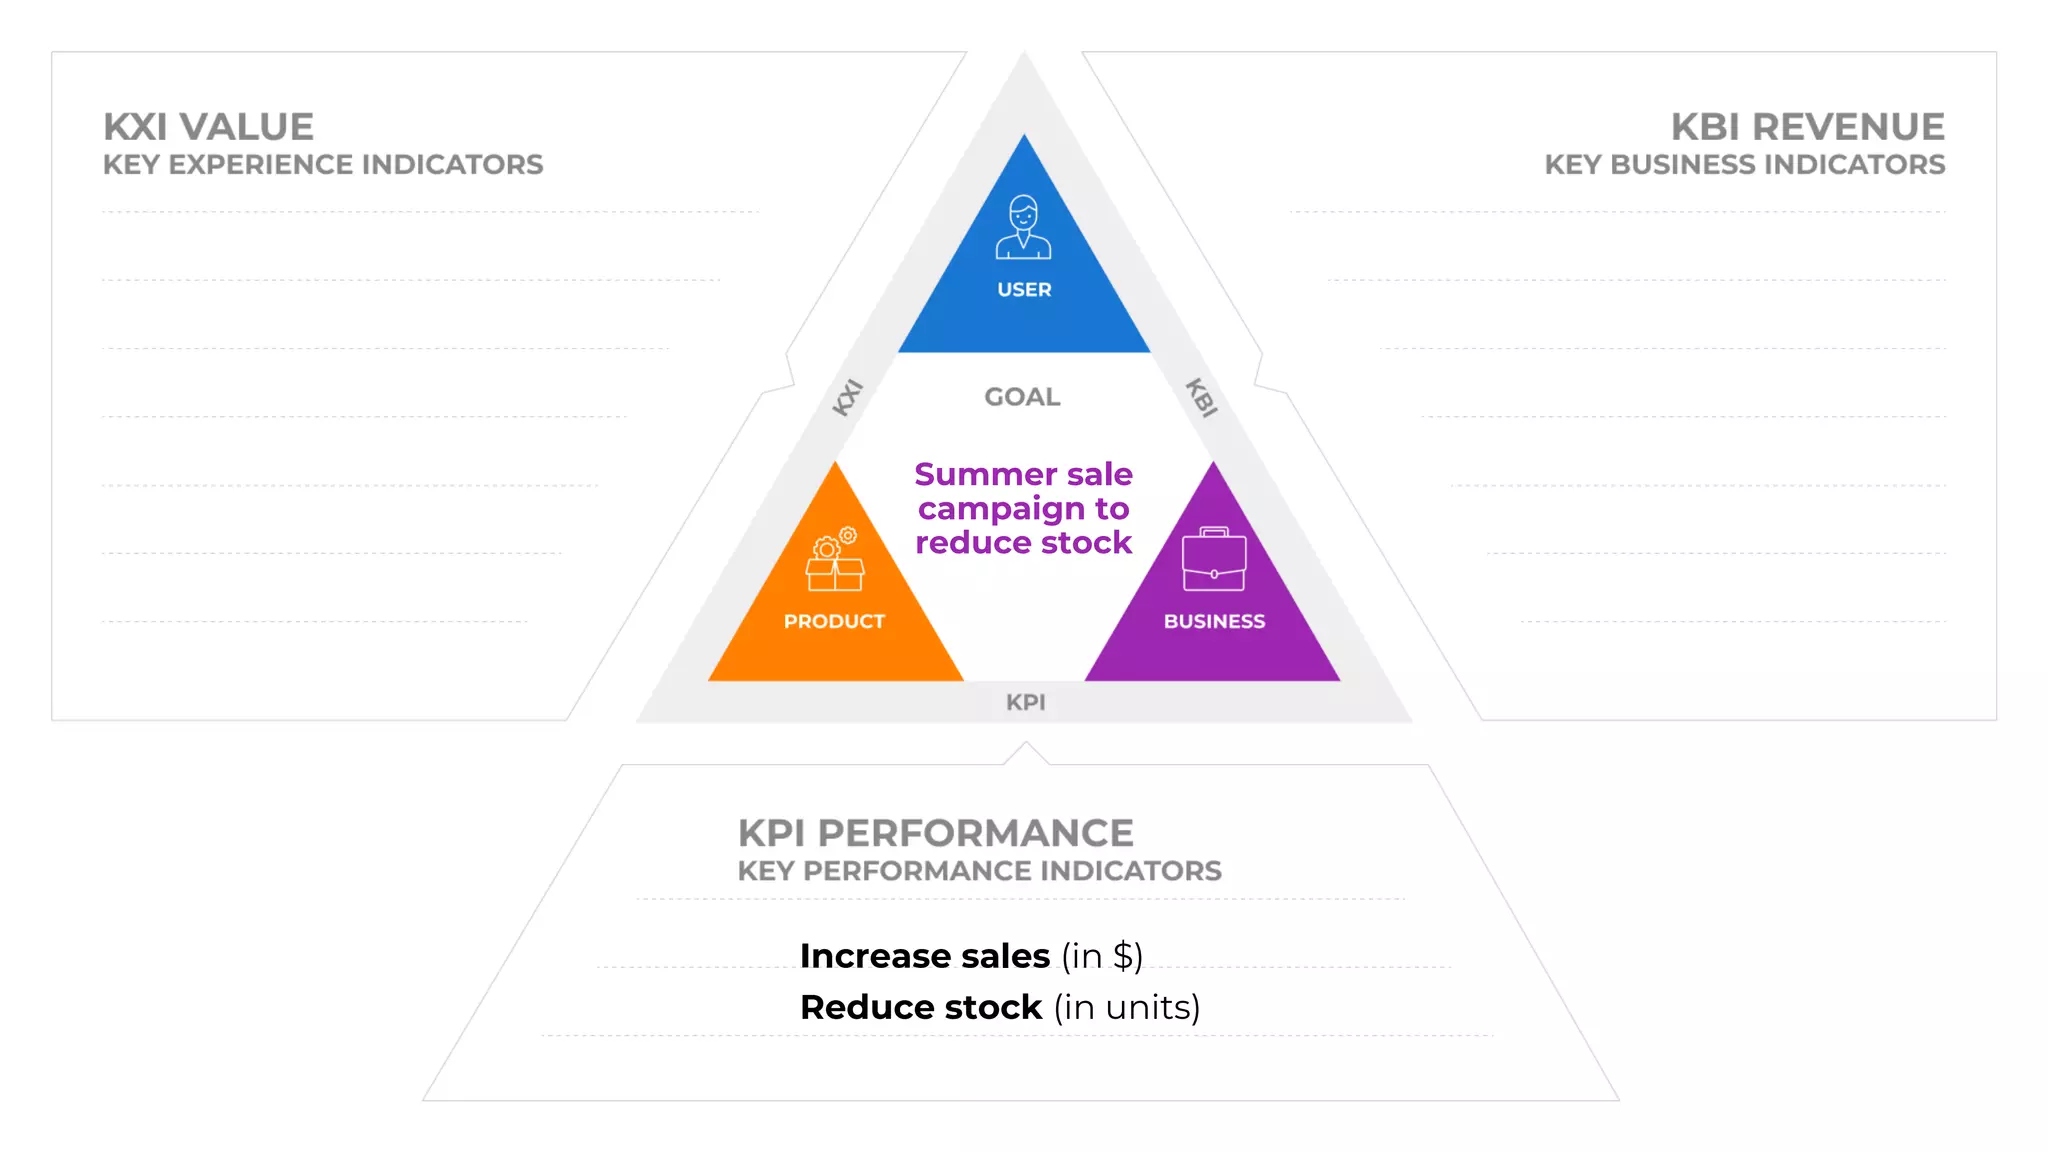
Steps to implement the framework, starting with defining goals and metrics, distinguishing between operational and strategic goals.
Examples of campaigns illustrating how to measure objectives, conversions, and customer care cost reduction using digital channels.
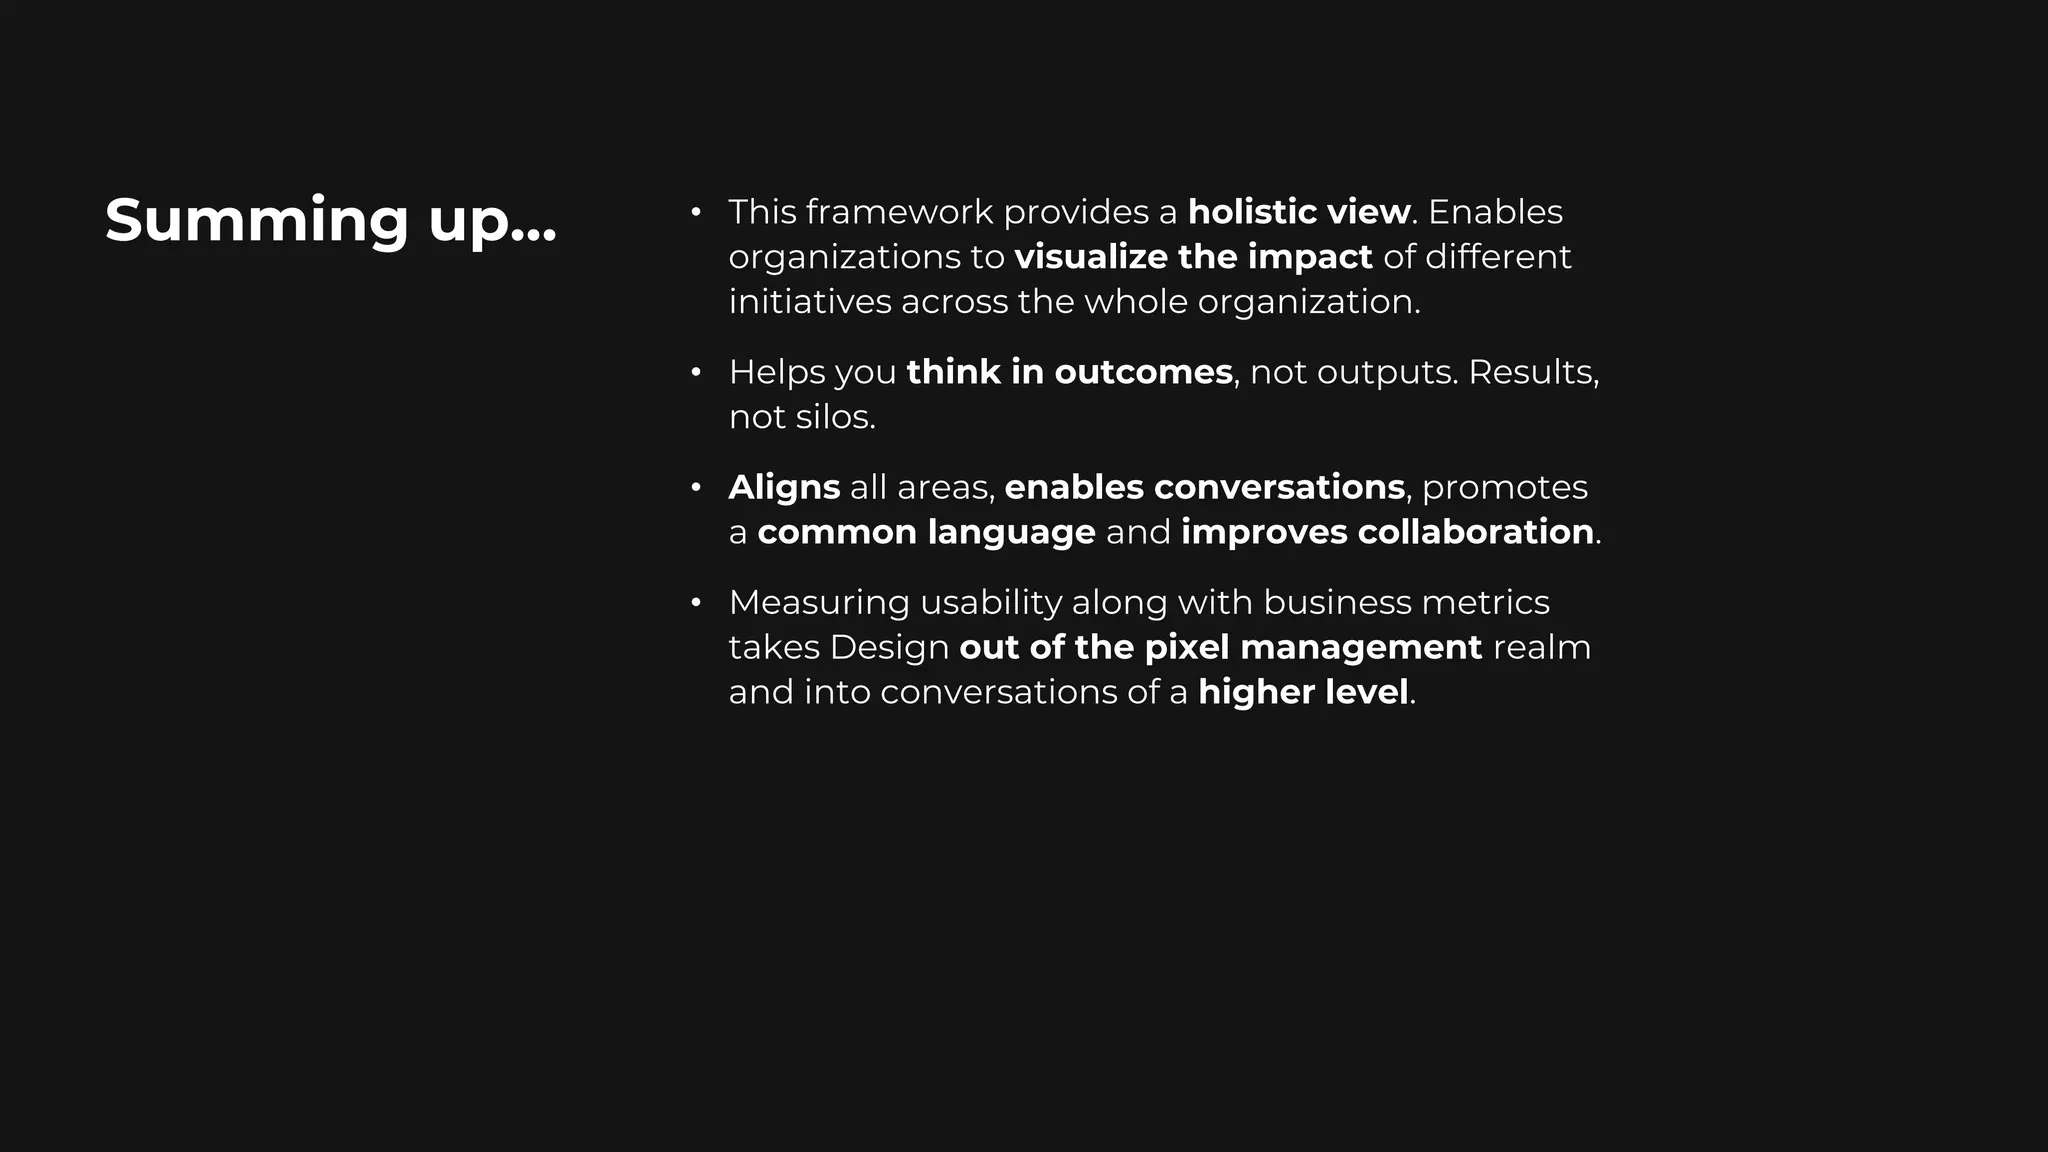
Summary of the framework's benefits for collaborative, outcome-driven business practices, enhancing design conversations.
Offer for downloading the framework template and providing contact information for further engagement.


![[DSC Europe 25] Petar Zivanov - AI meets documents From chatbots to AI-powere...](https://cdn.slidesharecdn.com/ss_thumbnails/xer2bb6nrdc8pdpev0pc-8-251204082258-7c2fa4a1-thumbnail.jpg?width=640&height=640&fit=bounds)
![[DSC Europe 25] Boris Perkovic - Lost in performance.pptx](https://cdn.slidesharecdn.com/ss_thumbnails/uq5hrp7vsuahqkxzifux-1-251204082258-fd2ee09d-thumbnail.jpg?width=640&height=640&fit=bounds)

![[DSC Europe 25] Dragan Vucic - Building the Learning Organization - How AI Tr...](https://cdn.slidesharecdn.com/ss_thumbnails/8brigo2sbu6qur6gxrra-7-251205085715-6ae07d24-thumbnail.jpg?width=640&height=640&fit=bounds)


![[DSC Europe 25] Andy Cotgreave - Nothing is new in analytics.pptx](https://cdn.slidesharecdn.com/ss_thumbnails/mba4vzcurvoh5lfrd5zw-6-251205194645-341bbbbe-thumbnail.jpg?width=640&height=640&fit=bounds)


![[DSC Europe 25] Max Talanov - Non digital NNs.pptx](https://cdn.slidesharecdn.com/ss_thumbnails/wif8tr3gtua74qvtopke-non-digital-nns-251205090438-26b0eea6-thumbnail.jpg?width=640&height=640&fit=bounds)