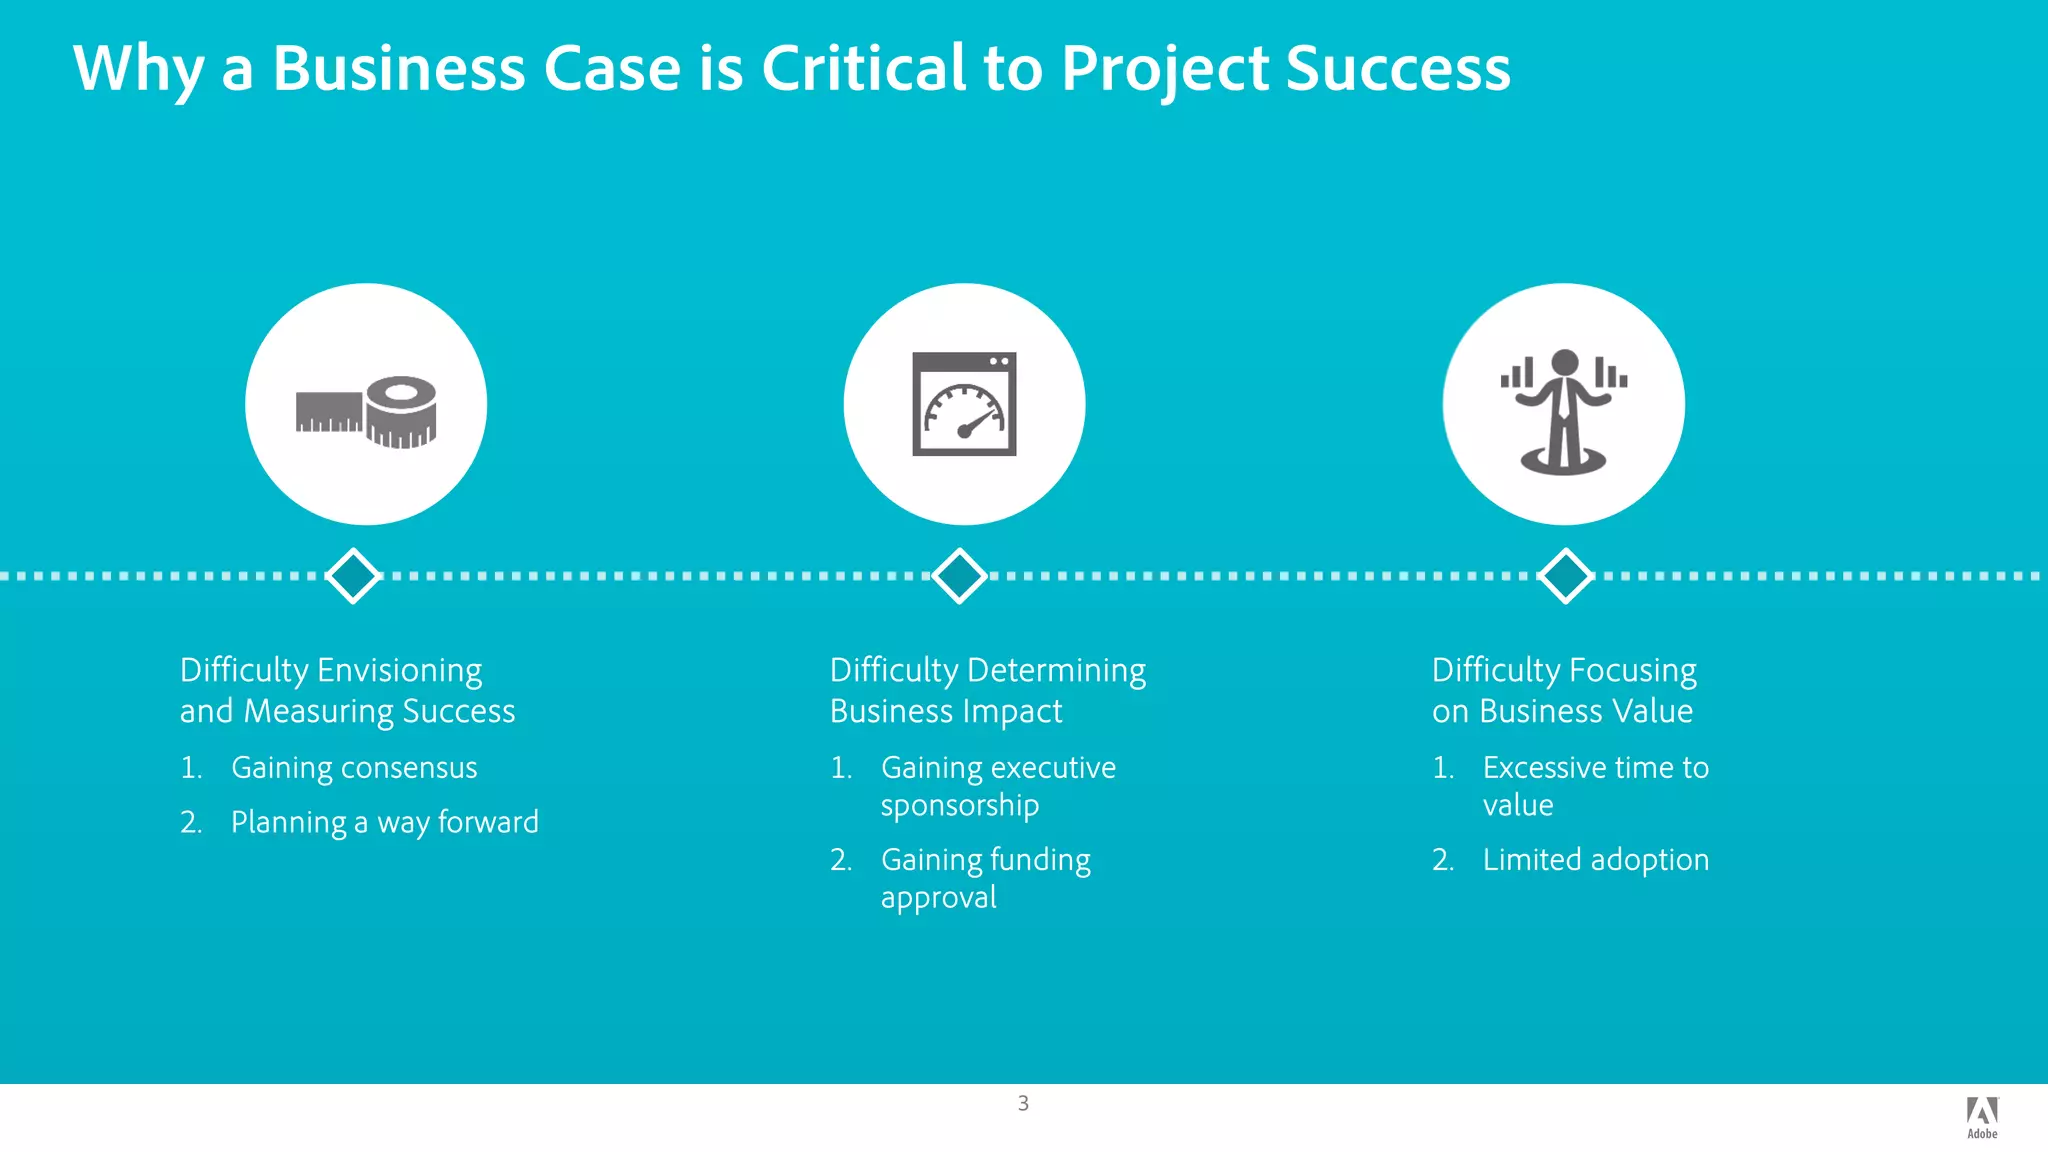
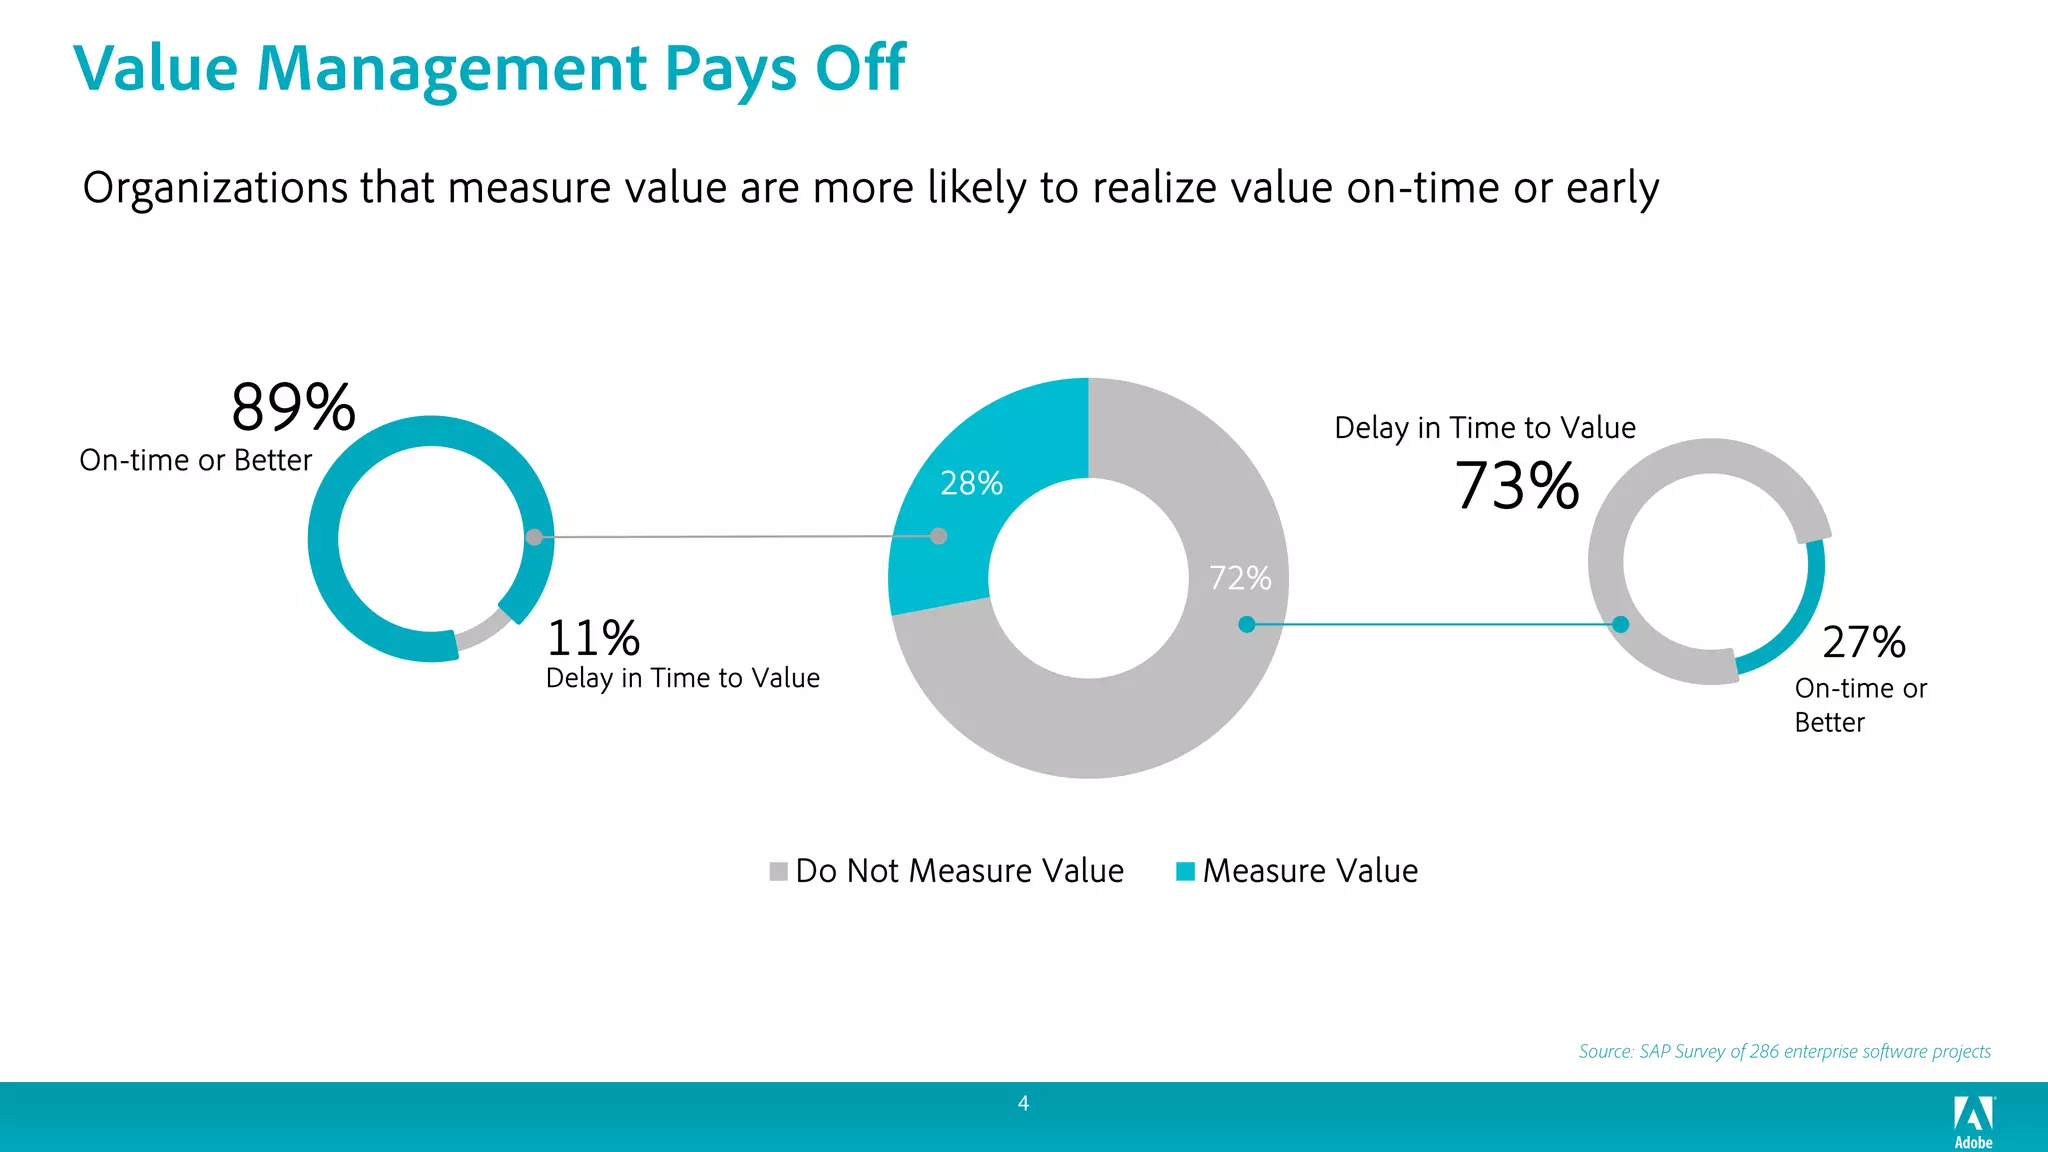
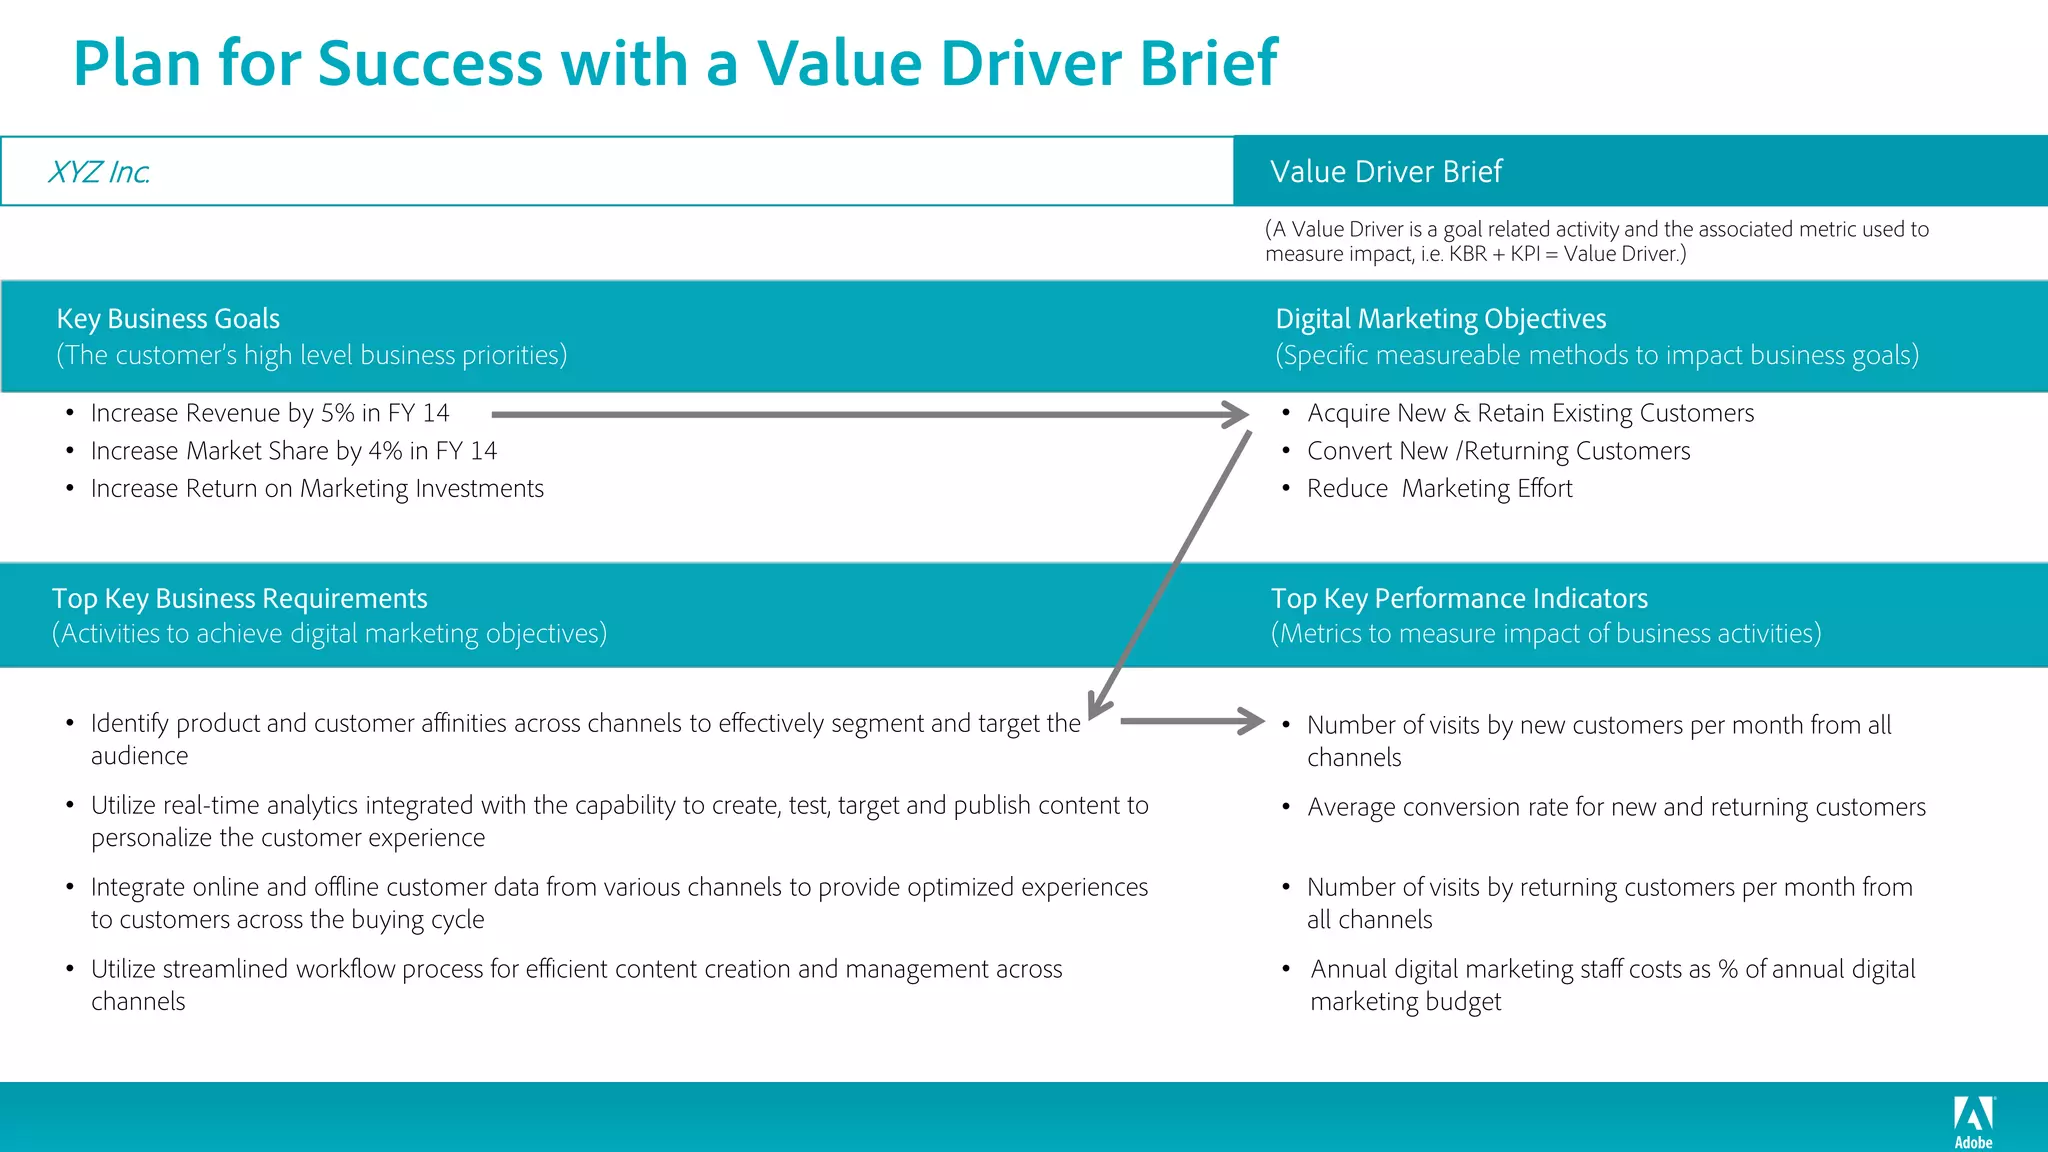
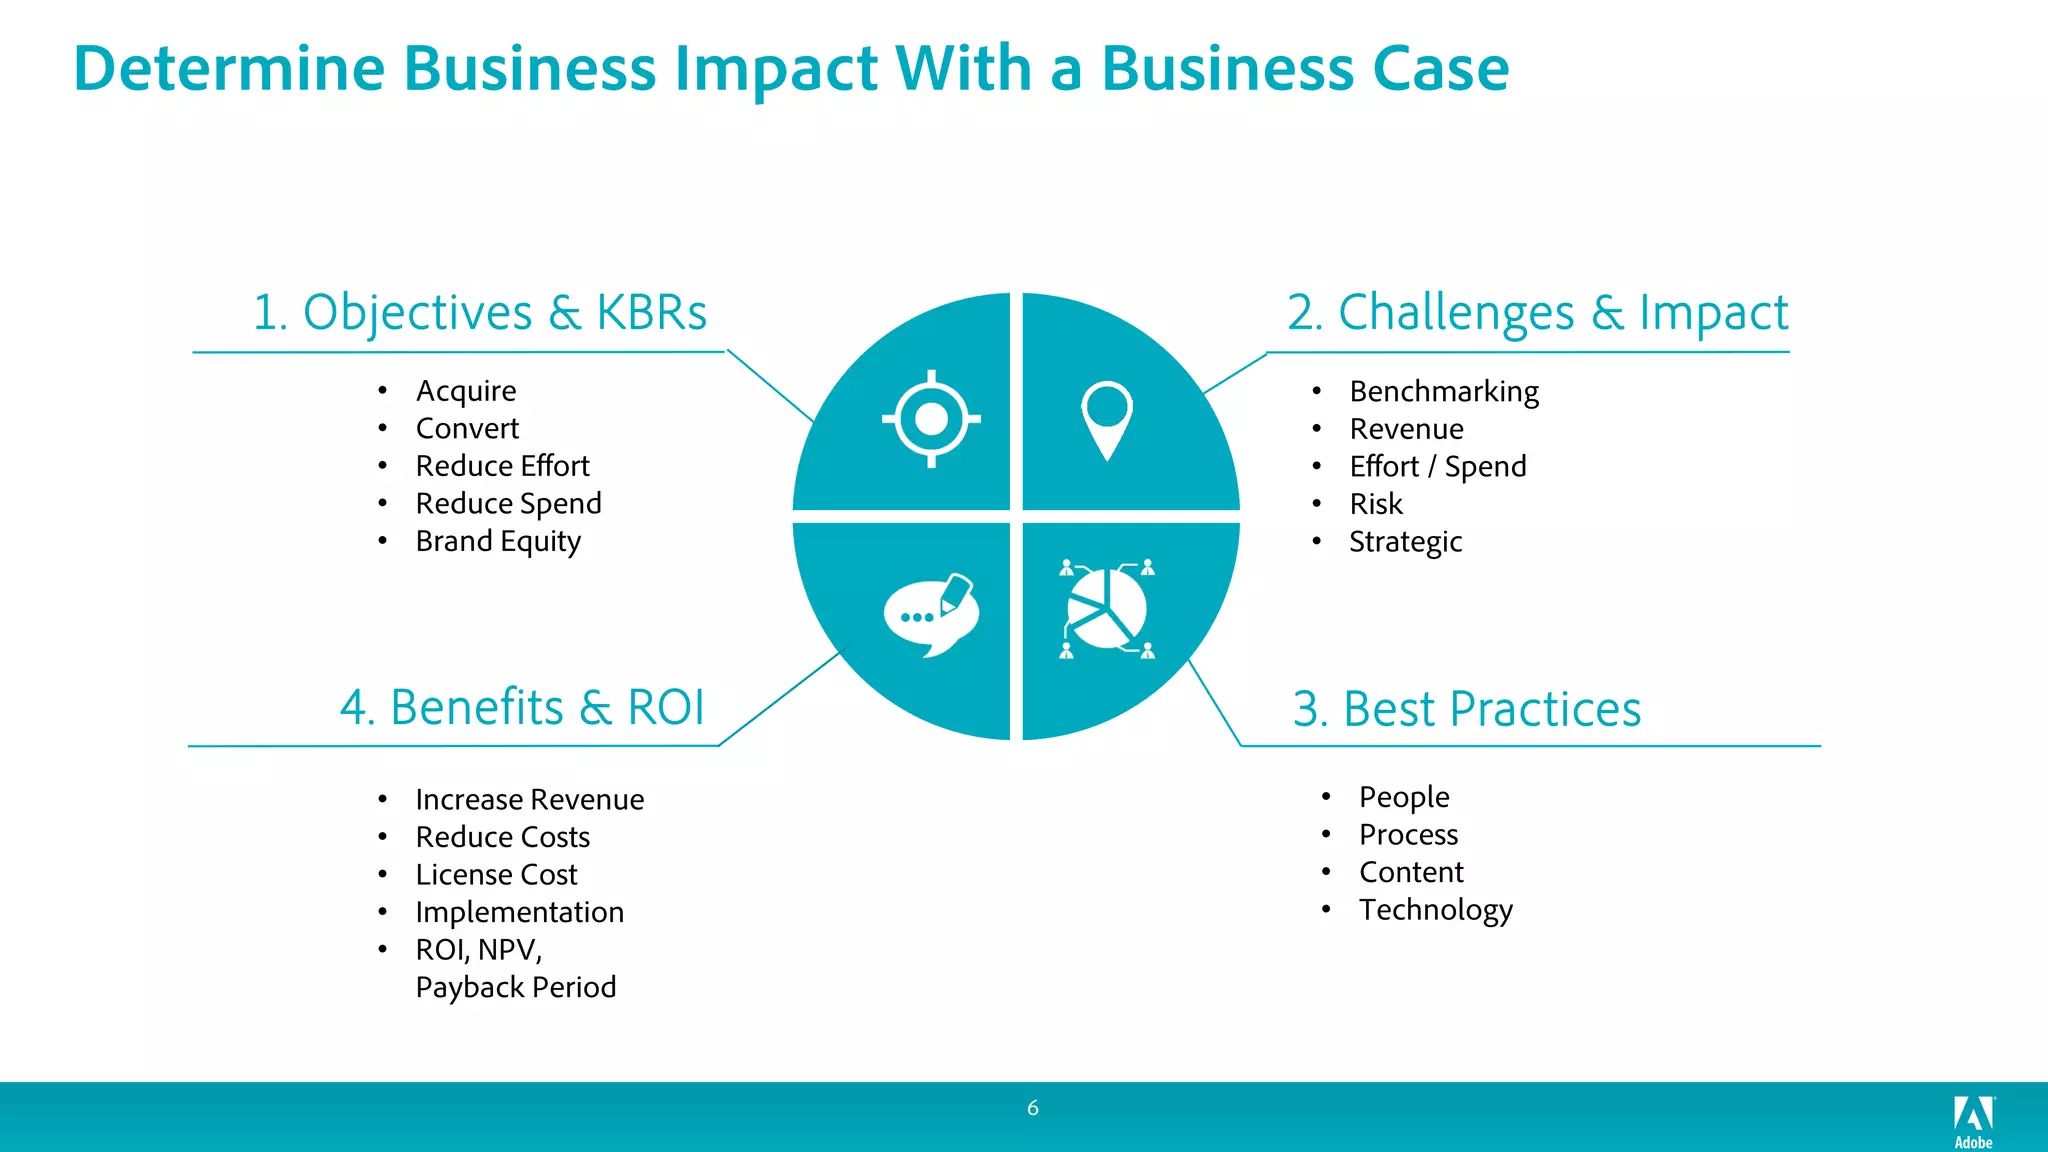
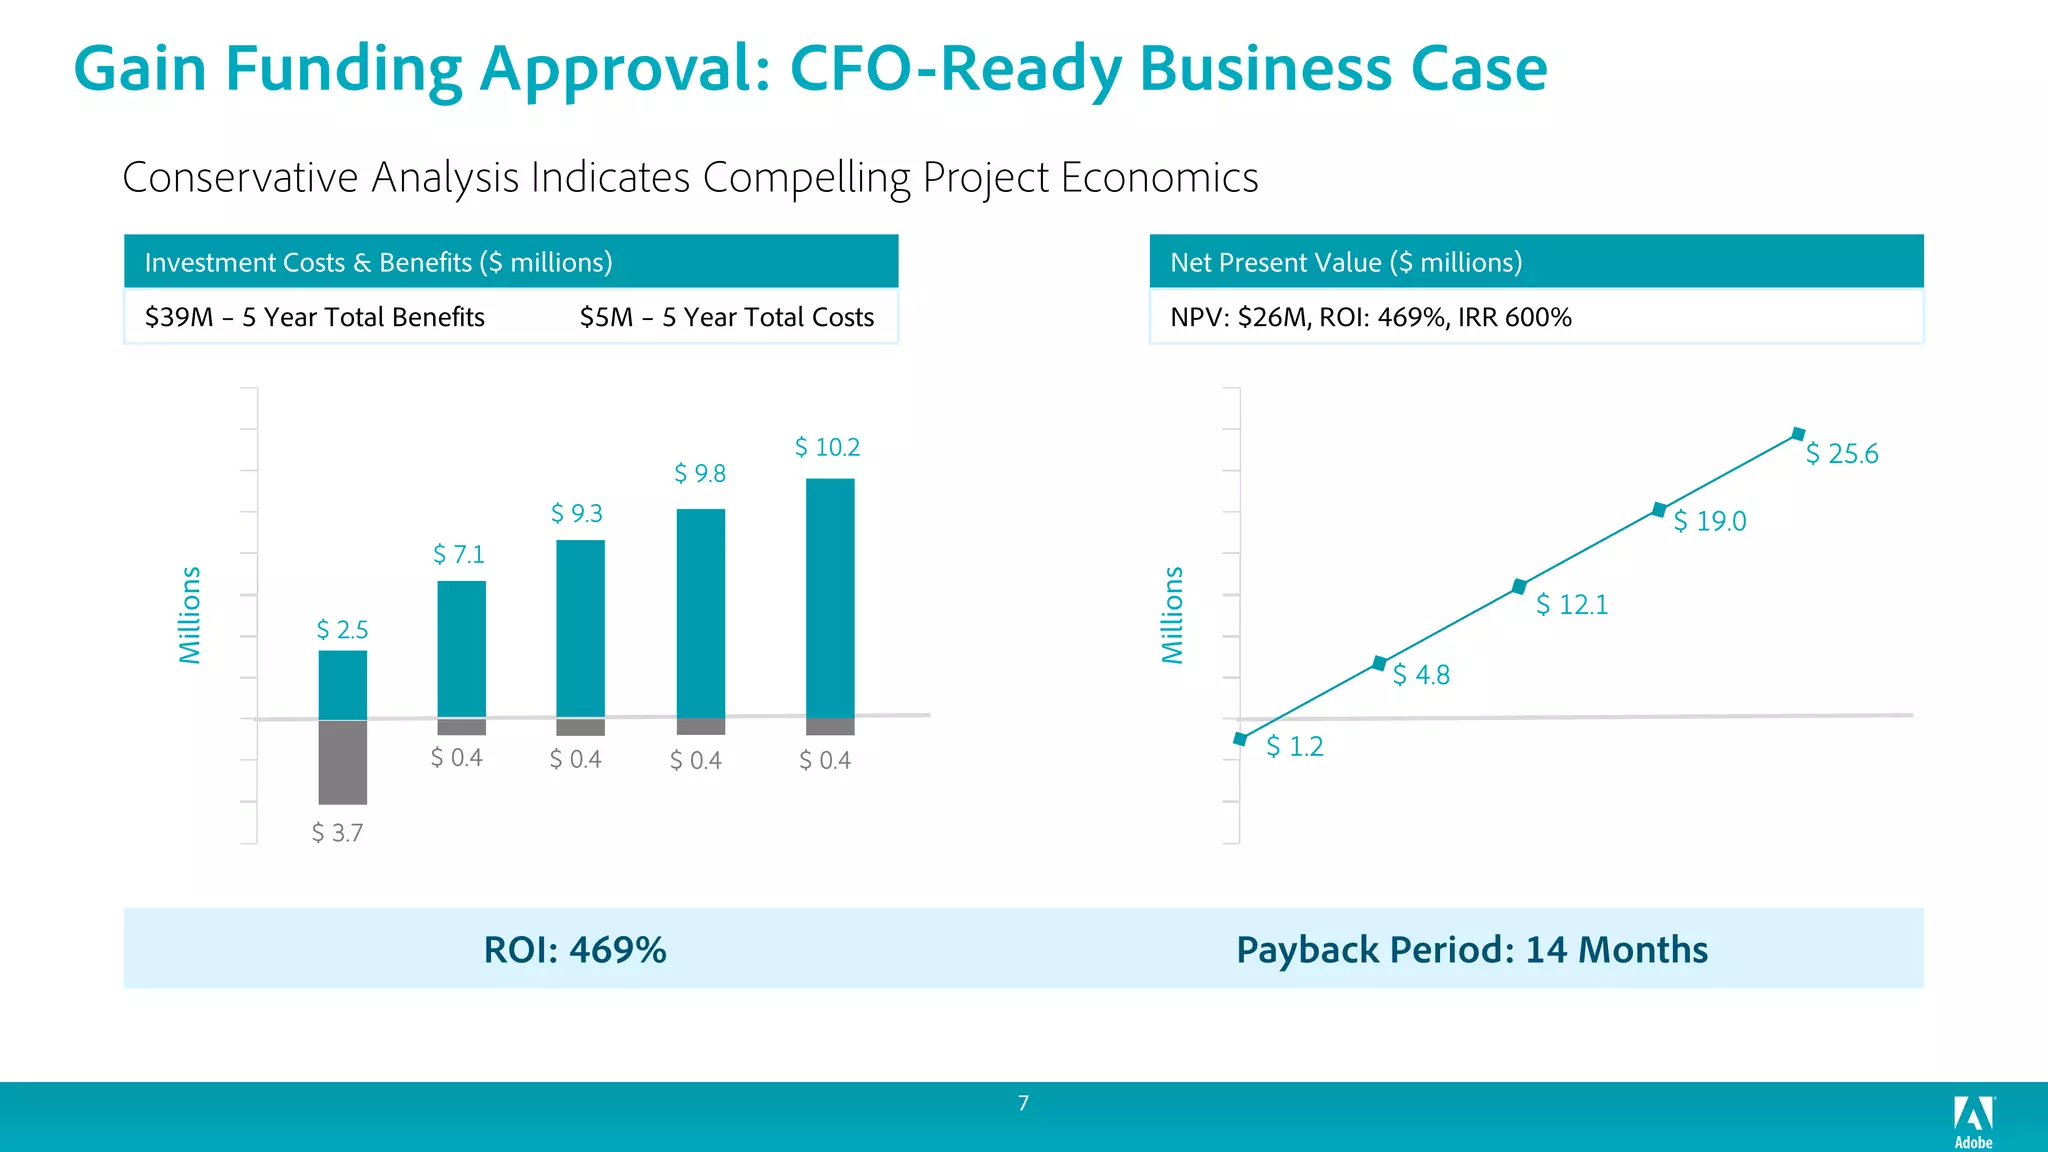
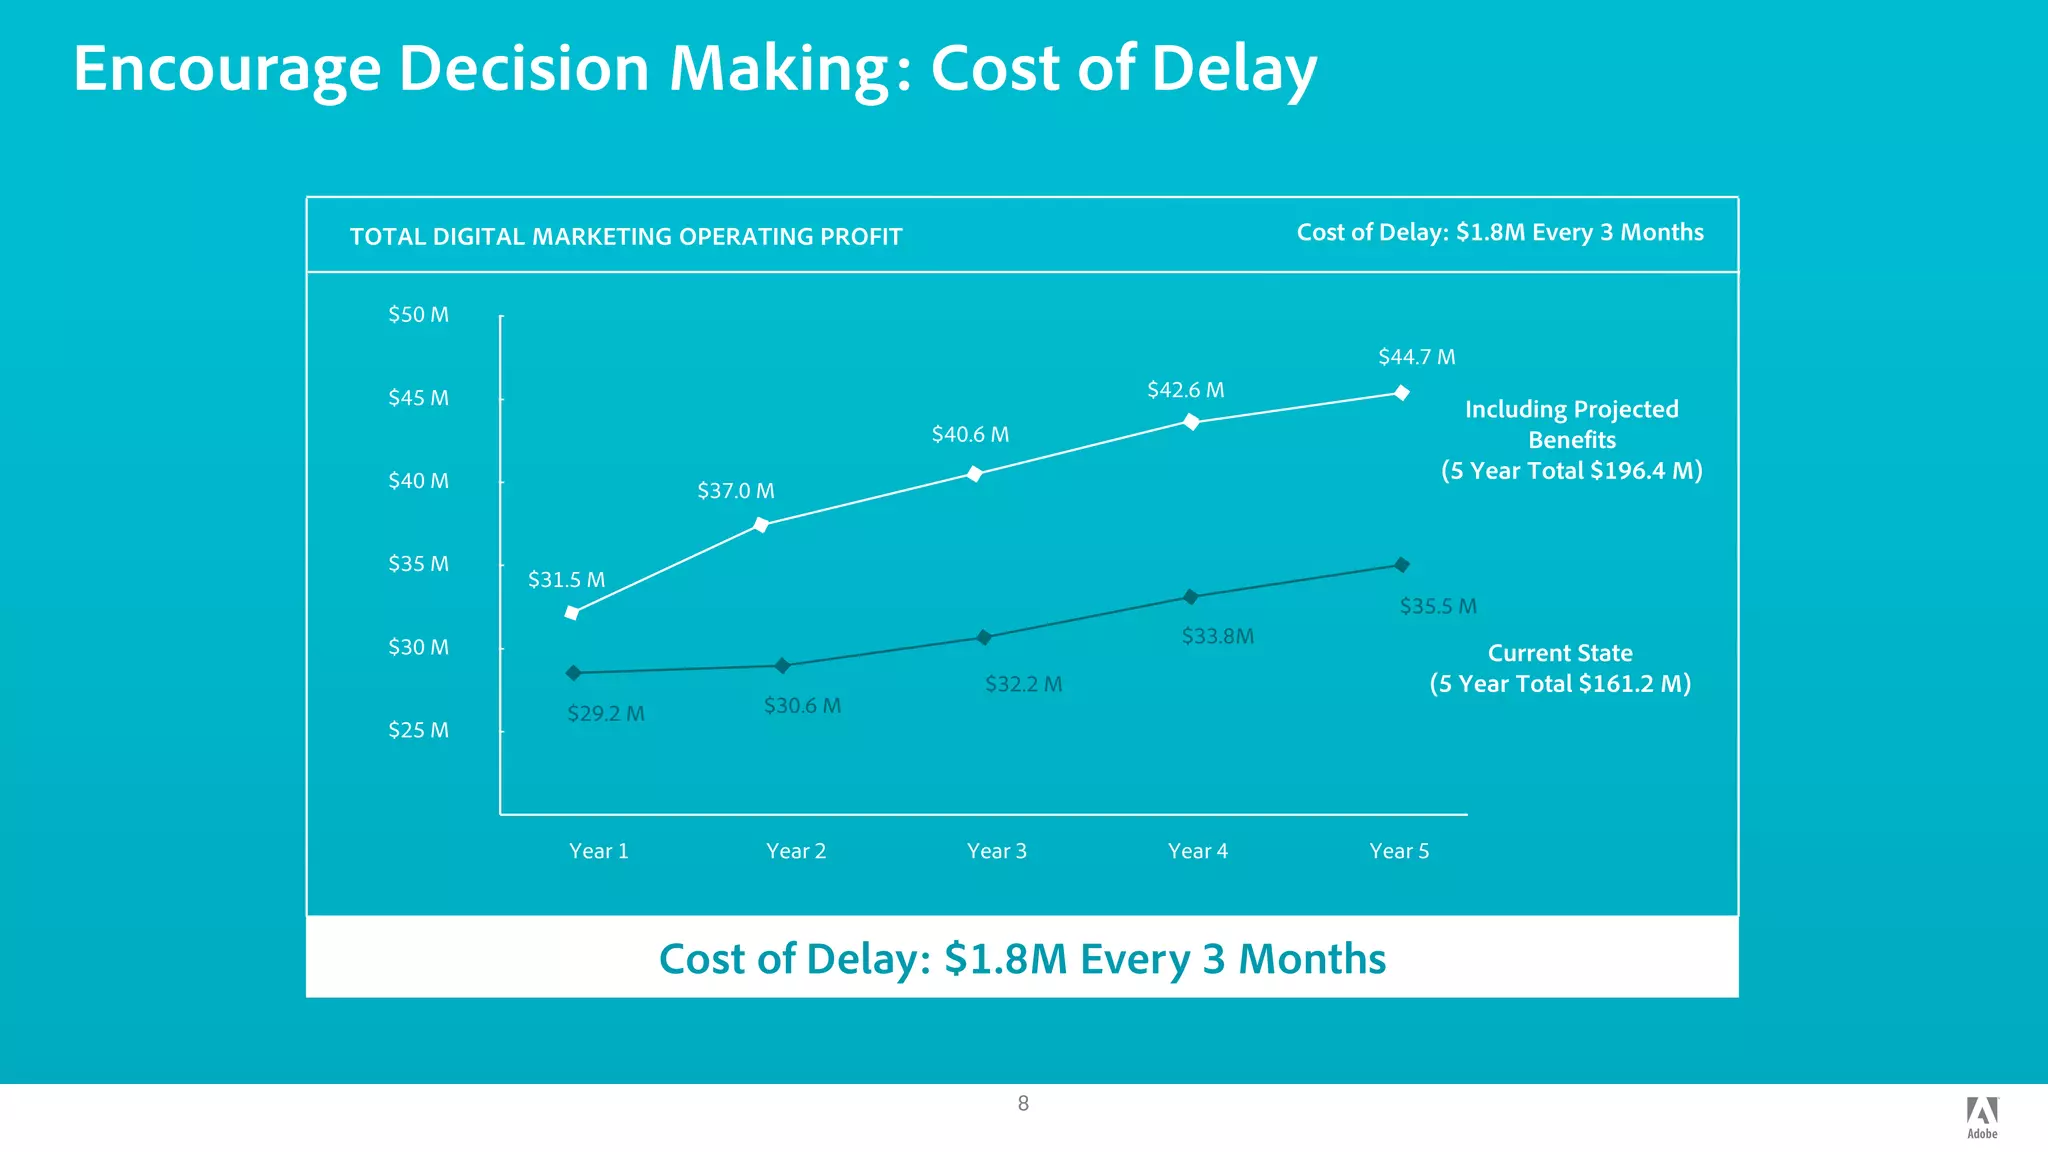
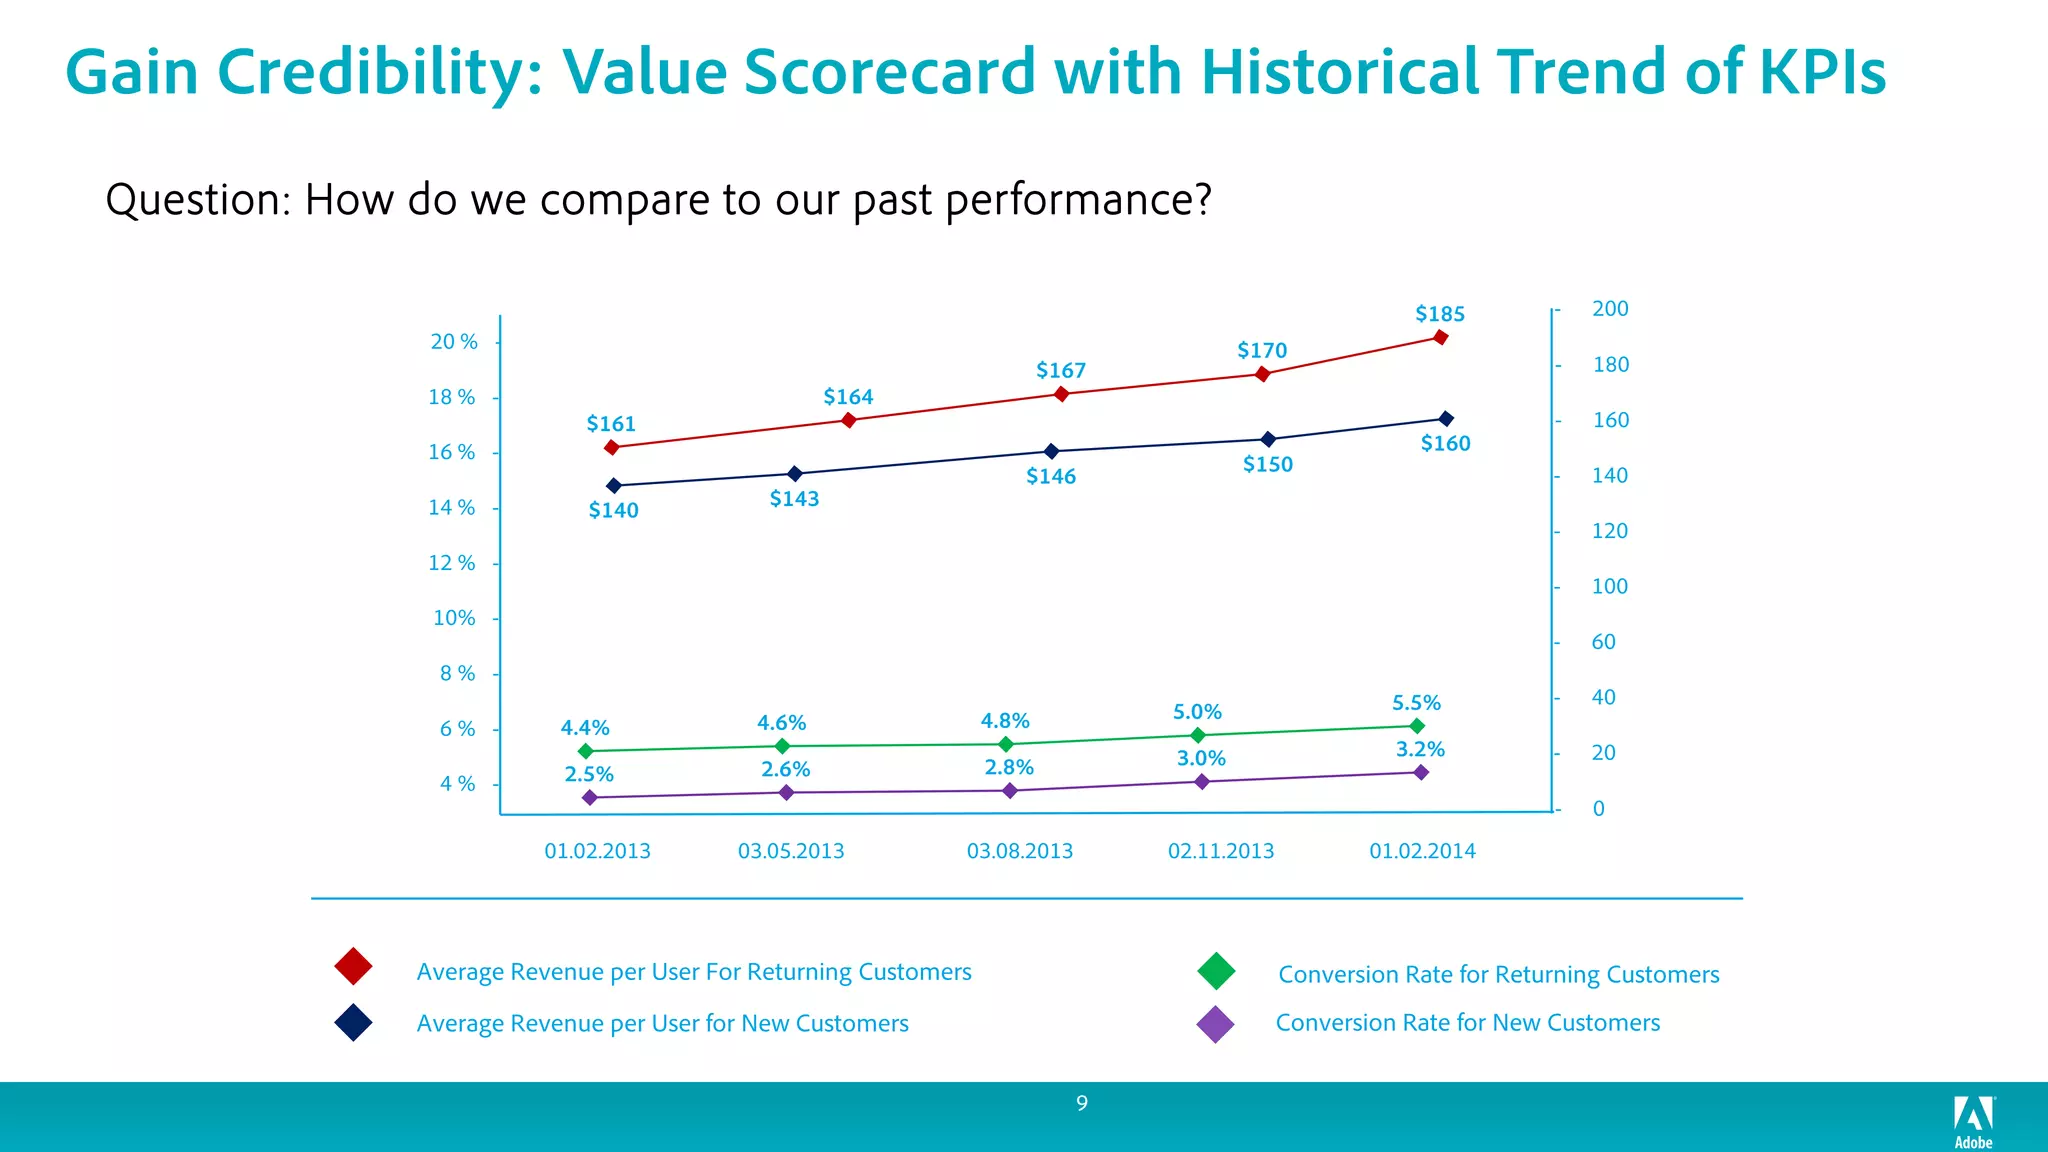
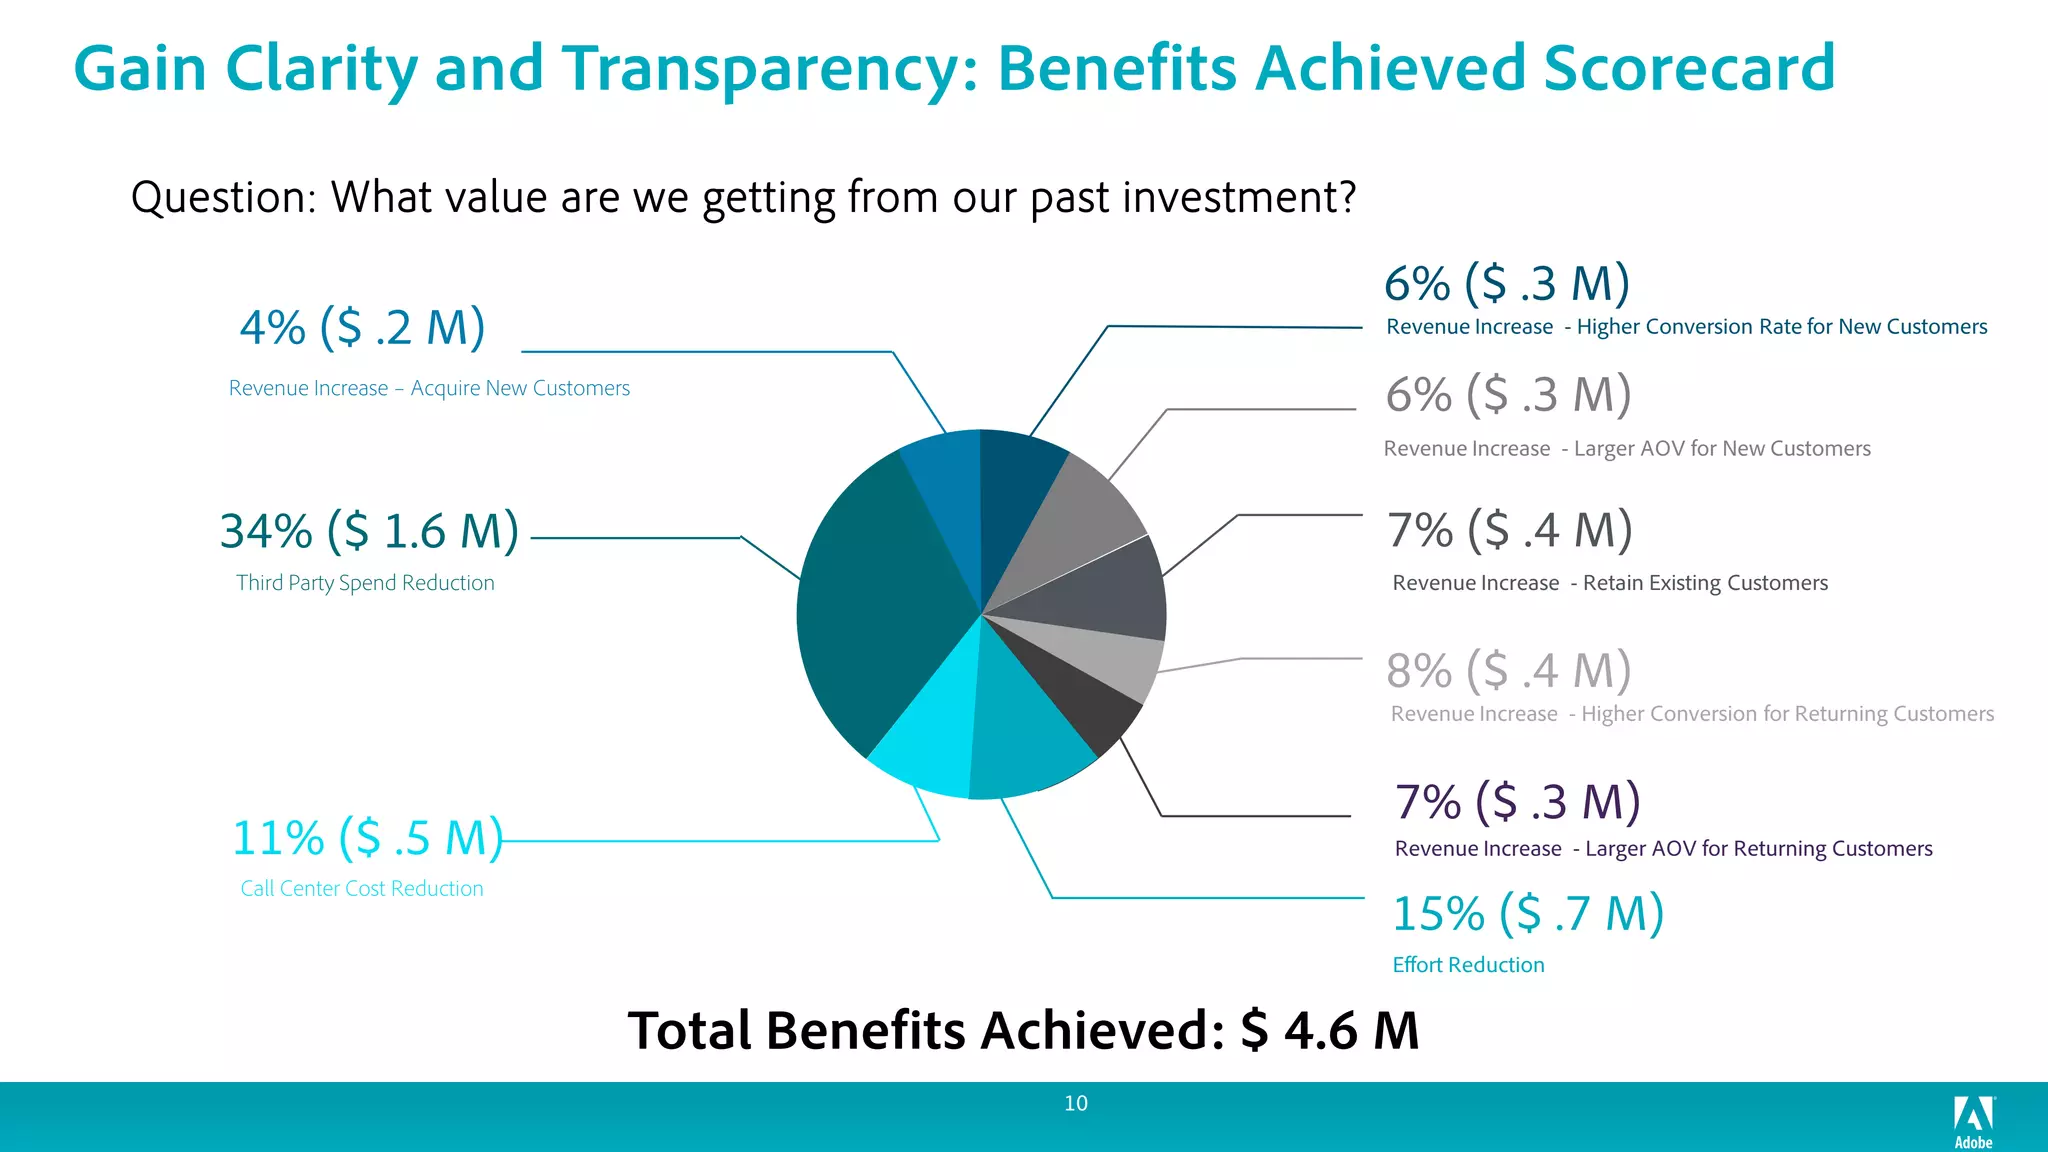
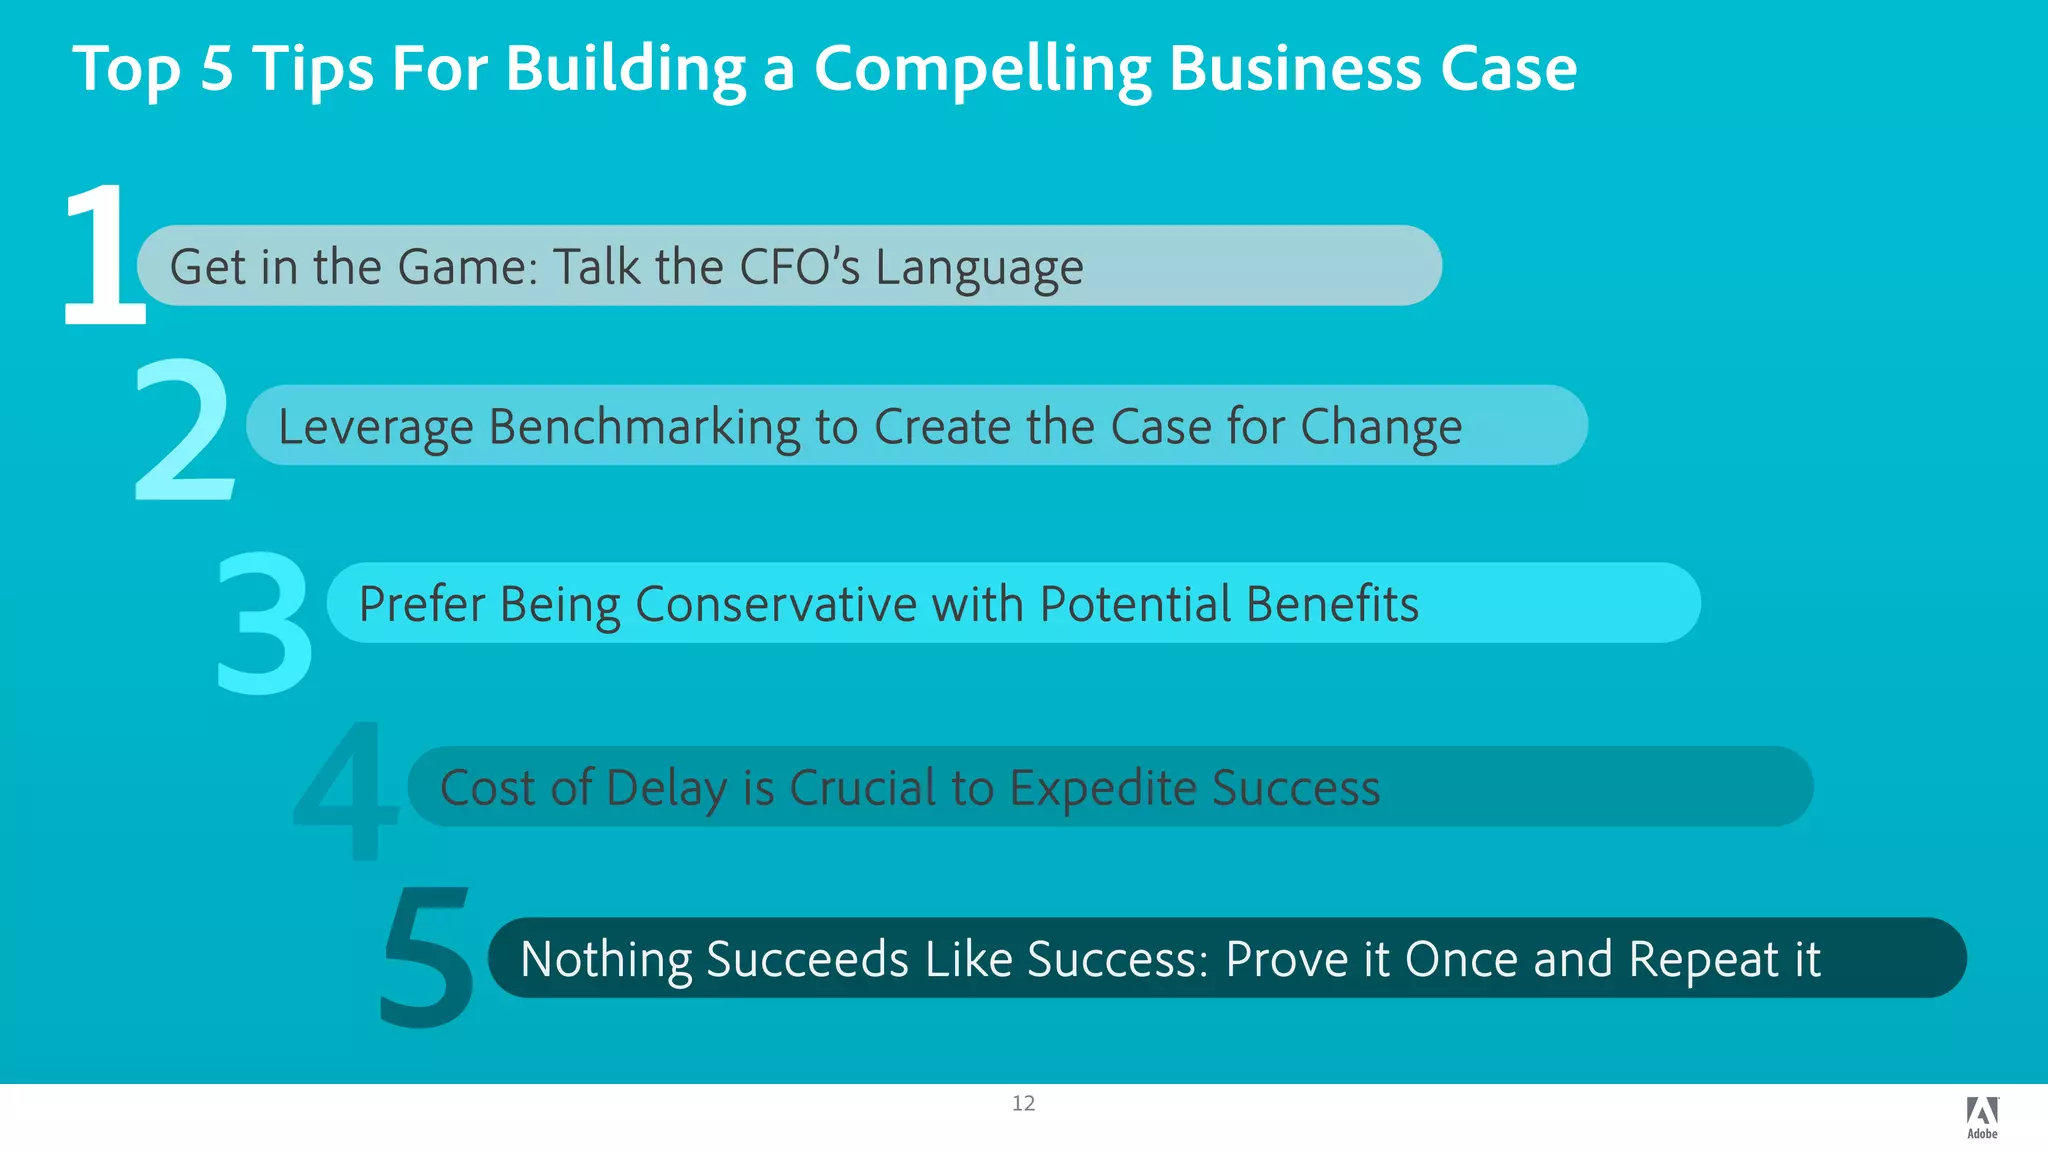
Achieve Success with a Compelling Business Case
Anurag Goel, Asia Pacific Japan Manager, Value Engineering at Adobe Digital Marketing ROI Forum
Hong Kong, 20 May, 2014
Agenda
How Does a Business Case Increase Your Chances of Success1.
How Are Organizations Building a Business Case That the CFO Buys
Into, and Acts on quickly
2.
What Can You Do To Get Started?3.
Why a Business Case is Critical to Project Success
3
Difficulty Focusing
on Business Value
1. Excessive time to
value
2. Limited adoption
Difficulty Envisioning
and Measuring Success
1. Gaining consensus
2. Planning a way forward
Difficulty Determining
Business Impact
1. Gaining executive
sponsorship
2. Gaining funding
approval
Value Management Pays Off
4
Organizations that measure value are more likely to realize value on-time or early
Source: SAP Survey of 286 enterprise software projects
72%
28%
Do Not Measure Value Measure Value
73%
27%
Delay in Time to Value
On-time or
Better
89%
11%
On-time or Better
Delay in Time to Value
5
Top Key Business Requirements Top Key Performance Indicators
(Activities to achieve digital marketing objectives) (Metrics to measure impact of business activities)
• Acquire New & Retain Existing Customers
• Convert New /Returning Customers
• Reduce Marketing Effort
• Identify product and customer affinities across channels to effectively segment and target the
audience
• Utilize real-time analytics integrated with the capability to create, test, target and publish content to
personalize the customer experience
• Integrate online and offline customer data from various channels to provide optimized experiences
to customers across the buying cycle
• Utilize streamlined workflow process for efficient content creation and management across
channels
• Number of visits by new customers per month from all
channels
• Average conversion rate for new and returning customers
• Number of visits by returning customers per month from
all channels
• Annual digital marketing staff costs as % of annual digital
marketing budget
Key Business Goals Digital Marketing Objectives
(The customer’s high level business priorities) (Specific measureable methods to impact business goals)
• Increase Revenue by 5% in FY 14
• Increase Market Share by 4% in FY 14
• Increase Return on Marketing Investments
(A Value Driver is a goal related activity and the associated metric used to
measure impact, i.e. KBR + KPI = Value Driver.)
Value Driver BriefXYZ Inc.
Plan for Success with a Value Driver Brief
6
• Increase Revenue
• Reduce Costs
• License Cost
• Implementation
• ROI, NPV,
Payback Period
• People
• Process
• Content
• Technology
• Benchmarking
• Revenue
• Effort / Spend
• Risk
• Strategic
• Acquire
• Convert
• Reduce Effort
• Reduce Spend
• Brand Equity
1. Objectives & KBRs
4. Benefits & ROI 3. Best Practices
2. Challenges & Impact
Determine Business Impact With a Business Case
7
Gain Funding Approval: CFO-Ready Business Case
Conservative Analysis Indicates Compelling Project Economics
Investment Costs & Benefits ($ millions)
$39M – 5 Year Total Benefits $5M – 5 Year Total Costs
$ 2.5
$ 3.7
$ 7.1
$ 0.4
$ 9.3
$ 0.4
$ 9.8
$ 0.4
$ 1.2$ 0.4
Millions
Net Present Value ($ millions)
NPV: $26M, ROI: 469%, IRR 600%
Millions
$ 4.8
$ 12.1
$ 19.0
$ 25.6$ 10.2
ROI: 469% Payback Period: 14 Months
Encourage Decision Making: Cost of Delay
8
Cost of Delay: $1.8M Every 3 Months
Year 1
$25 M -
$30 M -
$35 M -
$40 M -
$45 M -
$50 M -
Cost of Delay: $1.8M Every 3 MonthsTOTAL DIGITAL MARKETING OPERATING PROFIT
Year 2 Year 3 Year 4 Year 5
$29.2 M $30.6 M
$32.2 M
$33.8M
$35.5 M
$31.5 M
$37.0 M
$40.6 M
$42.6 M
$44.7 M
Including Projected
Benefits
(5 Year Total $196.4 M)
Current State
(5 Year Total $161.2 M)
9
Question: How do we compare to our past performance?
Gain Credibility: Value Scorecard with Historical Trend of KPIs
01.02.2013
4 % -
03.05.2013 03.08.2013 02.11.2013 01.02.2014
2.5% 2.6% 2.8% 3.0% 3.2%
$161
$164
$167
$170
$185
Average Revenue per User For Returning Customers
6 % -
8 % -
10% -
12 % -
14 % -
16 % -
18 % -
20 % -
Average Revenue per User for New Customers Conversion Rate for New Customers
$140
$143
$146
$150
$160
4.4% 4.6% 4.8% 5.0% 5.5%
Conversion Rate for Returning Customers
- 20
- 40
- 160
- 0
- 180
- 200
- 60
- 100
- 120
- 140
10
Question: What value are we getting from our past investment?
Gain Clarity and Transparency: Benefits Achieved Scorecard
4% ($ .2 M)
11% ($ .5 M)
34% ($ 1.6 M) 7% ($ .4 M)
8% ($ .4 M)
6% ($ .3 M)
6% ($ .3 M)
7% ($ .3 M)
15% ($ .7 M)
Revenue Increase – Acquire New Customers
Third Party Spend Reduction
Call Center Cost Reduction
Effort Reduction
Revenue Increase - Larger AOV for Returning Customers
Revenue Increase - Higher Conversion for Returning Customers
Revenue Increase - Retain Existing Customers
Revenue Increase - Larger AOV for New Customers
Revenue Increase - Higher Conversion Rate for New Customers
Total Benefits Achieved: $ 4.6 M
• Provide success metrics
• Increase consensus
• Offer a way forward
• Promote vendor partnering
• Prioritize business requirements
• Make value transparent
• Gain executive sponsorship
• Gain budget approval
• Reduce time to value
• Increase adoption
11
What Does This Mean to Your Organization
Top 5 Tips For Building a Compelling Business Case
12
Get in the Game: Talk the CFO’s Language
2 Leverage Benchmarking to Create the Case for Change
3 Prefer Being Conservative with Potential Benefits
4 Cost of Delay is Crucial to Expedite Success
5 Nothing Succeeds Like Success: Prove it Once and Repeat it
1
Resources to Learn More:
1. “Dollarization Discipline” Buy on Amazon
2. “Challenger Sale” Watch on YouTube
3. Hong Kong Institute of Value Management
4. SAVE International
5. Directly Contact Daniel Cham from Adobe Sales (cham@adobe.com)
6. Contact Me on LinkedIn (http://www.linkedin.com/in/anuraggoel2)
Organizations Achieve Success by Focusing on Value, Implementing
Best Practices, and Measuring Goal Achievement.
- Jim Collins, Built To Last
ANURAG GOEL
JAPAC Manager, Value Engineering
O +91.120.613.7500
M +91.987.369.0242
anugoel@adobe.com
13
Resources for Getting Started & Discussion
Achieve Digital Transformation Success with Value Management

Achieve Digital Transformation Success with Value Management

  • 1.
    Achieve Success witha Compelling Business Case Anurag Goel, Asia Pacific Japan Manager, Value Engineering at Adobe Digital Marketing ROI Forum Hong Kong, 20 May, 2014
  • 2.
    Agenda How Does aBusiness Case Increase Your Chances of Success1. How Are Organizations Building a Business Case That the CFO Buys Into, and Acts on quickly 2. What Can You Do To Get Started?3.
  • 3.
    Why a BusinessCase is Critical to Project Success 3 Difficulty Focusing on Business Value 1. Excessive time to value 2. Limited adoption Difficulty Envisioning and Measuring Success 1. Gaining consensus 2. Planning a way forward Difficulty Determining Business Impact 1. Gaining executive sponsorship 2. Gaining funding approval
  • 4.
    Value Management PaysOff 4 Organizations that measure value are more likely to realize value on-time or early Source: SAP Survey of 286 enterprise software projects 72% 28% Do Not Measure Value Measure Value 73% 27% Delay in Time to Value On-time or Better 89% 11% On-time or Better Delay in Time to Value
  • 5.
    5 Top Key BusinessRequirements Top Key Performance Indicators (Activities to achieve digital marketing objectives) (Metrics to measure impact of business activities) • Acquire New & Retain Existing Customers • Convert New /Returning Customers • Reduce Marketing Effort • Identify product and customer affinities across channels to effectively segment and target the audience • Utilize real-time analytics integrated with the capability to create, test, target and publish content to personalize the customer experience • Integrate online and offline customer data from various channels to provide optimized experiences to customers across the buying cycle • Utilize streamlined workflow process for efficient content creation and management across channels • Number of visits by new customers per month from all channels • Average conversion rate for new and returning customers • Number of visits by returning customers per month from all channels • Annual digital marketing staff costs as % of annual digital marketing budget Key Business Goals Digital Marketing Objectives (The customer’s high level business priorities) (Specific measureable methods to impact business goals) • Increase Revenue by 5% in FY 14 • Increase Market Share by 4% in FY 14 • Increase Return on Marketing Investments (A Value Driver is a goal related activity and the associated metric used to measure impact, i.e. KBR + KPI = Value Driver.) Value Driver BriefXYZ Inc. Plan for Success with a Value Driver Brief
  • 6.
    6 • Increase Revenue •Reduce Costs • License Cost • Implementation • ROI, NPV, Payback Period • People • Process • Content • Technology • Benchmarking • Revenue • Effort / Spend • Risk • Strategic • Acquire • Convert • Reduce Effort • Reduce Spend • Brand Equity 1. Objectives & KBRs 4. Benefits & ROI 3. Best Practices 2. Challenges & Impact Determine Business Impact With a Business Case
  • 7.
    7 Gain Funding Approval:CFO-Ready Business Case Conservative Analysis Indicates Compelling Project Economics Investment Costs & Benefits ($ millions) $39M – 5 Year Total Benefits $5M – 5 Year Total Costs $ 2.5 $ 3.7 $ 7.1 $ 0.4 $ 9.3 $ 0.4 $ 9.8 $ 0.4 $ 1.2$ 0.4 Millions Net Present Value ($ millions) NPV: $26M, ROI: 469%, IRR 600% Millions $ 4.8 $ 12.1 $ 19.0 $ 25.6$ 10.2 ROI: 469% Payback Period: 14 Months
  • 8.
    Encourage Decision Making:Cost of Delay 8 Cost of Delay: $1.8M Every 3 Months Year 1 $25 M - $30 M - $35 M - $40 M - $45 M - $50 M - Cost of Delay: $1.8M Every 3 MonthsTOTAL DIGITAL MARKETING OPERATING PROFIT Year 2 Year 3 Year 4 Year 5 $29.2 M $30.6 M $32.2 M $33.8M $35.5 M $31.5 M $37.0 M $40.6 M $42.6 M $44.7 M Including Projected Benefits (5 Year Total $196.4 M) Current State (5 Year Total $161.2 M)
  • 9.
    9 Question: How dowe compare to our past performance? Gain Credibility: Value Scorecard with Historical Trend of KPIs 01.02.2013 4 % - 03.05.2013 03.08.2013 02.11.2013 01.02.2014 2.5% 2.6% 2.8% 3.0% 3.2% $161 $164 $167 $170 $185 Average Revenue per User For Returning Customers 6 % - 8 % - 10% - 12 % - 14 % - 16 % - 18 % - 20 % - Average Revenue per User for New Customers Conversion Rate for New Customers $140 $143 $146 $150 $160 4.4% 4.6% 4.8% 5.0% 5.5% Conversion Rate for Returning Customers - 20 - 40 - 160 - 0 - 180 - 200 - 60 - 100 - 120 - 140
  • 10.
    10 Question: What valueare we getting from our past investment? Gain Clarity and Transparency: Benefits Achieved Scorecard 4% ($ .2 M) 11% ($ .5 M) 34% ($ 1.6 M) 7% ($ .4 M) 8% ($ .4 M) 6% ($ .3 M) 6% ($ .3 M) 7% ($ .3 M) 15% ($ .7 M) Revenue Increase – Acquire New Customers Third Party Spend Reduction Call Center Cost Reduction Effort Reduction Revenue Increase - Larger AOV for Returning Customers Revenue Increase - Higher Conversion for Returning Customers Revenue Increase - Retain Existing Customers Revenue Increase - Larger AOV for New Customers Revenue Increase - Higher Conversion Rate for New Customers Total Benefits Achieved: $ 4.6 M
  • 11.
    • Provide successmetrics • Increase consensus • Offer a way forward • Promote vendor partnering • Prioritize business requirements • Make value transparent • Gain executive sponsorship • Gain budget approval • Reduce time to value • Increase adoption 11 What Does This Mean to Your Organization
  • 12.
    Top 5 TipsFor Building a Compelling Business Case 12 Get in the Game: Talk the CFO’s Language 2 Leverage Benchmarking to Create the Case for Change 3 Prefer Being Conservative with Potential Benefits 4 Cost of Delay is Crucial to Expedite Success 5 Nothing Succeeds Like Success: Prove it Once and Repeat it 1
  • 13.
    Resources to LearnMore: 1. “Dollarization Discipline” Buy on Amazon 2. “Challenger Sale” Watch on YouTube 3. Hong Kong Institute of Value Management 4. SAVE International 5. Directly Contact Daniel Cham from Adobe Sales (cham@adobe.com) 6. Contact Me on LinkedIn (http://www.linkedin.com/in/anuraggoel2) Organizations Achieve Success by Focusing on Value, Implementing Best Practices, and Measuring Goal Achievement. - Jim Collins, Built To Last ANURAG GOEL JAPAC Manager, Value Engineering O +91.120.613.7500 M +91.987.369.0242 anugoel@adobe.com 13 Resources for Getting Started & Discussion