Downloaded 30 times


![1212
Follow the Money:
Airlines are
spending their hard
earned profits in
three primary areas
Source: Company Reports, ICF Analysis
Airline Profit Spend Analysis
[CELLRANGE],
20%
[CELLRANGE],
38%
[CELLRAN
GE], 42%
Profit Sharing
15%
Wage
Increases
5%Fleet
23%
Equity
Investments
5%
Other capex
10%
Debt
Repayments
16%
Stock Buy-
Back &
Dividends
26%
1. Labor ~ 20%:
Profit sharing
Wage increases
2. Capex ~ 38%:
Fleet renewal & cabin
upgrades
Facilities, offices, lounges
Equity partner investments
3. Investors ~ 42%:
Stock buy-backs
Dividends
Debt repayment](https://image.slidesharecdn.com/j-170208211108/85/MRO-Market-Update-Industry-Trends-13-320.jpg)
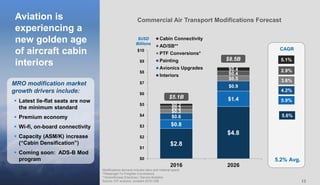

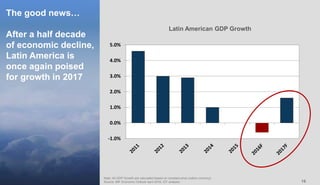
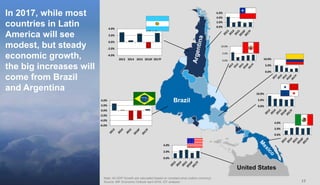


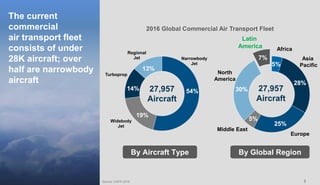
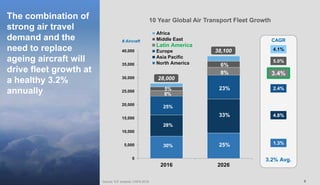
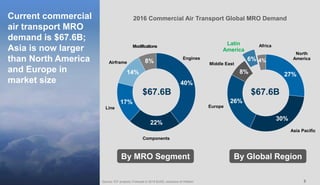
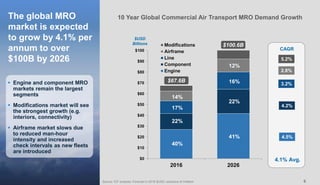
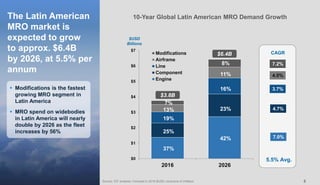
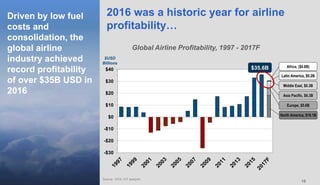
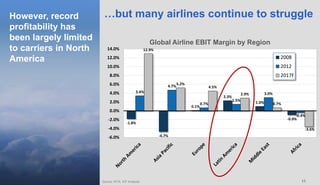
The document presents an MRO market update and industry trends, highlighting the global commercial air transport fleet's growth driven by rising air travel demand, expected to reach over $100 billion by 2026. The Latin American MRO market is projected to grow to approximately $6.4 billion by 2026, with significant investments in cabin modifications and fleet renewals. Overall, the aviation industry is experiencing record profitability, although challenges such as rising costs and macroeconomic factors persist.


