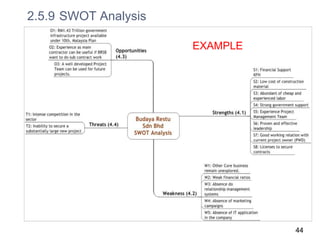
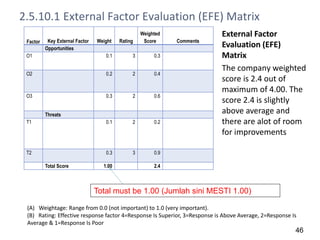
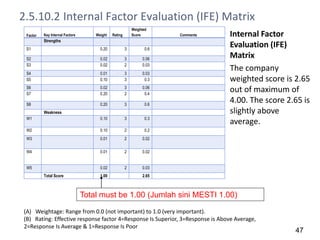
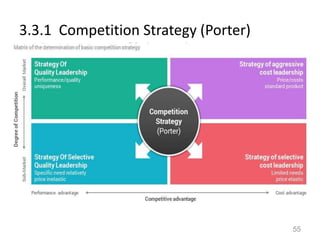
A competitive landscape is a business analysis method that identifies direct or indirect competitors to help comprehend their mission, vision, core values, niche market, strengths, and weaknesses. Based on the volatile nature of the business world, where companies represent competition to others, this analysis helps to establish a new mindset that facilitates the creation of strategic competitiveness.
Having the right information about the target market, competitors and potential customers are extremely important to the company's continuity and strength which increases its chances of success. For startups, in particular, it is essential to meet the needs of the fast-paced market.
Whether your company is a startup or you have a lot of work experience, gaining a comprehensive view of the current market and understanding competitors and what they are doing is crucial to your company's long-term success. Conducting a competitive landscape analysis gives you an opportunity to look at your competitors critically of their marketing efforts and will provide you with some ideas that can be used to make your startup's marketing strategy effective.
1. Name of Company /
Product
For: Sir Mohd Hisham Bin Hashim
Team No:
Date: (Presentation Date)
Insert Company
Logo or Product
image here.
(NO UniKL Logo
Please)
1
Note – Company MUST
be an SME, startup
capital must be less
than RM100k. It can
either be online, retail
outlet, reseller,
dropship. No factory
please. Assembly yes!
2. Agenda
No Agenda Presenter
1.0 Executive Summary (name)
2.0 Situational Analysis
3.0 Market Planning
4.0
Financial Modelling For
Marketing Strategy
5.0 Control
2
3. 1.0 Executive Summary
1.1 Company Background
1.2 Company Ownership (who are the owner
of the company)
1.3 Area of Operation
1.4 Product / Service Offering
1.5 Company’s Value Proposition
1.6 Mission, Vision and Values
3
5. 1.2 Company Owners
Indicate the percentage of ownership in the company
Mirjam
Nilsson
COO
Victoria
Lindqvist
COB
Alexander
Martensson
CFO
Angelica
Astrom
Head of
Operations
Mira
Karlsson
Head of
Technical
Flora
Berggren
Creative Director
5
6. 1.3 Area of Operation
Which market the company is currently serving
or intend to serve (example Setiawangsa) .
Please put an image using Google Street of
your company position.
Use Google Map to show your address.
6
7. 1.4 Product / Service Offering
Describe in detail what is your company product or service
offering. (Please read Chapter 13 if you are not sure)
7
8. 1.5 Company’s Value Proposition
Value is quality, price and service. What Value
proposition (or benefits) you want to offer to your
customer.
8
20. 2.2.5 Market Segmentation
Demographic (use 2 best) – example Gender,
Age, ethnic, income
Behavioral (use 2 best) – example usage rate or
user status or buyer readiness stage
Geographic (use 2 best) – country, state, city,
kampung
20
31. 2.4.1 Market Competition Analysis
Competitive Analysis (Spider Web) – please use the excel
file Competitor Analysis SpiderWeb.xlsx
Explain your company position against the competitor
31
35. Corporate Structure
Ahmad Amirun Fitri Bin Abu Zaimah
CEO, Owner of the company
Muhd Iqbal Bin Mat Rapi
Head of marketing, staff
Mohd Hafizuddin Bin Mohd
Hanafiah
Head of research & development,
staff
Nazrulhafiz Bin Zahudin
Head of human resource, staff
Mohd Shahidi Nasri Bin Mohd
Soffi
Head of financial, staff
35
43. 2.5.9 SWOT Analysis
Strength internal capabilities that may help a company
reach it objectives
Weakness Internal limitations that may interfere with a
company ability it achieve obj
Opportunity external factors that the company may able
to exploit to its advantage
Threat Current and emerging external factors that may
challenge the company performance
43
46. 2.5.10.1 External Factor Evaluation (EFE) Matrix
Factor Key External Factor Weight Rating
Weighted
Score Comments
Opportunities
O1 0.1 3 0.3
O2 0.2 2 0.4
O3 0.3 2 0.6
Threats
T1 0.1 2 0.2
T2 0.3 3 0.9
Total Score 1.00 2.4
External Factor
Evaluation (EFE)
Matrix
The company weighted
score is 2.4 out of
maximum of 4.00. The
score 2.4 is slightly
above average and
there are alot of room
for improvements
(A) Weightage: Range from 0.0 (not important) to 1.0 (very important).
(B) Rating: Effective response factor 4=Response Is Superior, 3=Response is Above Average, 2=Response Is
Average & 1=Response Is Poor
Total must be 1.00 (Jumlah sini MESTI 1.00)
46
47. Factor Key Internal Factors Weight Rating
Weighted
Score Comments
Strengths
S1 0.20 3 0.6
S2 0.02 3 0.06
S3 0.02 2 0.03
S4 0.01 3 0.03
S5 0.10 3 0.3
S6 0.02 3 0.06
S7 0.20 2 0.4
S8 0.20 3 0.6
Weakness
W1 0.10 3 0.3
W2 0.10 2 0.2
W3 0.01 2 0.02
W4 0.01 2 0.02
W5 0.02 2 0.03
Total Score 1.00 2.65
Internal Factor
Evaluation (IFE)
Matrix
The company
weighted score is 2.65
out of maximum of
4.00. The score 2.65 is
slightly above
average.
2.5.10.2 Internal Factor Evaluation (IFE) Matrix
(A) Weightage: Range from 0.0 (not important) to 1.0 (very important).
(B) Rating: Effective response factor 4=Response Is Superior, 3=Response is Above Average,
2=Response Is Average & 1=Response Is Poor
Total must be 1.00 (Jumlah sini MESTI 1.00)
47
60. 3.4.1.2 Pricing Method
Pricing Method (used by your Team – read
chapter on pricing if you are not sure)
o Mark up pricing
o Target return pricing
o Perceived value pricing
60
67. 3.4.2.4 Product Innovation Strategy
What unique innovation that come along with your
product / service.
Note – Innovation can happen at (example) packaging, unique
processing, distribution method, inventory systems.
67
69. 3.4.3 Lead Generation Plan
3.4.3.1 Advertising & Promotion (Show one Advertising
in One of the local Newspaper)
3.4.3.2 Social Media Tools
o Blog
o Social Networking ( Facebook, Twitter, Instagram, WhatsApps)
Show at least ONE social media application of your company &
products)
3.4.3.3 Internet / Website
69
PLEASE SHOW YOUR WEBSITE OR FACEBAOOK ACCOUNT
76. 4.1 Financial Objectives
Example – To reduce cost, to increase margins ect ect.
76
Don’t forget to explain customer payment system, i.e. how
customer make their payment to your company after
purchasing
77. 4.2 Funding Category
Lorem ipsum dolor sit amet,
consectetur adipiscing elit.
Fund Category
Lorem ipsum dolor sit amet,
consectetur adipiscing elit.
Fund Category
$82,00
0
$32,00
0
$14,00
0
$12,00
0
Lorem ipsum dolor sit amet,
consectetur adipiscing elit.
Fund Category
Lorem ipsum dolor sit amet,
consectetur adipiscing elit.
Fund Category
77
78. 4.3 Key Components of Financial Forecast
4.3.1 Key Input
4.3.2 R&C 12 Month
4.3.3 R&C 10 Years
4.3.4 CF Analysis 12 Months
4.3.5 CF Analysis 10 Years
4.3.6 P&L 12 Month
4.3.7 P&L 10 Years
4.3.8 BS 10 Years
4.3.9 Financial Performance – 10 years
4.3.10Financial Performance (Graph)
4.3.11Breakeven Analysis 78
91. 5.1.1 Overall Organization
Overall Company (The Company Overall Organizational
Chart)
This include not only marketing. Production & operation,
Finance & Acc, Logistics & Supply chain, Retail, North
Division, South Division, East & West ect, ect.
91
92. 5.1.2 Marketing Department OC
Just the Marketing Division, Section or Unit OC and explain the
role of each sections and the functions of each of the employee.
(example of sections)
Promotion & Advertising Section
Event Management Section
Online back room operation Section
Call center
Distribution and online
92
98. 5.3 Contingency planning
5.3.1 Best Case Scenario
5.3.2 Worst Case Scenario
Please Use “Fishbone” Technique
to explain both Scenario.
The contingency plan must relate to the mile stone (Implementation Plan (5.2.4).
Worst case scenario (if the plan did not happen, what bad things can happens to the
company – minimum 3)
Best case scenario (if everything go according to plan or well above planning –
minimum 3)
98
2.1.1 Discuss the general economic outlook for the country 2019.
Consumer purchasing power
Level of inflation
Interest rate expectations
2.1.2 What Malaysian economic events that have the most effects on your product. (environment, new laws, halal or NGOs)
2.1.3 Google up information about your product/service from One local newspaper and ONE local magazine (show your evidence)
This table depicts the various characteristics and objectives of each of the product life-cycle stages.
This table depicts the various strategies of each of the product life-cycle stages.