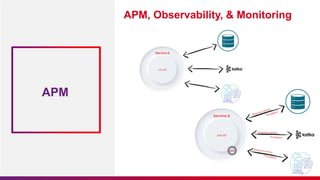
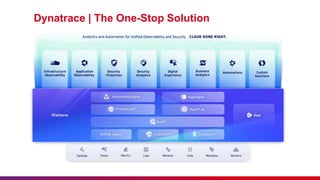
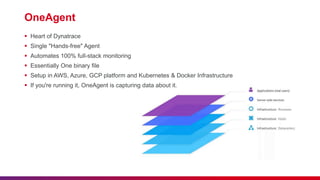
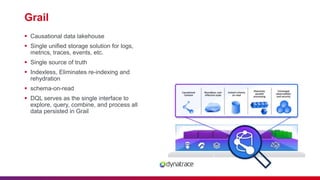
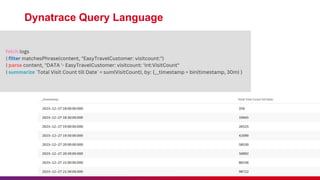
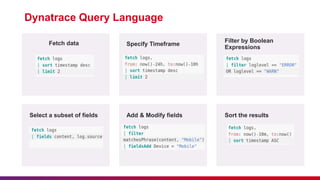
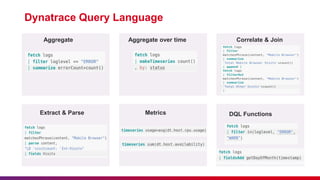
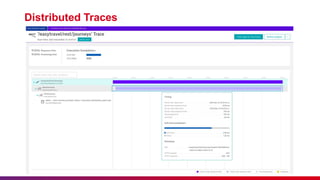
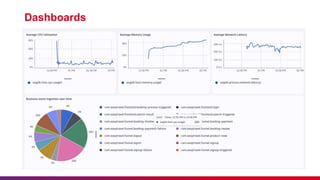
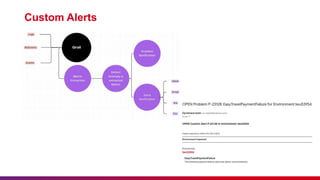
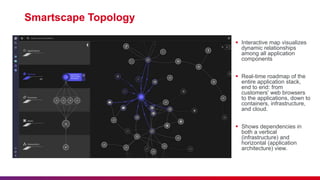
Monitoring with
Dynatrace
Humera Ahmad, Swantika Gupta
Lack of etiquette and manners is a huge turn off.
KnolX Etiquettes
 Punctuality
Join the session 5 minutes prior to the session start time. We start on
time and conclude on time!
 Feedback
Make sure to submit a constructive feedback for all sessions as it is very
helpful for the presenter.
 Silent Mode
Keep your mobile devices in silent mode, feel free to move out of session
in case you need to attend an urgent call.
 Avoid Disturbance
Avoid unwanted chit chat during the session.
1. Getting Started with Dynatrace
 APM, Observability, & Monitoring
 Dynatrace | The One-Stop Solution
 OneAgent
 Grail
2. Dynatrace Query Language
3. Distributed Traces
4. Dashboards & Alerts in Dynatrace
5. SmartScape Topology
APM, Observability, & Monitoring
APM
APM, Observability, & Monitoring
APM
APM, Observability, & Monitoring
APM
APM, Observability, & Monitoring
OBSERVABILITY
APM, Observability, & Monitoring
OBSERVABILITY
APM, Observability, & Monitoring
MONITORING
APM,
Observability, &
Monitoring
Dynatrace | The One-Stop Solution
x-special/nautilus-
clipboard copy
file:///home/knoldus/Desk
top/DT%20Usecases.pn
g
OneAgent
 Heart of Dynatrace
 Single "Hands-free" Agent
 Automates 100% full-stack monitoring
 Essentially One binary file
 Setup in AWS, Azure, GCP platform and Kubernetes & Docker Infrastructure
 If you're running it, OneAgent is capturing data about it.
Grail
 Causational data lakehouse
 Single unified storage solution for logs,
metrics, traces, events, etc.
 Single source of truth
 Indexless, Eliminates re-indexing and
rehydration
 schema-on-read
 DQL serves as the single interface to
explore, query, combine, and process all
data persisted in Grail
02
Dynatrace Query Language
Fetch data
Dynatrace Query Language
Specify Timeframe
Filter by Boolean
Expressions
Select a subset of fields Add & Modify fields Sort the results
Aggregate
Dynatrace Query Language
Aggregate over time Correlate & Join
Extract & Parse Metrics DQL Functions
03
Distributed Traces
Distributed Traces
04
Dashboards
Alerts
 Full-stack monitoring insights
 For any anomalous behavior, a
"Problem Notification" is raised that can
be sent over email, slack, jira, and
many different integrations.
 Automatic detection of service-related
performance anomalies such as
response time degradations and failure
rate increases.
 Custom Alerts from Logs, BizEvents,
Events can be created as well.
Custom Alerts
05
Smartscape Topology
 Interactive map visualizes
dynamic relationships
among all application
components
 Real-time roadmap of the
entire application stack,
end to end: from
customers' web browsers
to the applications, down to
containers, infrastructure,
and cloud.
 Shows dependencies in
both a vertical
(infrastructure) and
horizontal (application
architecture) view.
Monitoring with Dynatrace Presentation.pptx

Monitoring with Dynatrace Presentation.pptx

  • 1.
  • 2.
    Lack of etiquetteand manners is a huge turn off. KnolX Etiquettes  Punctuality Join the session 5 minutes prior to the session start time. We start on time and conclude on time!  Feedback Make sure to submit a constructive feedback for all sessions as it is very helpful for the presenter.  Silent Mode Keep your mobile devices in silent mode, feel free to move out of session in case you need to attend an urgent call.  Avoid Disturbance Avoid unwanted chit chat during the session.
  • 3.
    1. Getting Startedwith Dynatrace  APM, Observability, & Monitoring  Dynatrace | The One-Stop Solution  OneAgent  Grail 2. Dynatrace Query Language 3. Distributed Traces 4. Dashboards & Alerts in Dynatrace 5. SmartScape Topology
  • 5.
    APM, Observability, &Monitoring APM
  • 6.
    APM, Observability, &Monitoring APM
  • 7.
    APM, Observability, &Monitoring APM
  • 8.
    APM, Observability, &Monitoring OBSERVABILITY
  • 9.
    APM, Observability, &Monitoring OBSERVABILITY
  • 10.
    APM, Observability, &Monitoring MONITORING
  • 11.
  • 12.
    Dynatrace | TheOne-Stop Solution x-special/nautilus- clipboard copy file:///home/knoldus/Desk top/DT%20Usecases.pn g
  • 13.
    OneAgent  Heart ofDynatrace  Single "Hands-free" Agent  Automates 100% full-stack monitoring  Essentially One binary file  Setup in AWS, Azure, GCP platform and Kubernetes & Docker Infrastructure  If you're running it, OneAgent is capturing data about it.
  • 14.
    Grail  Causational datalakehouse  Single unified storage solution for logs, metrics, traces, events, etc.  Single source of truth  Indexless, Eliminates re-indexing and rehydration  schema-on-read  DQL serves as the single interface to explore, query, combine, and process all data persisted in Grail
  • 15.
  • 16.
  • 17.
    Fetch data Dynatrace QueryLanguage Specify Timeframe Filter by Boolean Expressions Select a subset of fields Add & Modify fields Sort the results
  • 18.
    Aggregate Dynatrace Query Language Aggregateover time Correlate & Join Extract & Parse Metrics DQL Functions
  • 19.
  • 20.
  • 21.
  • 22.
  • 23.
  • 24.
    Alerts  Full-stack monitoringinsights  For any anomalous behavior, a "Problem Notification" is raised that can be sent over email, slack, jira, and many different integrations.  Automatic detection of service-related performance anomalies such as response time degradations and failure rate increases.  Custom Alerts from Logs, BizEvents, Events can be created as well.
  • 25.
  • 26.
  • 27.
    Smartscape Topology  Interactivemap visualizes dynamic relationships among all application components  Real-time roadmap of the entire application stack, end to end: from customers' web browsers to the applications, down to containers, infrastructure, and cloud.  Shows dependencies in both a vertical (infrastructure) and horizontal (application architecture) view.