Downloaded 165 times


![Monitoring IO on Linux
• There are a number of tools available to monitor IO on Linux. This
presentation looks at two tools, iostat and pt-diskstats. These tools
look to provide an overview of block devices iops, throughput and
latency.
• You can dive deeper:
– Tools such as iotop and atop can be used to expose process
level IO performance by gathering data from /proc/[process]/io.
– blktrace can be used with blkparse, either independently or by
using btrace. Output can also be analysed using seekwatcher.
– Tools such as bonnie/bonnie++, iometer, iozone, and ORION
can be used to benchmark a block device.
5](https://image.slidesharecdn.com/monitoring-linux-io-130425155045-phpapp01/85/Monitoring-IO-performance-with-iostat-and-pt-diskstats-5-320.jpg)
![iostat
• At the time of writing the current stable version is 10.0.5.
• Note version 10 removes support for kernels older than 2.6.
• The version you have installed can be found with -V option.
[ben@lab ~]$ iostat V
sysstat version 10.0.3
(C) Sebastien Godard (sysstat <at> orange.fr)
7](https://image.slidesharecdn.com/monitoring-linux-io-130425155045-phpapp01/85/Monitoring-IO-performance-with-iostat-and-pt-diskstats-7-320.jpg)
![iostat
• By default iostat produces two reports; the CPU Utilization report
and the Device Utilization report.
• The default invocation shows the statistics since system start up.
[ben@lab ~]$ iostat
Linux 3.8.4102.fc17.x86_64 (lab.mysqlhome) 04/10/2013 _x86_64_ (2 CPU)
avgcpu: %user %nice %system %iowait %steal %idle
17.56 2.93 3.62 2.42 0.00 73.47
Device: tps kB_read/s kB_wrtn/s kB_read kB_wrtn
sda 8.51 100.17 44.62 890987 396917
dm0 4.87 78.76 6.80 700565 60488
dm1 7.40 20.74 37.45 184505 333128
dm2 0.14 0.19 0.37 1693 3300
8](https://image.slidesharecdn.com/monitoring-linux-io-130425155045-phpapp01/85/Monitoring-IO-performance-with-iostat-and-pt-diskstats-8-320.jpg)
![iostat
• Inclusion of the CPU and Device Utilization reports can be
controlled with the -c and -d options.
• The Network Filesystem report (-n) was deprecated in version 10
and replaced with the nfsiostat and cifsiostat utilities.
[ben@lab ~]$ iostat c
Linux 3.8.4102.fc17.x86_64 (lab.mysqlhome) 04/10/2013 _x86_64_ (2 CPU)
avgcpu: %user %nice %system %iowait %steal %idle
17.01 2.66 3.69 2.35 0.00 74.29
[ben@lab ~]$ iostat d
Linux 3.8.4102.fc17.x86_64 (lab.mysqlhome) 04/10/2013 _x86_64_ (2 CPU)
Device: tps kB_read/s kB_wrtn/s kB_read kB_wrtn
sda 8.28 94.60 45.60 926915 446773
dm0 4.65 75.00 6.34 734861 62104
dm1 7.28 19.00 38.75 186129 379644
dm2 0.15 0.17 0.51 1701 5024
9](https://image.slidesharecdn.com/monitoring-linux-io-130425155045-phpapp01/85/Monitoring-IO-performance-with-iostat-and-pt-diskstats-9-320.jpg)
![iostat
• The default Device Utilization report can be replaced with extended
statistics using the -x option.
[ben@lab ~]$ iostat cx | [ben@lab ~]$ iostat x
Linux 3.8.4102.fc17.x86_64 (lab.mysqlhome) 04/10/2013 _x86_64_ (2 CPU)
avgcpu: %user %nice %system %iowait %steal %idle
16.23 2.27 3.67 2.20 0.00 75.63
Device: rrqm/s wrqm/s r/s w/s rkB/s wkB/s avgrqsz avgqusz await r_await w_await svctm %util
sda 1.34 2.67 3.33 4.39 81.15 45.44 32.81 0.51 66.41 29.59 94.30 7.77 6.00
dm0 0.00 0.00 3.24 0.82 64.10 5.72 34.38 0.37 91.29 35.84 309.17 4.94 2.01
dm1 0.00 0.00 1.34 5.77 16.54 39.14 15.66 0.31 43.20 32.95 45.59 6.42 4.56
dm2 0.00 0.00 0.05 0.10 0.15 0.58 9.56 0.01 68.81 26.96 89.14 16.18 0.25
[ben@lab ~]$ iostat dx
Linux 3.8.4102.fc17.x86_64 (lab.mysqlhome) 04/10/2013 _x86_64_ (2 CPU)
Device: rrqm/s wrqm/s r/s w/s rkB/s wkB/s avgrqsz avgqusz await r_await w_await svctm %util
sda 1.34 2.67 3.32 4.39 81.09 45.42 32.80 0.51 66.40 29.59 94.27 7.77 6.00
dm0 0.00 0.00 3.24 0.82 64.05 5.71 34.38 0.37 91.29 35.84 309.17 4.94 2.00
dm1 0.00 0.00 1.34 5.77 16.53 39.12 15.66 0.31 43.20 32.95 45.58 6.42 4.56
dm2 0.00 0.00 0.05 0.10 0.15 0.58 9.56 0.01 68.75 26.96 89.00 16.21 0.25
10](https://image.slidesharecdn.com/monitoring-linux-io-130425155045-phpapp01/85/Monitoring-IO-performance-with-iostat-and-pt-diskstats-10-320.jpg)
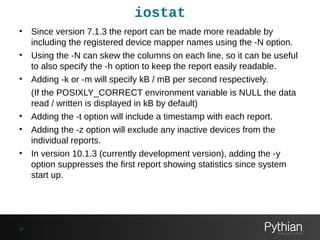
![iostat
• Whilst reviewing the stats since since system start up can be useful,
more often you will want to review current activity.
• Current activity can be displayed by specifying an interval measured
in seconds.
• Output will continue until interrupted or a specified count has been
reached.
[ben@lab ~]$ iostat dx [interval] [count]
[ben@lab ~]$ iostat dx 3
The above command will display extended device statistics since system start up in the first
report, and the deltas for the last 3 seconds in subsequent reports until interrupted.
[ben@lab ~]$ iostat dx 3 3
The above command will display extended device statistics since system start up in the first
report, and the deltas for the last 3 seconds in two further reports.
11](https://image.slidesharecdn.com/monitoring-linux-io-130425155045-phpapp01/85/Monitoring-IO-performance-with-iostat-and-pt-diskstats-11-320.jpg)
![iostat
[ben@lab ~]$ iostat dx 3 3
Linux 3.8.4102.fc17.x86_64 (lab.mysqlhome) 04/10/2013 _x86_64_ (2 CPU)
Device: rrqm/s wrqm/s r/s w/s rkB/s wkB/s avgrqsz avgqusz await r_await w_await svctm %util
sda 1.16 2.66 2.89 4.27 70.37 44.66 32.10 0.46 64.37 29.55 87.96 7.94 5.69
dm0 0.00 0.00 2.80 0.78 55.53 5.23 33.94 0.32 90.12 35.83 286.38 5.03 1.80
dm1 0.00 0.00 1.17 5.68 14.39 38.73 15.50 0.29 42.12 32.81 44.05 6.38 4.37
dm2 0.00 0.00 0.04 0.11 0.13 0.70 10.68 0.01 63.30 26.96 77.34 15.47 0.24
Device: rrqm/s wrqm/s r/s w/s rkB/s wkB/s avgrqsz avgqusz await r_await w_await svctm %util
sda 0.00 4.67 0.00 1.00 0.00 21.33 42.67 0.02 23.33 0.00 23.33 23.33 2.33
dm0 0.00 0.00 0.00 0.00 0.00 0.00 0.00 0.00 0.00 0.00 0.00 0.00 0.00
dm1 0.00 0.00 0.00 5.33 0.00 21.33 8.00 0.03 5.25 0.00 5.25 4.38 2.33
dm2 0.00 0.00 0.00 0.00 0.00 0.00 0.00 0.00 0.00 0.00 0.00 0.00 0.00
Device: rrqm/s wrqm/s r/s w/s rkB/s wkB/s avgrqsz avgqusz await r_await w_await svctm %util
sda 0.00 1.67 0.00 9.00 0.00 41.33 9.19 0.45 50.44 0.00 50.44 6.52 5.87
dm0 0.00 0.00 0.00 0.00 0.00 0.00 0.00 0.00 0.00 0.00 0.00 0.00 0.00
dm1 0.00 0.00 0.00 8.33 0.00 33.33 8.00 0.46 54.92 0.00 54.92 2.52 2.10
dm2 0.00 0.00 0.00 2.00 0.00 8.00 8.00 0.09 45.50 0.00 45.50 18.83 3.77
12](https://image.slidesharecdn.com/monitoring-linux-io-130425155045-phpapp01/85/Monitoring-IO-performance-with-iostat-and-pt-diskstats-12-320.jpg)
![iostat
[ben@lab ~]$ iostat dxNhtz 3 2
Linux 3.8.4102.fc17.x86_64 (lab.mysqlhome) 04/10/2013 _x86_64_ (2 CPU)
04/10/2013 11:37:08 AM
Device: rrqm/s wrqm/s r/s w/s rkB/s wkB/s avgrqsz avgqusz await r_await w_await svctm %util
sda
1.07 2.63 2.67 4.17 65.04 43.60 31.76 0.43 63.17 29.54 84.72 8.06 5.52
vg_proddbalv_root
0.00 0.00 2.59 0.74 51.36 4.94 33.80 0.30 89.51 35.81 276.28 5.09 1.70
vg_proddbalv_home
0.00 0.00 1.08 5.58 13.27 37.93 15.36 0.28 41.32 32.82 42.97 6.39 4.26
vg_proddbalv_tmp
0.00 0.00 0.04 0.11 0.12 0.73 11.04 0.01 60.84 26.96 72.70 15.28 0.23
04/10/2013 11:37:11 AM
Device: rrqm/s wrqm/s r/s w/s rkB/s wkB/s avgrqsz avgqusz await r_await w_await svctm %util
sda
0.00 3.33 0.00 3.33 0.00 34.67 20.80 0.09 28.10 0.00 28.10 16.70 5.57
vg_proddbalv_home
0.00 0.00 0.00 6.00 0.00 34.67 11.56 0.10 16.00 0.00 16.00 9.28 5.57
14
-N (registered device mapper name)
-h (columns stay aligned even with long device names)
-t (timestamp reported with sample)
-z (report only includes active devices for this sample)](https://image.slidesharecdn.com/monitoring-linux-io-130425155045-phpapp01/85/Monitoring-IO-performance-with-iostat-and-pt-diskstats-14-320.jpg)
![iostat
[ben@lab ~]$ iostat V
sysstat version 10.0.5
(C) Sebastien Godard (sysstat <at> orange.fr)
[ben@lab ~]$ iostat dx g MyLVM dm0 dm1 dm2 g Other sda
Linux 3.8.4102.fc17.x86_64 (lab.mysqlhome) 04/10/2013 _x86_64_ (2 CPU)
Device: rrqm/s wrqm/s r/s w/s rkB/s wkB/s avgrqsz avgqusz await r_await w_await svctm %util
dm0 0.00 0.00 2.28 0.76 45.53 4.73 33.15 0.24 80.12 32.12 224.36 5.08 1.54
dm1 0.00 0.00 0.86 5.40 10.57 37.45 15.36 0.25 39.96 32.60 41.13 6.40 4.00
dm2 0.00 0.00 0.03 0.16 0.09 1.02 11.63 0.01 49.64 26.96 54.00 14.57 0.28
MyLVM 0.00 0.00 3.16 6.31 56.19 43.20 20.97 0.50 53.01 32.20 63.44 6.15 1.94
sda 0.83 2.59 2.36 4.07 56.42 43.20 30.96 0.37 57.73 26.67 75.73 8.14 5.24
Other 0.83 2.59 2.36 4.07 56.42 43.20 30.96 0.37 57.73 26.67 75.73 8.14 5.24
[ben@lab ~]$ iostat dxT g MyLVM dm0 dm1 dm2 g Other sda
Linux 3.8.4102.fc17.x86_64 (lab.mysqlhome) 04/10/2013 _x86_64_ (2 CPU)
Device: rrqm/s wrqm/s r/s w/s rkB/s wkB/s avgrqsz avgqusz await r_await w_await svctm %util
MyLVM 0.00 0.00 3.16 6.31 56.18 43.20 20.97 0.50 53.01 32.20 63.44 6.14 1.94
Other 0.83 2.59 2.36 4.08 56.41 43.20 30.96 0.37 57.73 26.67 75.72 8.14 5.24
16](https://image.slidesharecdn.com/monitoring-linux-io-130425155045-phpapp01/85/Monitoring-IO-performance-with-iostat-and-pt-diskstats-16-320.jpg)
![iostat
[ben@lab ~]$ iostat p dx
Linux 3.8.4102.fc17.x86_64 (lab.mysqlhome) 04/10/2013 _x86_64_ (2 CPU)
Device: rrqm/s wrqm/s r/s w/s rkB/s wkB/s avgrqsz avgqusz await r_await w_await svctm %util
sda 5.40 4.94 11.35 9.14 398.26 87.99 47.46 2.33 113.75 56.49 184.87 6.23 12.76
sda1 0.03 0.00 0.23 0.00 0.93 0.00 8.08 0.00 15.88 15.76 60.00 15.87 0.36
sda2 0.02 0.00 0.17 0.00 0.78 0.00 8.93 0.00 10.78 10.78 0.00 10.78 0.19
sda3 5.36 4.94 10.84 8.19 396.12 87.99 50.90 2.29 120.11 58.50 201.69 5.21 9.92
dm0 0.00 0.00 9.89 2.11 311.61 9.37 53.51 2.86 238.35 119.45 796.49 4.74 5.69
dm1 0.00 0.00 6.21 11.34 83.31 78.09 18.39 0.90 51.56 24.04 66.64 5.19 9.10
dm2 0.00 0.00 0.25 0.13 0.94 0.53 7.68 0.01 36.07 27.53 51.99 11.56 0.44
[ben@lab ~]$ iostat p sda dx
Linux 3.8.4102.fc17.x86_64 (lab.mysqlhome) 04/10/2013 _x86_64_ (2 CPU)
Device: rrqm/s wrqm/s r/s w/s rkB/s wkB/s avgrqsz avgqusz await r_await w_await svctm %util
sda 2.68 4.74 6.52 9.47 235.60 90.11 40.73 1.45 90.48 50.74 117.86 6.92 11.07
sda1 0.01 0.00 0.11 0.00 0.45 0.00 8.08 0.00 15.88 15.76 60.00 15.87 0.18
sda2 0.01 0.00 0.08 0.00 0.37 0.00 8.93 0.00 10.78 10.78 0.00 10.78 0.09
sda3 2.66 4.74 6.28 8.40 234.56 90.11 44.23 1.40 95.45 52.19 127.77 5.22 7.67
18](https://image.slidesharecdn.com/monitoring-linux-io-130425155045-phpapp01/85/Monitoring-IO-performance-with-iostat-and-pt-diskstats-18-320.jpg)
![pt-diskstats
• At the time of writing the current stable version of percona toolkit is
version 2.1.1.
• Full documentation of pt-diskstats can be found here:
http://www.percona.com/doc/percona-toolkit/2.1/pt-diskstats.html
• The version of pt-diskstats you have installed can be found with
--version option.
[ben@lab ~]$ ./ptdiskstats version
ptdiskstats 2.2.1
20](https://image.slidesharecdn.com/monitoring-linux-io-130425155045-phpapp01/85/Monitoring-IO-performance-with-iostat-and-pt-diskstats-20-320.jpg)
![pt-diskstats
• By default pt-diskstats produces useful stats reporting current
device activity. Inactive devices are hidden, but subsequently added
if they become active.
• The default invocation shows the statistics for the last interval (which
by default is 1 second), and will continue until interrupted.
• Similar to: iostat -dxy 1
[ben@lab ~]$ ./ptdiskstats
#ts device rd_s rd_avkb rd_mb_s rd_mrg rd_cnc rd_rt wr_s wr_avkb wr_mb_s wr_mrg wr_cnc wr_rt busy in_prg io_s qtime stime
1.0 sda 0.0 0.0 0.0 0% 0.0 0.0 1.0 8.0 0.0 50% 0.0 0.0 4% 1 1.0 5.8 17.5
1.0 sda3 0.0 0.0 0.0 0% 0.0 0.0 1.0 8.0 0.0 50% 0.0 0.0 0% 0 1.0 0.0 0.0
1.0 dm2 0.0 0.0 0.0 0% 0.0 0.0 3.0 4.0 0.0 0% 0.0 0.0 4% 1 3.0 2.9 11.7
1.0 sda 1.0 4.0 0.0 0% 0.1 72.0 13.0 4.0 0.1 32% 0.2 11.1 25% 0 14.0 0.7 12.3
1.0 sda3 1.0 4.0 0.0 0% 0.1 72.0 7.0 7.4 0.1 46% 0.0 1.4 9% 0 8.0 0.0 6.4
1.0 dm1 1.0 4.0 0.0 0% 0.1 72.0 16.0 3.0 0.0 0% 0.1 8.8 21% 0 17.0 0.4 12.1
1.0 dm2 0.0 0.0 0.0 0% 0.0 0.0 0.0 0.0 0.0 0% 0.1 0.0 4% 0 0.0 0.0 0.0
1.0 sda 0.0 0.0 0.0 0% 0.0 0.0 1.0 28.0 0.0 86% 0.0 0.0 4% 1 1.0 0.6 5.0
1.0 sda3 0.0 0.0 0.0 0% 0.0 0.0 1.0 28.0 0.0 86% 0.0 0.0 0% 0 1.0 0.0 0.0
1.0 dm1 0.0 0.0 0.0 0% 0.0 0.0 0.0 0.0 0.0 0% 0.0 0.0 0% 0 0.0 0.0 0.0
1.0 dm2 0.0 0.0 0.0 0% 0.0 0.0 0.0 0.0 0.0 0% 0.0 0.0 0% 0 0.0 0.0 0.0
21](https://image.slidesharecdn.com/monitoring-linux-io-130425155045-phpapp01/85/Monitoring-IO-performance-with-iostat-and-pt-diskstats-21-320.jpg)
![pt-diskstats
• The interval can be adjusted using the --interval option
• The number of samples can be limited using the --iterations option.
• Similar to: iostat -dxy 3 3
[ben@lab ~]$ ./ptdiskstats interval 3 iterations 3
#ts device rd_s rd_avkb rd_mb_s rd_mrg rd_cnc rd_rt wr_s wr_avkb wr_mb_s wr_mrg wr_cnc wr_rt busy in_prg io_s qtime stime
3.0 sda 0.0 0.0 0.0 0% 0.0 0.0 1.3 3.0 0.0 0% 0.0 37.2 4% 0 1.3 9.4 28.2
3.0 sda3 0.0 0.0 0.0 0% 0.0 0.0 1.0 4.0 0.0 0% 0.0 22.7 2% 0 1.0 0.0 22.7
3.0 dm1 0.0 0.0 0.0 0% 0.0 0.0 0.0 0.0 0.0 0% 0.0 0.0 2% 0 0.0 0.0 0.0
3.0 dm2 0.0 0.0 0.0 0% 0.0 0.0 0.7 4.0 0.0 0% 0.0 30.0 2% 0 0.7 0.0 30.0
3.0 sda 0.0 0.0 0.0 0% 0.0 0.0 1.3 6.0 0.0 50% 0.0 10.1 4% 2 1.3 0.7 14.6
3.0 sda3 0.0 0.0 0.0 0% 0.0 0.0 1.0 8.0 0.0 57% 0.0 1.1 1% 1 1.0 0.8 6.3
3.0 dm0 0.0 0.0 0.0 0% 0.0 0.0 0.7 4.0 0.0 0% 0.0 0.0 1% 2 0.7 0.0 18.0
3.0 dm1 0.0 0.0 0.0 0% 0.0 0.0 1.3 4.0 0.0 0% 0.0 0.0 1% 1 1.3 1.8 9.0
3.0 dm2 0.0 0.0 0.0 0% 0.0 0.0 1.0 4.0 0.0 0% 0.0 27.0 3% 0 1.0 0.0 27.0
3.0 sda 0.0 0.0 0.0 0% 0.0 0.0 2.3 3.4 0.0 0% 0.1 43.4 5% 0 2.3 26.4 20.0
3.0 sda3 0.0 0.0 0.0 0% 0.0 0.0 1.7 4.8 0.0 0% 0.1 33.4 3% 0 1.7 12.1 20.6
3.0 dm0 0.0 0.0 0.0 0% 0.0 0.0 0.3 4.0 0.0 0% 0.1 191.0 3% 0 0.3 211.0 92.0
3.0 dm1 0.0 0.0 0.0 0% 0.0 0.0 0.0 0.0 0.0 0% 0.0 0.0 3% 0 0.0 0.0 0.0
3.0 dm2 0.0 0.0 0.0 0% 0.0 0.0 0.7 4.0 0.0 0% 0.0 23.5 2% 0 0.7 0.0 23.5
22](https://image.slidesharecdn.com/monitoring-linux-io-130425155045-phpapp01/85/Monitoring-IO-performance-with-iostat-and-pt-diskstats-22-320.jpg)
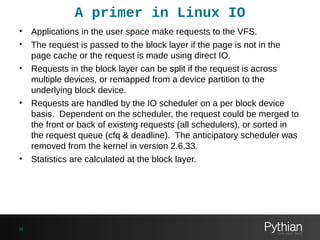

![Block layer disk statistics
• From the 2.6 kernel, statistics are held for all block devices and
partitions in /proc/diskstats.
• /proc/diskstats lists the block devices major number, minor number,
and name as well as a statistic set of 11 counters.
• Prior to 2.6.25 the statistic set of partitions was only made up of 4
counters and the counters weren't consistent with the underlying
block device statistics.
• Statistics are also held for individual devices and partitions in sysfs.
• /sys/block/[dev]/stat holds the statistic set for the device.
• /sys/block/[dev]/[partition]/stat holds the statistic set for the device
partition.
27](https://image.slidesharecdn.com/monitoring-linux-io-130425155045-phpapp01/85/Monitoring-IO-performance-with-iostat-and-pt-diskstats-27-320.jpg)
![/proc/diskstats (2.6.25+)
[ben@lab ~]$ cat /proc/diskstats
7 0 loop0 0 0 0 0 0 0 0 0 0 0 0
7 1 loop1 0 0 0 0 0 0 0 0 0 0 0
7 2 loop2 0 0 0 0 0 0 0 0 0 0 0
7 3 loop3 0 0 0 0 0 0 0 0 0 0 0
7 4 loop4 0 0 0 0 0 0 0 0 0 0 0
7 5 loop5 0 0 0 0 0 0 0 0 0 0 0
7 6 loop6 0 0 0 0 0 0 0 0 0 0 0
7 7 loop7 0 0 0 0 0 0 0 0 0 0 0
8 0 sda 44783 15470 2257302 1210711 85999 54224 1808924 6087675 0 1087763 7298349
8 1 sda1 463 163 4176 6464 2 0 4 1 0 6215 6465
8 2 sda2 267 31 2136 4146 0 0 0 0 0 4053 4146
8 3 sda3 43885 15276 2249646 1197369 73520 54224 1808920 5575620 0 654552 6772954
11 0 sr0 0 0 0 0 0 0 0 0 0 0 0
253 0 dm0 42736 0 1796226 1391325 15414 0 187656 3199366 0 304001 4590697
253 1 dm1 16476 0 449218 530482 113707 0 1572032 4549033 0 838217 5079524
253 2 dm2 574 0 3410 15473 3747 0 49232 185560 0 61399 201034
28](https://image.slidesharecdn.com/monitoring-linux-io-130425155045-phpapp01/85/Monitoring-IO-performance-with-iostat-and-pt-diskstats-28-320.jpg)
![/sys/block/[dev]/stat
[ben@lab ~]$ cat /sys/block/sda/stat
45000 15470 2262294 1214926 90353 56750 1906276 6249938 0 1133119 7464821
[ben@lab ~]$ cat /sys/block/sda/sda1/stat
463 163 4176 6464 2 0 4 1 0 6215 6465
[ben@lab ~]$ cat /sys/block/sda/sda2/stat
267 31 2136 4146 0 0 0 0 0 4053 4146
[ben@lab ~]$ cat /sys/block/sda/sda3/stat
44102 15276 2254638 1201584 77382 56796 1907296 5715314 0 679274 6916857
29](https://image.slidesharecdn.com/monitoring-linux-io-130425155045-phpapp01/85/Monitoring-IO-performance-with-iostat-and-pt-diskstats-29-320.jpg)
![iostat – extended statistics
[ben@lab ~]$ iostat dx 3 3
Linux 3.8.4102.fc17.x86_64 (lab.mysqlhome) 04/10/2013 _x86_64_ (2 CPU)
Device: rrqm/s wrqm/s r/s w/s rkB/s wkB/s avgrqsz avgqusz await r_await w_await svctm %util
sda 1.16 2.66 2.89 4.27 70.37 44.66 32.10 0.46 64.37 29.55 87.96 7.94 5.69
dm0 0.00 0.00 2.80 0.78 55.53 5.23 33.94 0.32 90.12 35.83 286.38 5.03 1.80
dm1 0.00 0.00 1.17 5.68 14.39 38.73 15.50 0.29 42.12 32.81 44.05 6.38 4.37
dm2 0.00 0.00 0.04 0.11 0.13 0.70 10.68 0.01 63.30 26.96 77.34 15.47 0.24
Device: rrqm/s wrqm/s r/s w/s rkB/s wkB/s avgrqsz avgqusz await r_await w_await svctm %util
sda 0.00 4.67 0.00 1.00 0.00 21.33 42.67 0.02 23.33 0.00 23.33 23.33 2.33
dm0 0.00 0.00 0.00 0.00 0.00 0.00 0.00 0.00 0.00 0.00 0.00 0.00 0.00
dm1 0.00 0.00 0.00 5.33 0.00 21.33 8.00 0.03 5.25 0.00 5.25 4.38 2.33
dm2 0.00 0.00 0.00 0.00 0.00 0.00 0.00 0.00 0.00 0.00 0.00 0.00 0.00
Device: rrqm/s wrqm/s r/s w/s rkB/s wkB/s avgrqsz avgqusz await r_await w_await svctm %util
sda 0.00 1.67 0.00 9.00 0.00 41.33 9.19 0.45 50.44 0.00 50.44 6.52 5.87
dm0 0.00 0.00 0.00 0.00 0.00 0.00 0.00 0.00 0.00 0.00 0.00 0.00 0.00
dm1 0.00 0.00 0.00 8.33 0.00 33.33 8.00 0.46 54.92 0.00 54.92 2.52 2.10
dm2 0.00 0.00 0.00 2.00 0.00 8.00 8.00 0.09 45.50 0.00 45.50 18.83 3.77
31](https://image.slidesharecdn.com/monitoring-linux-io-130425155045-phpapp01/85/Monitoring-IO-performance-with-iostat-and-pt-diskstats-31-320.jpg)
![iostat – extended statistics
[ben@lab ~]$ iostat dx 3 3
Linux 3.8.4102.fc17.x86_64 (lab.mysqlhome) 04/10/2013 _x86_64_ (2 CPU)
Device: rrqm/s wrqm/s r/s w/s rkB/s wkB/s avgrqsz avgqusz await r_await w_await svctm %util
sda 1.16 2.66 2.89 4.27 70.37 44.66 32.10 0.46 64.37 29.55 87.96 7.94 5.69
dm0 0.00 0.00 2.80 0.78 55.53 5.23 33.94 0.32 90.12 35.83 286.38 5.03 1.80
dm1 0.00 0.00 1.17 5.68 14.39 38.73 15.50 0.29 42.12 32.81 44.05 6.38 4.37
dm2 0.00 0.00 0.04 0.11 0.13 0.70 10.68 0.01 63.30 26.96 77.34 15.47 0.24
Device: rrqm/s wrqm/s r/s w/s rkB/s wkB/s avgrqsz avgqusz await r_await w_await svctm %util
sda 0.00 4.67 0.00 1.00 0.00 21.33 42.67 0.02 23.33 0.00 23.33 23.33 2.33
dm0 0.00 0.00 0.00 0.00 0.00 0.00 0.00 0.00 0.00 0.00 0.00 0.00 0.00
dm1 0.00 0.00 0.00 5.33 0.00 21.33 8.00 0.03 5.25 0.00 5.25 4.38 2.33
dm2 0.00 0.00 0.00 0.00 0.00 0.00 0.00 0.00 0.00 0.00 0.00 0.00 0.00
Device: rrqm/s wrqm/s r/s w/s rkB/s wkB/s avgrqsz avgqusz await r_await w_await svctm %util
sda 0.00 1.67 0.00 9.00 0.00 41.33 9.19 0.45 50.44 0.00 50.44 6.52 5.87
dm0 0.00 0.00 0.00 0.00 0.00 0.00 0.00 0.00 0.00 0.00 0.00 0.00 0.00
dm1 0.00 0.00 0.00 8.33 0.00 33.33 8.00 0.46 54.92 0.00 54.92 2.52 2.10
dm2 0.00 0.00 0.00 2.00 0.00 8.00 8.00 0.09 45.50 0.00 45.50 18.83 3.77
32](https://image.slidesharecdn.com/monitoring-linux-io-130425155045-phpapp01/85/Monitoring-IO-performance-with-iostat-and-pt-diskstats-32-320.jpg)
![iostat - extended statistics
• rrqm/s (requests)
delta[read_merges(f2)] / interval
• wrqm/s (requests)
delta[write_merges(f6)] / interval
• r/s (requests)
delta[read_IOs(f1)] / interval
• w/s (requests)
delta[write_IOs(f5)] / interval
33](https://image.slidesharecdn.com/monitoring-linux-io-130425155045-phpapp01/85/Monitoring-IO-performance-with-iostat-and-pt-diskstats-33-320.jpg)
![iostat – extended statistics
[ben@lab ~]$ iostat dx 3 3
Linux 3.8.4102.fc17.x86_64 (lab.mysqlhome) 04/10/2013 _x86_64_ (2 CPU)
Device: rrqm/s wrqm/s r/s w/s rkB/s wkB/s avgrqsz avgqusz await r_await w_await svctm %util
sda 1.16 2.66 2.89 4.27 70.37 44.66 32.10 0.46 64.37 29.55 87.96 7.94 5.69
dm0 0.00 0.00 2.80 0.78 55.53 5.23 33.94 0.32 90.12 35.83 286.38 5.03 1.80
dm1 0.00 0.00 1.17 5.68 14.39 38.73 15.50 0.29 42.12 32.81 44.05 6.38 4.37
dm2 0.00 0.00 0.04 0.11 0.13 0.70 10.68 0.01 63.30 26.96 77.34 15.47 0.24
Device: rrqm/s wrqm/s r/s w/s rkB/s wkB/s avgrqsz avgqusz await r_await w_await svctm %util
sda 0.00 4.67 0.00 1.00 0.00 21.33 42.67 0.02 23.33 0.00 23.33 23.33 2.33
dm0 0.00 0.00 0.00 0.00 0.00 0.00 0.00 0.00 0.00 0.00 0.00 0.00 0.00
dm1 0.00 0.00 0.00 5.33 0.00 21.33 8.00 0.03 5.25 0.00 5.25 4.38 2.33
dm2 0.00 0.00 0.00 0.00 0.00 0.00 0.00 0.00 0.00 0.00 0.00 0.00 0.00
Device: rrqm/s wrqm/s r/s w/s rkB/s wkB/s avgrqsz avgqusz await r_await w_await svctm %util
sda 0.00 1.67 0.00 9.00 0.00 41.33 9.19 0.45 50.44 0.00 50.44 6.52 5.87
dm0 0.00 0.00 0.00 0.00 0.00 0.00 0.00 0.00 0.00 0.00 0.00 0.00 0.00
dm1 0.00 0.00 0.00 8.33 0.00 33.33 8.00 0.46 54.92 0.00 54.92 2.52 2.10
dm2 0.00 0.00 0.00 2.00 0.00 8.00 8.00 0.09 45.50 0.00 45.50 18.83 3.77
34](https://image.slidesharecdn.com/monitoring-linux-io-130425155045-phpapp01/85/Monitoring-IO-performance-with-iostat-and-pt-diskstats-34-320.jpg)
![iostat - extended statistics
• rkB/s (sectors|kB|mB)
(delta[read_sectors(f3)] / interval) / conversion factor
• wkB/s (sectors|kB|mB)
(delta[write_sectors(f7)] / interval) / conversion factor
• avgrqsz (sectors)
delta[read_sectors(f3) + write_sectors(f7)] /
delta[read_IOs(f1) + write_IOs(f5)]
(or 0.0 if no IO)
35](https://image.slidesharecdn.com/monitoring-linux-io-130425155045-phpapp01/85/Monitoring-IO-performance-with-iostat-and-pt-diskstats-35-320.jpg)
![iostat – extended statistics
[ben@lab ~]$ iostat dx 3 3
Linux 3.8.4102.fc17.x86_64 (lab.mysqlhome) 04/10/2013 _x86_64_ (2 CPU)
Device: rrqm/s wrqm/s r/s w/s rkB/s wkB/s avgrqsz avgqusz await r_await w_await svctm %util
sda 1.16 2.66 2.89 4.27 70.37 44.66 32.10 0.46 64.37 29.55 87.96 7.94 5.69
dm0 0.00 0.00 2.80 0.78 55.53 5.23 33.94 0.32 90.12 35.83 286.38 5.03 1.80
dm1 0.00 0.00 1.17 5.68 14.39 38.73 15.50 0.29 42.12 32.81 44.05 6.38 4.37
dm2 0.00 0.00 0.04 0.11 0.13 0.70 10.68 0.01 63.30 26.96 77.34 15.47 0.24
Device: rrqm/s wrqm/s r/s w/s rkB/s wkB/s avgrqsz avgqusz await r_await w_await svctm %util
sda 0.00 4.67 0.00 1.00 0.00 21.33 42.67 0.02 23.33 0.00 23.33 23.33 2.33
dm0 0.00 0.00 0.00 0.00 0.00 0.00 0.00 0.00 0.00 0.00 0.00 0.00 0.00
dm1 0.00 0.00 0.00 5.33 0.00 21.33 8.00 0.03 5.25 0.00 5.25 4.38 2.33
dm2 0.00 0.00 0.00 0.00 0.00 0.00 0.00 0.00 0.00 0.00 0.00 0.00 0.00
Device: rrqm/s wrqm/s r/s w/s rkB/s wkB/s avgrqsz avgqusz await r_await w_await svctm %util
sda 0.00 1.67 0.00 9.00 0.00 41.33 9.19 0.45 50.44 0.00 50.44 6.52 5.87
dm0 0.00 0.00 0.00 0.00 0.00 0.00 0.00 0.00 0.00 0.00 0.00 0.00 0.00
dm1 0.00 0.00 0.00 8.33 0.00 33.33 8.00 0.46 54.92 0.00 54.92 2.52 2.10
dm2 0.00 0.00 0.00 2.00 0.00 8.00 8.00 0.09 45.50 0.00 45.50 18.83 3.77
36](https://image.slidesharecdn.com/monitoring-linux-io-130425155045-phpapp01/85/Monitoring-IO-performance-with-iostat-and-pt-diskstats-36-320.jpg)
![iostat - extended statistics
• avgqusz (requests)
(delta[time_in_queue(f11)] / interval) / 1000.0
• await (milliseconds)
delta[read_ticks(f4) + write_ticks(f8)] /
delta[read_IOs(f1) + write_IOs(f5)]
(or 0.0 if no IO)
37](https://image.slidesharecdn.com/monitoring-linux-io-130425155045-phpapp01/85/Monitoring-IO-performance-with-iostat-and-pt-diskstats-37-320.jpg)
![iostat – extended statistics
[ben@lab ~]$ iostat dx 3 3
Linux 3.8.4102.fc17.x86_64 (lab.mysqlhome) 04/10/2013 _x86_64_ (2 CPU)
Device: rrqm/s wrqm/s r/s w/s rkB/s wkB/s avgrqsz avgqusz await r_await w_await svctm %util
sda 1.16 2.66 2.89 4.27 70.37 44.66 32.10 0.46 64.37 29.55 87.96 7.94 5.69
dm0 0.00 0.00 2.80 0.78 55.53 5.23 33.94 0.32 90.12 35.83 286.38 5.03 1.80
dm1 0.00 0.00 1.17 5.68 14.39 38.73 15.50 0.29 42.12 32.81 44.05 6.38 4.37
dm2 0.00 0.00 0.04 0.11 0.13 0.70 10.68 0.01 63.30 26.96 77.34 15.47 0.24
Device: rrqm/s wrqm/s r/s w/s rkB/s wkB/s avgrqsz avgqusz await r_await w_await svctm %util
sda 0.00 4.67 0.00 1.00 0.00 21.33 42.67 0.02 23.33 0.00 23.33 23.33 2.33
dm0 0.00 0.00 0.00 0.00 0.00 0.00 0.00 0.00 0.00 0.00 0.00 0.00 0.00
dm1 0.00 0.00 0.00 5.33 0.00 21.33 8.00 0.03 5.25 0.00 5.25 4.38 2.33
dm2 0.00 0.00 0.00 0.00 0.00 0.00 0.00 0.00 0.00 0.00 0.00 0.00 0.00
Device: rrqm/s wrqm/s r/s w/s rkB/s wkB/s avgrqsz avgqusz await r_await w_await svctm %util
sda 0.00 1.67 0.00 9.00 0.00 41.33 9.19 0.45 50.44 0.00 50.44 6.52 5.87
dm0 0.00 0.00 0.00 0.00 0.00 0.00 0.00 0.00 0.00 0.00 0.00 0.00 0.00
dm1 0.00 0.00 0.00 8.33 0.00 33.33 8.00 0.46 54.92 0.00 54.92 2.52 2.10
dm2 0.00 0.00 0.00 2.00 0.00 8.00 8.00 0.09 45.50 0.00 45.50 18.83 3.77
38](https://image.slidesharecdn.com/monitoring-linux-io-130425155045-phpapp01/85/Monitoring-IO-performance-with-iostat-and-pt-diskstats-38-320.jpg)
![iostat - extended statistics
• r_await (milliseconds)
delta[read_ticks(f4)] / delta[read_IOs(f1)]
(or 0.0 if no read IOs)
• w_await (milliseconds)
delta[write_ticks(f8)] / delta[write_IOs(f5)]
(or 0.0 if no write IOs)
39](https://image.slidesharecdn.com/monitoring-linux-io-130425155045-phpapp01/85/Monitoring-IO-performance-with-iostat-and-pt-diskstats-39-320.jpg)
![iostat – extended statistics
[ben@lab ~]$ iostat dx 3 3
Linux 3.8.4102.fc17.x86_64 (lab.mysqlhome) 04/10/2013 _x86_64_ (2 CPU)
Device: rrqm/s wrqm/s r/s w/s rkB/s wkB/s avgrqsz avgqusz await r_await w_await svctm %util
sda 1.16 2.66 2.89 4.27 70.37 44.66 32.10 0.46 64.37 29.55 87.96 7.94 5.69
dm0 0.00 0.00 2.80 0.78 55.53 5.23 33.94 0.32 90.12 35.83 286.38 5.03 1.80
dm1 0.00 0.00 1.17 5.68 14.39 38.73 15.50 0.29 42.12 32.81 44.05 6.38 4.37
dm2 0.00 0.00 0.04 0.11 0.13 0.70 10.68 0.01 63.30 26.96 77.34 15.47 0.24
Device: rrqm/s wrqm/s r/s w/s rkB/s wkB/s avgrqsz avgqusz await r_await w_await svctm %util
sda 0.00 4.67 0.00 1.00 0.00 21.33 42.67 0.02 23.33 0.00 23.33 23.33 2.33
dm0 0.00 0.00 0.00 0.00 0.00 0.00 0.00 0.00 0.00 0.00 0.00 0.00 0.00
dm1 0.00 0.00 0.00 5.33 0.00 21.33 8.00 0.03 5.25 0.00 5.25 4.38 2.33
dm2 0.00 0.00 0.00 0.00 0.00 0.00 0.00 0.00 0.00 0.00 0.00 0.00 0.00
Device: rrqm/s wrqm/s r/s w/s rkB/s wkB/s avgrqsz avgqusz await r_await w_await svctm %util
sda 0.00 1.67 0.00 9.00 0.00 41.33 9.19 0.45 50.44 0.00 50.44 6.52 5.87
dm0 0.00 0.00 0.00 0.00 0.00 0.00 0.00 0.00 0.00 0.00 0.00 0.00 0.00
dm1 0.00 0.00 0.00 8.33 0.00 33.33 8.00 0.46 54.92 0.00 54.92 2.52 2.10
dm2 0.00 0.00 0.00 2.00 0.00 8.00 8.00 0.09 45.50 0.00 45.50 18.83 3.77
40](https://image.slidesharecdn.com/monitoring-linux-io-130425155045-phpapp01/85/Monitoring-IO-performance-with-iostat-and-pt-diskstats-40-320.jpg)
![iostat - extended statistics
• svctm (milliseconds)
((delta[read_IOs(f1) + write_IOs(f5)] * HZ) / interval) /
(delta[IO_ticks(f10)] / interval)
(or 0.0 if tput = 0)
* HZ = ticks per second, (1000 on most systems).
** This field will be removed in a future sysstat version.
• %util (percent)
((delta[IO_ticks(f10)] / interval) / 10) / devices
* devices = 1 or the number of devices in the group (g
option).
41](https://image.slidesharecdn.com/monitoring-linux-io-130425155045-phpapp01/85/Monitoring-IO-performance-with-iostat-and-pt-diskstats-41-320.jpg)
![pt-diskstats
[ben@lab ~]$ ./ptdiskstats interval 3 iterations 3
#ts device rd_s rd_avkb rd_mb_s rd_mrg rd_cnc rd_rt wr_s wr_avkb wr_mb_s wr_mrg wr_cnc wr_rt busy in_prg io_s qtime stime
3.0 sda 0.0 0.0 0.0 0% 0.0 0.0 1.3 3.0 0.0 0% 0.0 37.2 4% 0 1.3 9.4 28.2
3.0 sda3 0.0 0.0 0.0 0% 0.0 0.0 1.0 4.0 0.0 0% 0.0 22.7 2% 0 1.0 0.0 22.7
3.0 dm1 0.0 0.0 0.0 0% 0.0 0.0 0.0 0.0 0.0 0% 0.0 0.0 2% 0 0.0 0.0 0.0
3.0 dm2 0.0 0.0 0.0 0% 0.0 0.0 0.7 4.0 0.0 0% 0.0 30.0 2% 0 0.7 0.0 30.0
3.0 sda 0.0 0.0 0.0 0% 0.0 0.0 1.3 6.0 0.0 50% 0.0 10.1 4% 2 1.3 0.7 14.6
3.0 sda3 0.0 0.0 0.0 0% 0.0 0.0 1.0 8.0 0.0 57% 0.0 1.1 1% 1 1.0 0.8 6.3
3.0 dm0 0.0 0.0 0.0 0% 0.0 0.0 0.7 4.0 0.0 0% 0.0 0.0 1% 2 0.7 0.0 18.0
3.0 dm1 0.0 0.0 0.0 0% 0.0 0.0 1.3 4.0 0.0 0% 0.0 0.0 1% 1 1.3 1.8 9.0
3.0 dm2 0.0 0.0 0.0 0% 0.0 0.0 1.0 4.0 0.0 0% 0.0 27.0 3% 0 1.0 0.0 27.0
3.0 sda 0.0 0.0 0.0 0% 0.0 0.0 2.3 3.4 0.0 0% 0.1 43.4 5% 0 2.3 26.4 20.0
3.0 sda3 0.0 0.0 0.0 0% 0.0 0.0 1.7 4.8 0.0 0% 0.1 33.4 3% 0 1.7 12.1 20.6
3.0 dm0 0.0 0.0 0.0 0% 0.0 0.0 0.3 4.0 0.0 0% 0.1 191.0 3% 0 0.3 211.0 92.0
3.0 dm1 0.0 0.0 0.0 0% 0.0 0.0 0.0 0.0 0.0 0% 0.0 0.0 3% 0 0.0 0.0 0.0
3.0 dm2 0.0 0.0 0.0 0% 0.0 0.0 0.7 4.0 0.0 0% 0.0 23.5 2% 0 0.7 0.0 23.5
42](https://image.slidesharecdn.com/monitoring-linux-io-130425155045-phpapp01/85/Monitoring-IO-performance-with-iostat-and-pt-diskstats-42-320.jpg)
![pt-diskstats
[ben@lab ~]$ ./ptdiskstats interval 3 iterations 3
#ts device rd_s rd_avkb rd_mb_s rd_mrg rd_cnc rd_rt wr_s wr_avkb wr_mb_s wr_mrg wr_cnc wr_rt busy in_prg io_s qtime stime
3.0 sda 0.0 0.0 0.0 0% 0.0 0.0 1.3 3.0 0.0 0% 0.0 37.2 4% 0 1.3 9.4 28.2
3.0 sda3 0.0 0.0 0.0 0% 0.0 0.0 1.0 4.0 0.0 0% 0.0 22.7 2% 0 1.0 0.0 22.7
3.0 dm1 0.0 0.0 0.0 0% 0.0 0.0 0.0 0.0 0.0 0% 0.0 0.0 2% 0 0.0 0.0 0.0
3.0 dm2 0.0 0.0 0.0 0% 0.0 0.0 0.7 4.0 0.0 0% 0.0 30.0 2% 0 0.7 0.0 30.0
3.0 sda 0.0 0.0 0.0 0% 0.0 0.0 1.3 6.0 0.0 50% 0.0 10.1 4% 2 1.3 0.7 14.6
3.0 sda3 0.0 0.0 0.0 0% 0.0 0.0 1.0 8.0 0.0 57% 0.0 1.1 1% 1 1.0 0.8 6.3
3.0 dm0 0.0 0.0 0.0 0% 0.0 0.0 0.7 4.0 0.0 0% 0.0 0.0 1% 2 0.7 0.0 18.0
3.0 dm1 0.0 0.0 0.0 0% 0.0 0.0 1.3 4.0 0.0 0% 0.0 0.0 1% 1 1.3 1.8 9.0
3.0 dm2 0.0 0.0 0.0 0% 0.0 0.0 1.0 4.0 0.0 0% 0.0 27.0 3% 0 1.0 0.0 27.0
3.0 sda 0.0 0.0 0.0 0% 0.0 0.0 2.3 3.4 0.0 0% 0.1 43.4 5% 0 2.3 26.4 20.0
3.0 sda3 0.0 0.0 0.0 0% 0.0 0.0 1.7 4.8 0.0 0% 0.1 33.4 3% 0 1.7 12.1 20.6
3.0 dm0 0.0 0.0 0.0 0% 0.0 0.0 0.3 4.0 0.0 0% 0.1 191.0 3% 0 0.3 211.0 92.0
3.0 dm1 0.0 0.0 0.0 0% 0.0 0.0 0.0 0.0 0.0 0% 0.0 0.0 3% 0 0.0 0.0 0.0
3.0 dm2 0.0 0.0 0.0 0% 0.0 0.0 0.7 4.0 0.0 0% 0.0 23.5 2% 0 0.7 0.0 23.5
43](https://image.slidesharecdn.com/monitoring-linux-io-130425155045-phpapp01/85/Monitoring-IO-performance-with-iostat-and-pt-diskstats-43-320.jpg)
![pt-diskstats
• rd_s (requests) – Comparable to iostat r/s
delta[read_IOs(f1)] / interval
• rd_avkb (kB) – Similar to iostat avgrqsz but isolates reads
conversion factor * delta[read_sectors(f3)] /
delta[read_IOs(f1)]
(Conversion factor = 2 = documentation bug)
• rd_mb_s (mB) – Comparable to iostat rmB/s
conversion factor * delta[read_sectors(f3)] / interval
(Conversion factor = 2 = documentation bug)
• rd_mrg (percent) – Similar to iostat rrqm/s expressed as %
100 * delta[read_merges(f2)] /
(delta[read_merges(f2)] + delta[read_IOs(f1)])
44](https://image.slidesharecdn.com/monitoring-linux-io-130425155045-phpapp01/85/Monitoring-IO-performance-with-iostat-and-pt-diskstats-44-320.jpg)
![pt-diskstats
[ben@lab ~]$ ./ptdiskstats interval 3 iterations 3
#ts device rd_s rd_avkb rd_mb_s rd_mrg rd_cnc rd_rt wr_s wr_avkb wr_mb_s wr_mrg wr_cnc wr_rt busy in_prg io_s qtime stime
3.0 sda 0.0 0.0 0.0 0% 0.0 0.0 1.3 3.0 0.0 0% 0.0 37.2 4% 0 1.3 9.4 28.2
3.0 sda3 0.0 0.0 0.0 0% 0.0 0.0 1.0 4.0 0.0 0% 0.0 22.7 2% 0 1.0 0.0 22.7
3.0 dm1 0.0 0.0 0.0 0% 0.0 0.0 0.0 0.0 0.0 0% 0.0 0.0 2% 0 0.0 0.0 0.0
3.0 dm2 0.0 0.0 0.0 0% 0.0 0.0 0.7 4.0 0.0 0% 0.0 30.0 2% 0 0.7 0.0 30.0
3.0 sda 0.0 0.0 0.0 0% 0.0 0.0 1.3 6.0 0.0 50% 0.0 10.1 4% 2 1.3 0.7 14.6
3.0 sda3 0.0 0.0 0.0 0% 0.0 0.0 1.0 8.0 0.0 57% 0.0 1.1 1% 1 1.0 0.8 6.3
3.0 dm0 0.0 0.0 0.0 0% 0.0 0.0 0.7 4.0 0.0 0% 0.0 0.0 1% 2 0.7 0.0 18.0
3.0 dm1 0.0 0.0 0.0 0% 0.0 0.0 1.3 4.0 0.0 0% 0.0 0.0 1% 1 1.3 1.8 9.0
3.0 dm2 0.0 0.0 0.0 0% 0.0 0.0 1.0 4.0 0.0 0% 0.0 27.0 3% 0 1.0 0.0 27.0
3.0 sda 0.0 0.0 0.0 0% 0.0 0.0 2.3 3.4 0.0 0% 0.1 43.4 5% 0 2.3 26.4 20.0
3.0 sda3 0.0 0.0 0.0 0% 0.0 0.0 1.7 4.8 0.0 0% 0.1 33.4 3% 0 1.7 12.1 20.6
3.0 dm0 0.0 0.0 0.0 0% 0.0 0.0 0.3 4.0 0.0 0% 0.1 191.0 3% 0 0.3 211.0 92.0
3.0 dm1 0.0 0.0 0.0 0% 0.0 0.0 0.0 0.0 0.0 0% 0.0 0.0 3% 0 0.0 0.0 0.0
3.0 dm2 0.0 0.0 0.0 0% 0.0 0.0 0.7 4.0 0.0 0% 0.0 23.5 2% 0 0.7 0.0 23.5
45](https://image.slidesharecdn.com/monitoring-linux-io-130425155045-phpapp01/85/Monitoring-IO-performance-with-iostat-and-pt-diskstats-45-320.jpg)
![pt-diskstats
• rd_cnc – (Little's law) iostat has no equivalent
delta[read_ticks(f4)] / interval / 1000 / devices in group
• rd_rt (milliseconds) – Differs to iostat r_await
delta[read_ticks(f4)] /
(delta[read_IOs(f1)] + delta[read_merges(f2)])
46](https://image.slidesharecdn.com/monitoring-linux-io-130425155045-phpapp01/85/Monitoring-IO-performance-with-iostat-and-pt-diskstats-46-320.jpg)
![pt-diskstats
[ben@lab ~]$ ./ptdiskstats interval 3 iterations 3
#ts device rd_s rd_avkb rd_mb_s rd_mrg rd_cnc rd_rt wr_s wr_avkb wr_mb_s wr_mrg wr_cnc wr_rt busy in_prg io_s qtime stime
3.0 sda 0.0 0.0 0.0 0% 0.0 0.0 1.3 3.0 0.0 0% 0.0 37.2 4% 0 1.3 9.4 28.2
3.0 sda3 0.0 0.0 0.0 0% 0.0 0.0 1.0 4.0 0.0 0% 0.0 22.7 2% 0 1.0 0.0 22.7
3.0 dm1 0.0 0.0 0.0 0% 0.0 0.0 0.0 0.0 0.0 0% 0.0 0.0 2% 0 0.0 0.0 0.0
3.0 dm2 0.0 0.0 0.0 0% 0.0 0.0 0.7 4.0 0.0 0% 0.0 30.0 2% 0 0.7 0.0 30.0
3.0 sda 0.0 0.0 0.0 0% 0.0 0.0 1.3 6.0 0.0 50% 0.0 10.1 4% 2 1.3 0.7 14.6
3.0 sda3 0.0 0.0 0.0 0% 0.0 0.0 1.0 8.0 0.0 57% 0.0 1.1 1% 1 1.0 0.8 6.3
3.0 dm0 0.0 0.0 0.0 0% 0.0 0.0 0.7 4.0 0.0 0% 0.0 0.0 1% 2 0.7 0.0 18.0
3.0 dm1 0.0 0.0 0.0 0% 0.0 0.0 1.3 4.0 0.0 0% 0.0 0.0 1% 1 1.3 1.8 9.0
3.0 dm2 0.0 0.0 0.0 0% 0.0 0.0 1.0 4.0 0.0 0% 0.0 27.0 3% 0 1.0 0.0 27.0
3.0 sda 0.0 0.0 0.0 0% 0.0 0.0 2.3 3.4 0.0 0% 0.1 43.4 5% 0 2.3 26.4 20.0
3.0 sda3 0.0 0.0 0.0 0% 0.0 0.0 1.7 4.8 0.0 0% 0.1 33.4 3% 0 1.7 12.1 20.6
3.0 dm0 0.0 0.0 0.0 0% 0.0 0.0 0.3 4.0 0.0 0% 0.1 191.0 3% 0 0.3 211.0 92.0
3.0 dm1 0.0 0.0 0.0 0% 0.0 0.0 0.0 0.0 0.0 0% 0.0 0.0 3% 0 0.0 0.0 0.0
3.0 dm2 0.0 0.0 0.0 0% 0.0 0.0 0.7 4.0 0.0 0% 0.0 23.5 2% 0 0.7 0.0 23.5
47](https://image.slidesharecdn.com/monitoring-linux-io-130425155045-phpapp01/85/Monitoring-IO-performance-with-iostat-and-pt-diskstats-47-320.jpg)
![pt-diskstats
• wr_s (requests) – Comparable to iostat w/s
delta[write_IOs(f5)] / interval
• wr_avkb (kB) – Similar to iostat avgrqsz but isolates writes
conversion factor * delta[write_sectors(f7)] /
delta[write_IOs(f5)]
(Conversion factor = 2 = documentation bug)
• wr_mb_s (mB) – Comparable to iostat wmB/s
conversion factor * delta[write_sectors(f7)] / interval
(Conversion factor = 2 = documentation bug)
• wr_mrg (percent) – Similar to iostat wrqm/s expressed as %
100 * delta[write_merges(f6)] /
(delta[write_merges(f6)] + delta[write_IOs(f5)])
48](https://image.slidesharecdn.com/monitoring-linux-io-130425155045-phpapp01/85/Monitoring-IO-performance-with-iostat-and-pt-diskstats-48-320.jpg)
![pt-diskstats
[ben@lab ~]$ ./ptdiskstats interval 3 iterations 3
#ts device rd_s rd_avkb rd_mb_s rd_mrg rd_cnc rd_rt wr_s wr_avkb wr_mb_s wr_mrg wr_cnc wr_rt busy in_prg io_s qtime stime
3.0 sda 0.0 0.0 0.0 0% 0.0 0.0 1.3 3.0 0.0 0% 0.0 37.2 4% 0 1.3 9.4 28.2
3.0 sda3 0.0 0.0 0.0 0% 0.0 0.0 1.0 4.0 0.0 0% 0.0 22.7 2% 0 1.0 0.0 22.7
3.0 dm1 0.0 0.0 0.0 0% 0.0 0.0 0.0 0.0 0.0 0% 0.0 0.0 2% 0 0.0 0.0 0.0
3.0 dm2 0.0 0.0 0.0 0% 0.0 0.0 0.7 4.0 0.0 0% 0.0 30.0 2% 0 0.7 0.0 30.0
3.0 sda 0.0 0.0 0.0 0% 0.0 0.0 1.3 6.0 0.0 50% 0.0 10.1 4% 2 1.3 0.7 14.6
3.0 sda3 0.0 0.0 0.0 0% 0.0 0.0 1.0 8.0 0.0 57% 0.0 1.1 1% 1 1.0 0.8 6.3
3.0 dm0 0.0 0.0 0.0 0% 0.0 0.0 0.7 4.0 0.0 0% 0.0 0.0 1% 2 0.7 0.0 18.0
3.0 dm1 0.0 0.0 0.0 0% 0.0 0.0 1.3 4.0 0.0 0% 0.0 0.0 1% 1 1.3 1.8 9.0
3.0 dm2 0.0 0.0 0.0 0% 0.0 0.0 1.0 4.0 0.0 0% 0.0 27.0 3% 0 1.0 0.0 27.0
3.0 sda 0.0 0.0 0.0 0% 0.0 0.0 2.3 3.4 0.0 0% 0.1 43.4 5% 0 2.3 26.4 20.0
3.0 sda3 0.0 0.0 0.0 0% 0.0 0.0 1.7 4.8 0.0 0% 0.1 33.4 3% 0 1.7 12.1 20.6
3.0 dm0 0.0 0.0 0.0 0% 0.0 0.0 0.3 4.0 0.0 0% 0.1 191.0 3% 0 0.3 211.0 92.0
3.0 dm1 0.0 0.0 0.0 0% 0.0 0.0 0.0 0.0 0.0 0% 0.0 0.0 3% 0 0.0 0.0 0.0
3.0 dm2 0.0 0.0 0.0 0% 0.0 0.0 0.7 4.0 0.0 0% 0.0 23.5 2% 0 0.7 0.0 23.5
49](https://image.slidesharecdn.com/monitoring-linux-io-130425155045-phpapp01/85/Monitoring-IO-performance-with-iostat-and-pt-diskstats-49-320.jpg)
![pt-diskstats
• wr_cnc – (Little's law) iostat has no equivalent
delta[write_ticks(f8)] / interval / 1000 / devices in group
• wr_rt (milliseconds) – Differs to iostat w_await
delta[write_ticks(f8)] /
(delta[write_IOs(f5)] + delta[write_merges(f6)])
50](https://image.slidesharecdn.com/monitoring-linux-io-130425155045-phpapp01/85/Monitoring-IO-performance-with-iostat-and-pt-diskstats-50-320.jpg)
![pt-diskstats
[ben@lab ~]$ ./ptdiskstats interval 3 iterations 3
#ts device rd_s rd_avkb rd_mb_s rd_mrg rd_cnc rd_rt wr_s wr_avkb wr_mb_s wr_mrg wr_cnc wr_rt busy in_prg io_s qtime stime
3.0 sda 0.0 0.0 0.0 0% 0.0 0.0 1.3 3.0 0.0 0% 0.0 37.2 4% 0 1.3 9.4 28.2
3.0 sda3 0.0 0.0 0.0 0% 0.0 0.0 1.0 4.0 0.0 0% 0.0 22.7 2% 0 1.0 0.0 22.7
3.0 dm1 0.0 0.0 0.0 0% 0.0 0.0 0.0 0.0 0.0 0% 0.0 0.0 2% 0 0.0 0.0 0.0
3.0 dm2 0.0 0.0 0.0 0% 0.0 0.0 0.7 4.0 0.0 0% 0.0 30.0 2% 0 0.7 0.0 30.0
3.0 sda 0.0 0.0 0.0 0% 0.0 0.0 1.3 6.0 0.0 50% 0.0 10.1 4% 2 1.3 0.7 14.6
3.0 sda3 0.0 0.0 0.0 0% 0.0 0.0 1.0 8.0 0.0 57% 0.0 1.1 1% 1 1.0 0.8 6.3
3.0 dm0 0.0 0.0 0.0 0% 0.0 0.0 0.7 4.0 0.0 0% 0.0 0.0 1% 2 0.7 0.0 18.0
3.0 dm1 0.0 0.0 0.0 0% 0.0 0.0 1.3 4.0 0.0 0% 0.0 0.0 1% 1 1.3 1.8 9.0
3.0 dm2 0.0 0.0 0.0 0% 0.0 0.0 1.0 4.0 0.0 0% 0.0 27.0 3% 0 1.0 0.0 27.0
3.0 sda 0.0 0.0 0.0 0% 0.0 0.0 2.3 3.4 0.0 0% 0.1 43.4 5% 0 2.3 26.4 20.0
3.0 sda3 0.0 0.0 0.0 0% 0.0 0.0 1.7 4.8 0.0 0% 0.1 33.4 3% 0 1.7 12.1 20.6
3.0 dm0 0.0 0.0 0.0 0% 0.0 0.0 0.3 4.0 0.0 0% 0.1 191.0 3% 0 0.3 211.0 92.0
3.0 dm1 0.0 0.0 0.0 0% 0.0 0.0 0.0 0.0 0.0 0% 0.0 0.0 3% 0 0.0 0.0 0.0
3.0 dm2 0.0 0.0 0.0 0% 0.0 0.0 0.7 4.0 0.0 0% 0.0 23.5 2% 0 0.7 0.0 23.5
51](https://image.slidesharecdn.com/monitoring-linux-io-130425155045-phpapp01/85/Monitoring-IO-performance-with-iostat-and-pt-diskstats-51-320.jpg)
![pt-diskstats
• busy (percent) – Comparable to iostat %util
100 * delta[io_ticks(f10)] / (1000 * interval)
• in_prg (requests) – iostat has no equivalent # BIOs
in_flight(f9)
• ios_s (requests) – Comparable to iostat r/s + w/s
(delta[read IOs(f1)] + delta[write_IOs(f5)]) / interval
52](https://image.slidesharecdn.com/monitoring-linux-io-130425155045-phpapp01/85/Monitoring-IO-performance-with-iostat-and-pt-diskstats-52-320.jpg)
![pt-diskstats
[ben@lab ~]$ ./ptdiskstats interval 3 iterations 3
#ts device rd_s rd_avkb rd_mb_s rd_mrg rd_cnc rd_rt wr_s wr_avkb wr_mb_s wr_mrg wr_cnc wr_rt busy in_prg io_s qtime stime
3.0 sda 0.0 0.0 0.0 0% 0.0 0.0 1.3 3.0 0.0 0% 0.0 37.2 4% 0 1.3 9.4 28.2
3.0 sda3 0.0 0.0 0.0 0% 0.0 0.0 1.0 4.0 0.0 0% 0.0 22.7 2% 0 1.0 0.0 22.7
3.0 dm1 0.0 0.0 0.0 0% 0.0 0.0 0.0 0.0 0.0 0% 0.0 0.0 2% 0 0.0 0.0 0.0
3.0 dm2 0.0 0.0 0.0 0% 0.0 0.0 0.7 4.0 0.0 0% 0.0 30.0 2% 0 0.7 0.0 30.0
3.0 sda 0.0 0.0 0.0 0% 0.0 0.0 1.3 6.0 0.0 50% 0.0 10.1 4% 2 1.3 0.7 14.6
3.0 sda3 0.0 0.0 0.0 0% 0.0 0.0 1.0 8.0 0.0 57% 0.0 1.1 1% 1 1.0 0.8 6.3
3.0 dm0 0.0 0.0 0.0 0% 0.0 0.0 0.7 4.0 0.0 0% 0.0 0.0 1% 2 0.7 0.0 18.0
3.0 dm1 0.0 0.0 0.0 0% 0.0 0.0 1.3 4.0 0.0 0% 0.0 0.0 1% 1 1.3 1.8 9.0
3.0 dm2 0.0 0.0 0.0 0% 0.0 0.0 1.0 4.0 0.0 0% 0.0 27.0 3% 0 1.0 0.0 27.0
3.0 sda 0.0 0.0 0.0 0% 0.0 0.0 2.3 3.4 0.0 0% 0.1 43.4 5% 0 2.3 26.4 20.0
3.0 sda3 0.0 0.0 0.0 0% 0.0 0.0 1.7 4.8 0.0 0% 0.1 33.4 3% 0 1.7 12.1 20.6
3.0 dm0 0.0 0.0 0.0 0% 0.0 0.0 0.3 4.0 0.0 0% 0.1 191.0 3% 0 0.3 211.0 92.0
3.0 dm1 0.0 0.0 0.0 0% 0.0 0.0 0.0 0.0 0.0 0% 0.0 0.0 3% 0 0.0 0.0 0.0
3.0 dm2 0.0 0.0 0.0 0% 0.0 0.0 0.7 4.0 0.0 0% 0.0 23.5 2% 0 0.7 0.0 23.5
53](https://image.slidesharecdn.com/monitoring-linux-io-130425155045-phpapp01/85/Monitoring-IO-performance-with-iostat-and-pt-diskstats-53-320.jpg)
![pt-diskstats
• qtime (milliseconds) – !iostat avgqusz
delta[time_in_queue(f11)] /
(delta[read_IOs(f1) + read_merges(f2) + write_IOs(f5) +
write_merges(f6)] + delta[in_flight(f9)])
delta[io_ticks(f10)] /
(delta[read_IOs(f1) + read_merges(f2) + write_IOs(f5) +
write_merges(f6)])
• stime (milliseconds) – !iostat svctm
delta[io_ticks(f10)] /
(delta[read_IOs(f1) + read_merges(f2) + write_IOs(f5) +
write_merges(f6)])
54](https://image.slidesharecdn.com/monitoring-linux-io-130425155045-phpapp01/85/Monitoring-IO-performance-with-iostat-and-pt-diskstats-54-320.jpg)
![An example using iostat
[ben.mildren@316403db7 ~]$ iostat dx 5
Linux 2.6.18194.17.1.el5 (xxxx) 04/25/2013
....
Device: rrqm/s wrqm/s r/s w/s rkB/s wkB/s avgrqsz avgqusz await r_await w_await svctm %util
sda 0.00 4.60 0.00 16.80 0.00 85.60 10.19 0.06 3.29 0.00 3.29 0.06 0.10
sdb 7607.00 5.20 253.60 23.40 31467.20 114.40 228.03 0.86 3.09 2.93 4.86 2.68 74.10
dm0 0.00 0.00 0.00 0.40 0.00 1.60 8.00 0.00 4.00 0.00 4.00 2.00 0.08
dm1 0.00 0.00 0.00 28.20 0.00 112.80 8.00 0.11 4.07 0.00 4.07 0.04 0.12
dm2 0.00 0.00 374.80 0.00 31441.60 0.00 167.78 0.79 2.11 2.11 0.00 1.98 74.18
dm3 0.00 0.00 7860.40 0.40 31441.60 1.60 8.00 23.21 2.95 2.95 4.00 0.09 74.16
dm4 0.00 0.00 0.00 0.00 0.00 0.00 0.00 0.00 0.00 0.00 0.00 0.00 0.00
....
55](https://image.slidesharecdn.com/monitoring-linux-io-130425155045-phpapp01/85/Monitoring-IO-performance-with-iostat-and-pt-diskstats-55-320.jpg)
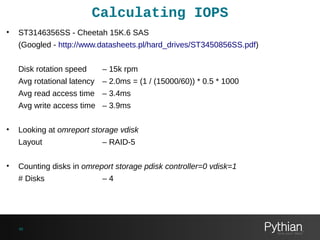
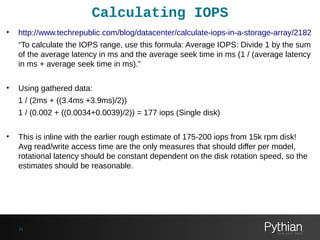
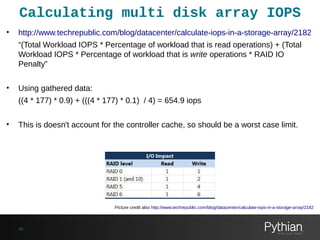
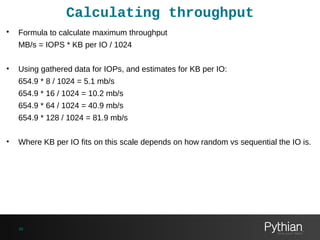
![RAID Controller CLIs
• /dev/sdb is RAID5 SAS HDDs
[root@316402db6 srvadmin]# omreport storage vdisk
List of Virtual Disks in the System
...
ID : 1
Status : Ok
...
Layout : RAID5
Size : 836.63 GB (898319253504 bytes)
Device Name : /dev/sdb
Bus Protocol : SAS
Media : HDD
Read Policy : No Read Ahead
Write Policy : Write Back
...
Stripe Element Size : 64 KB
Disk Cache Policy : Disabled
58](https://image.slidesharecdn.com/monitoring-linux-io-130425155045-phpapp01/85/Monitoring-IO-performance-with-iostat-and-pt-diskstats-58-320.jpg)
![RAID Controller CLIs
• /dev/sdb is RAID5 SAS HDDs
[root@316402db6 srvadmin]# omreport storage pdisk controller=0 vdisk=1
List of Physical Disks on Controller PERC 6/i Integrated (Embedded)
Controller PERC 6/i Integrated (Embedded)
ID : 0:0:2
...
State : Online
Failure Predicted : No
...
Bus Protocol : SAS
Media : HDD
...
Capacity : 136.13 GB (146163105792 bytes)
...
Vendor ID : DELL
Product ID : ST3146356SS
...
59](https://image.slidesharecdn.com/monitoring-linux-io-130425155045-phpapp01/85/Monitoring-IO-performance-with-iostat-and-pt-diskstats-59-320.jpg)
![An example using iostat
[ben.mildren@316403db7 ~]$ iostat dx 5
Linux 2.6.18194.17.1.el5 (xxxx) 04/25/2013
....
Device: rrqm/s wrqm/s r/s w/s rkB/s wkB/s avgrqsz avgqusz await r_await w_await svctm %util
sda 0.00 4.60 0.00 16.80 0.00 85.60 10.19 0.06 3.29 0.00 3.29 0.06 0.10
sdb 7607.00 5.20 253.60 23.40 31467.20 114.40 228.03 0.86 3.09 2.93 4.86 2.68 74.10
dm0 0.00 0.00 0.00 0.40 0.00 1.60 8.00 0.00 4.00 0.00 4.00 2.00 0.08
dm1 0.00 0.00 0.00 28.20 0.00 112.80 8.00 0.11 4.07 0.00 4.07 0.04 0.12
dm2 0.00 0.00 374.80 0.00 31441.60 0.00 167.78 0.79 2.11 2.11 0.00 1.98 74.18
dm3 0.00 0.00 7860.40 0.40 31441.60 1.60 8.00 23.21 2.95 2.95 4.00 0.09 74.16
dm4 0.00 0.00 0.00 0.00 0.00 0.00 0.00 0.00 0.00 0.00 0.00 0.00 0.00
....
Observations:
• ~275 IOPs well below estimated limit of ~650 IOPs
• Average queue size (avgqu-sz) is low.
• At ~30mb/s (rkB/s + wkB/s), throughput will not be saturating the controller,
rearranging the throughput formula we can see IOPs are about 114kb per IO which
leans to a more sequential workload.
• Latency (read/write average wait time) is inline with drive manufacturer
expectations.
64](https://image.slidesharecdn.com/monitoring-linux-io-130425155045-phpapp01/85/Monitoring-IO-performance-with-iostat-and-pt-diskstats-64-320.jpg)
![An example using iostat
[ben.mildren@316403db7 ~]$ iostat dx 5
Linux 2.6.18194.17.1.el5 (xxxx) 04/25/2013
....
Device: rrqm/s wrqm/s r/s w/s rkB/s wkB/s avgrqsz avgqusz await r_await w_await svctm %util
sda 0.00 4.60 0.00 16.80 0.00 85.60 10.19 0.06 3.29 0.00 3.29 0.06 0.10
sdb 7607.00 5.20 253.60 23.40 31467.20 114.40 228.03 0.86 3.09 2.93 4.86 2.68 74.10
dm0 0.00 0.00 0.00 0.40 0.00 1.60 8.00 0.00 4.00 0.00 4.00 2.00 0.08
dm1 0.00 0.00 0.00 28.20 0.00 112.80 8.00 0.11 4.07 0.00 4.07 0.04 0.12
dm2 0.00 0.00 374.80 0.00 31441.60 0.00 167.78 0.79 2.11 2.11 0.00 1.98 74.18
dm3 0.00 0.00 7860.40 0.40 31441.60 1.60 8.00 23.21 2.95 2.95 4.00 0.09 74.16
dm4 0.00 0.00 0.00 0.00 0.00 0.00 0.00 0.00 0.00 0.00 0.00 0.00 0.00
....
Observations:
• Average request size (avgrq-sz) is ~114k (matches throughput calc), so the load is
probably not being generated by MySQL.
• High number of merges, not a bad thing, but might want to investigate why..
(In this case they were caused by an LVM Snapshot being read during a backup).
65](https://image.slidesharecdn.com/monitoring-linux-io-130425155045-phpapp01/85/Monitoring-IO-performance-with-iostat-and-pt-diskstats-65-320.jpg)


iostat is a tool for monitoring input/output performance on Linux systems. It provides reports on CPU utilization and device utilization, including metrics like read/write operations per second, throughput, and latency for block devices. The tool can display statistics since system startup or for a specified time interval, and supports standard or extended output formats to include additional metrics on request and queue lengths and service times.