Download as PDF, PPTX
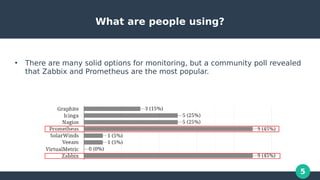
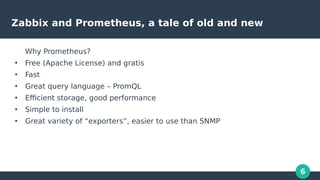
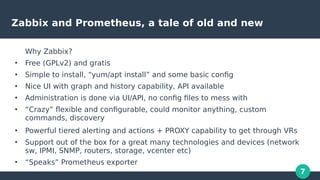
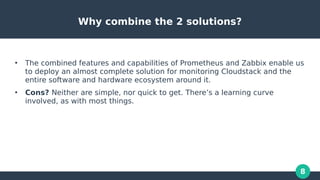
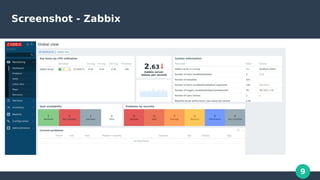
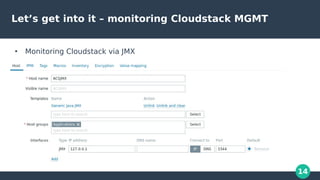
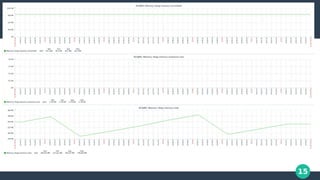

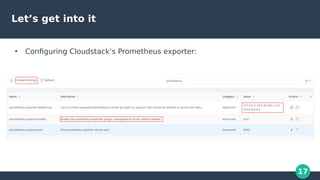
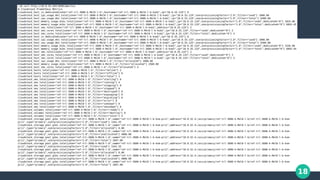
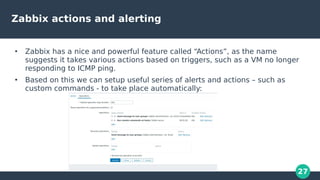
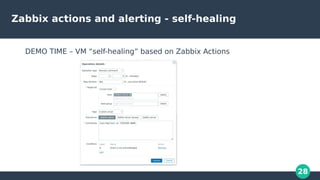

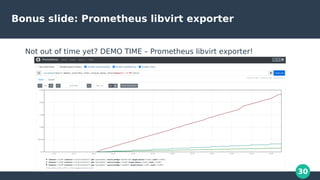

The document discusses monitoring in CloudStack, highlighting the use of Zabbix and Prometheus as popular monitoring solutions. It elaborates on the features, installation, and configuration of both tools for effective monitoring of CloudStack management and virtual machines. The document also emphasizes the benefits of combining Zabbix and Prometheus for a comprehensive monitoring setup, along with practical demonstrations of their implementation.


![[OpenStack] 공개 소프트웨어 오픈스택 입문 & 파헤치기](https://cdn.slidesharecdn.com/ss_thumbnails/opensource-skimmingopenstackwithkoreausergroup-180824144737-thumbnail.jpg?width=640&height=640&fit=bounds)


![[오픈소스컨설팅] Open Stack Ceph, Neutron, HA, Multi-Region](https://cdn.slidesharecdn.com/ss_thumbnails/openstackoscv0-160718105826-thumbnail.jpg?width=640&height=640&fit=bounds)


![[OpenStack Days Korea 2016] Track1 - All flash CEPH 구성 및 최적화](https://cdn.slidesharecdn.com/ss_thumbnails/12skt-160226171513-thumbnail.jpg?width=640&height=640&fit=bounds)