3
New Relic
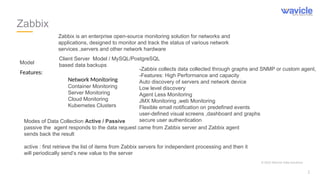
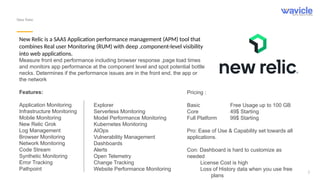
New Relicis a SAAS Application performance management (APM) tool that
combines Real user Monitoring (RUM) with deep ,component-level visibility
into web applications.
Measure front end performance including browser response ,page load times
and monitors app performance at the component level and spot potential bottle
necks. Determines if the performance issues are in the front end, the app or
the network
Features:
Application Monitoring
Infrastructure Monitoring
Mobile Monitoring
New Relic Grok
Log Management
Browser Monitoring
Network Monitoring
Code Stream
Synthetic Monitoring
Error Tracking
Pathpoint
Explorer
Serverless Monitoring
Model Performance Monitoring
Kubernetes Monitoring
AIOps
Vulnerability Management
Dashboards
Alerts
Open Telemetry
Change Tracking
Website Performance Monitoring
Pricing :
Basic Free Usage up to 100 GB
Core 49$ Starting
Full Platform 99$ Starting
Pro: Ease of Use & Capability set towards all
applications.
Con: Dashboard is hard to customize as
needed
License Cost is high
Loss of History data when you use free
plans
4.
4
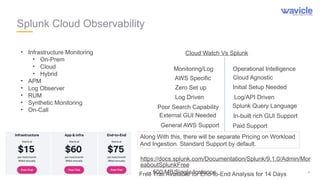
Splunk Cloud Observability
•Infrastructure Monitoring
• On-Prem
• Cloud
• Hybrid
• APM
• Log Observer
• RUM
• Synthetic Monitoring
• On-Call
Cloud Watch Vs Splunk
Monitoring/Log Operational Intelligence
AWS Specific Cloud Agnostic
Zero Set up Initial Setup Needed
Log Driven Log/API Driven
Poor Search Capability Splunk Query Language
External GUI Needed In-built rich GUI Support
General AWS Support Paid Support
Along With this, there will be separate Pricing on Workload
And Ingestion. Standard Support by default.
Free Trail Available for End-to-End Analysis for 14 Days
https://docs.splunk.com/Documentation/Splunk/9.1.0/Admin/Mor
eaboutSplunkFree
. -- 500 MB/Single Instance
5.
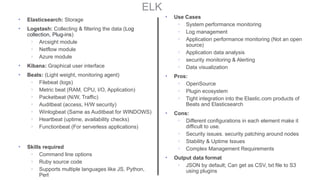
ELK
• Elasticsearch: Storage
•Logstash: Collecting & filtering the data (Log
collection, Plug-ins)
◦ Arcsight module
◦ Netflow module
◦ Azure module
• Kibana: Graphical user interface
• Beats: (Light weight, monitoring agent)
◦ Filebeat (logs)
◦ Metric beat (RAM, CPU, I/O, Application)
◦ Packetbeat (N/W, Traffic)
◦ Auditbeat (access, H/W security)
◦ Winlogbeat (Same as Auditbeat for WINDOWS)
◦ Heartbeat (uptime, availability checks)
◦ Functionbeat (For serverless applications)
• Skills required
◦ Command line options
◦ Ruby source code
◦ Supports multiple languages like JS, Python,
Perl
• Use Cases
◦ System performance monitoring
◦ Log management
◦ Application performance monitoring (Not an open
source)
◦ Application data analysis
◦ security monitoring & Alerting
◦ Data visualization
• Pros:
◦ OpenSource
◦ Plugin ecosystem
◦ Tight integration into the Elastic.com products of
Beats and Elasticsearch
• Cons:
◦ Different configurations in each element make it
difficult to use.
◦ Security issues. security patching around nodes
◦ Stability & Uptime Issues
◦ Complex Management Requirements
• Output data format
◦ JSON by default; Can get as CSV, txt file to S3
using plugins
6.
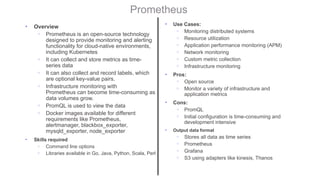
Prometheus
• Overview
◦ Prometheusis an open-source technology
designed to provide monitoring and alerting
functionality for cloud-native environments,
including Kubernetes
◦ It can collect and store metrics as time-
series data
◦ It can also collect and record labels, which
are optional key-value pairs.
◦ Infrastructure monitoring with
Prometheus can become time-consuming as
data volumes grow.
◦ PromQL is used to view the data
◦ Docker images available for different
requirements like Prometheus,
alertmanager, blackbox_exporter,
mysqld_exporter, node_exporter
• Skills required
◦ Command line options
◦ Libraries available in Go, Java, Python, Scala, Perl
• Use Cases:
◦ Monitoring distributed systems
◦ Resource utilization
◦ Application performance monitoring (APM)
◦ Network monitoring
◦ Custom metric collection
◦ Infrastructure monitoring
• Pros:
◦ Open source
◦ Monitor a variety of infrastructure and
application metrics
• Cons:
◦ PromQL
◦ Initial configuration is time-consuming and
development intensive
• Output data format
◦ Stores all data as time series
◦ Prometheus
◦ Grafana
◦ S3 using adapters like kinesis, Thanos