Download to read offline
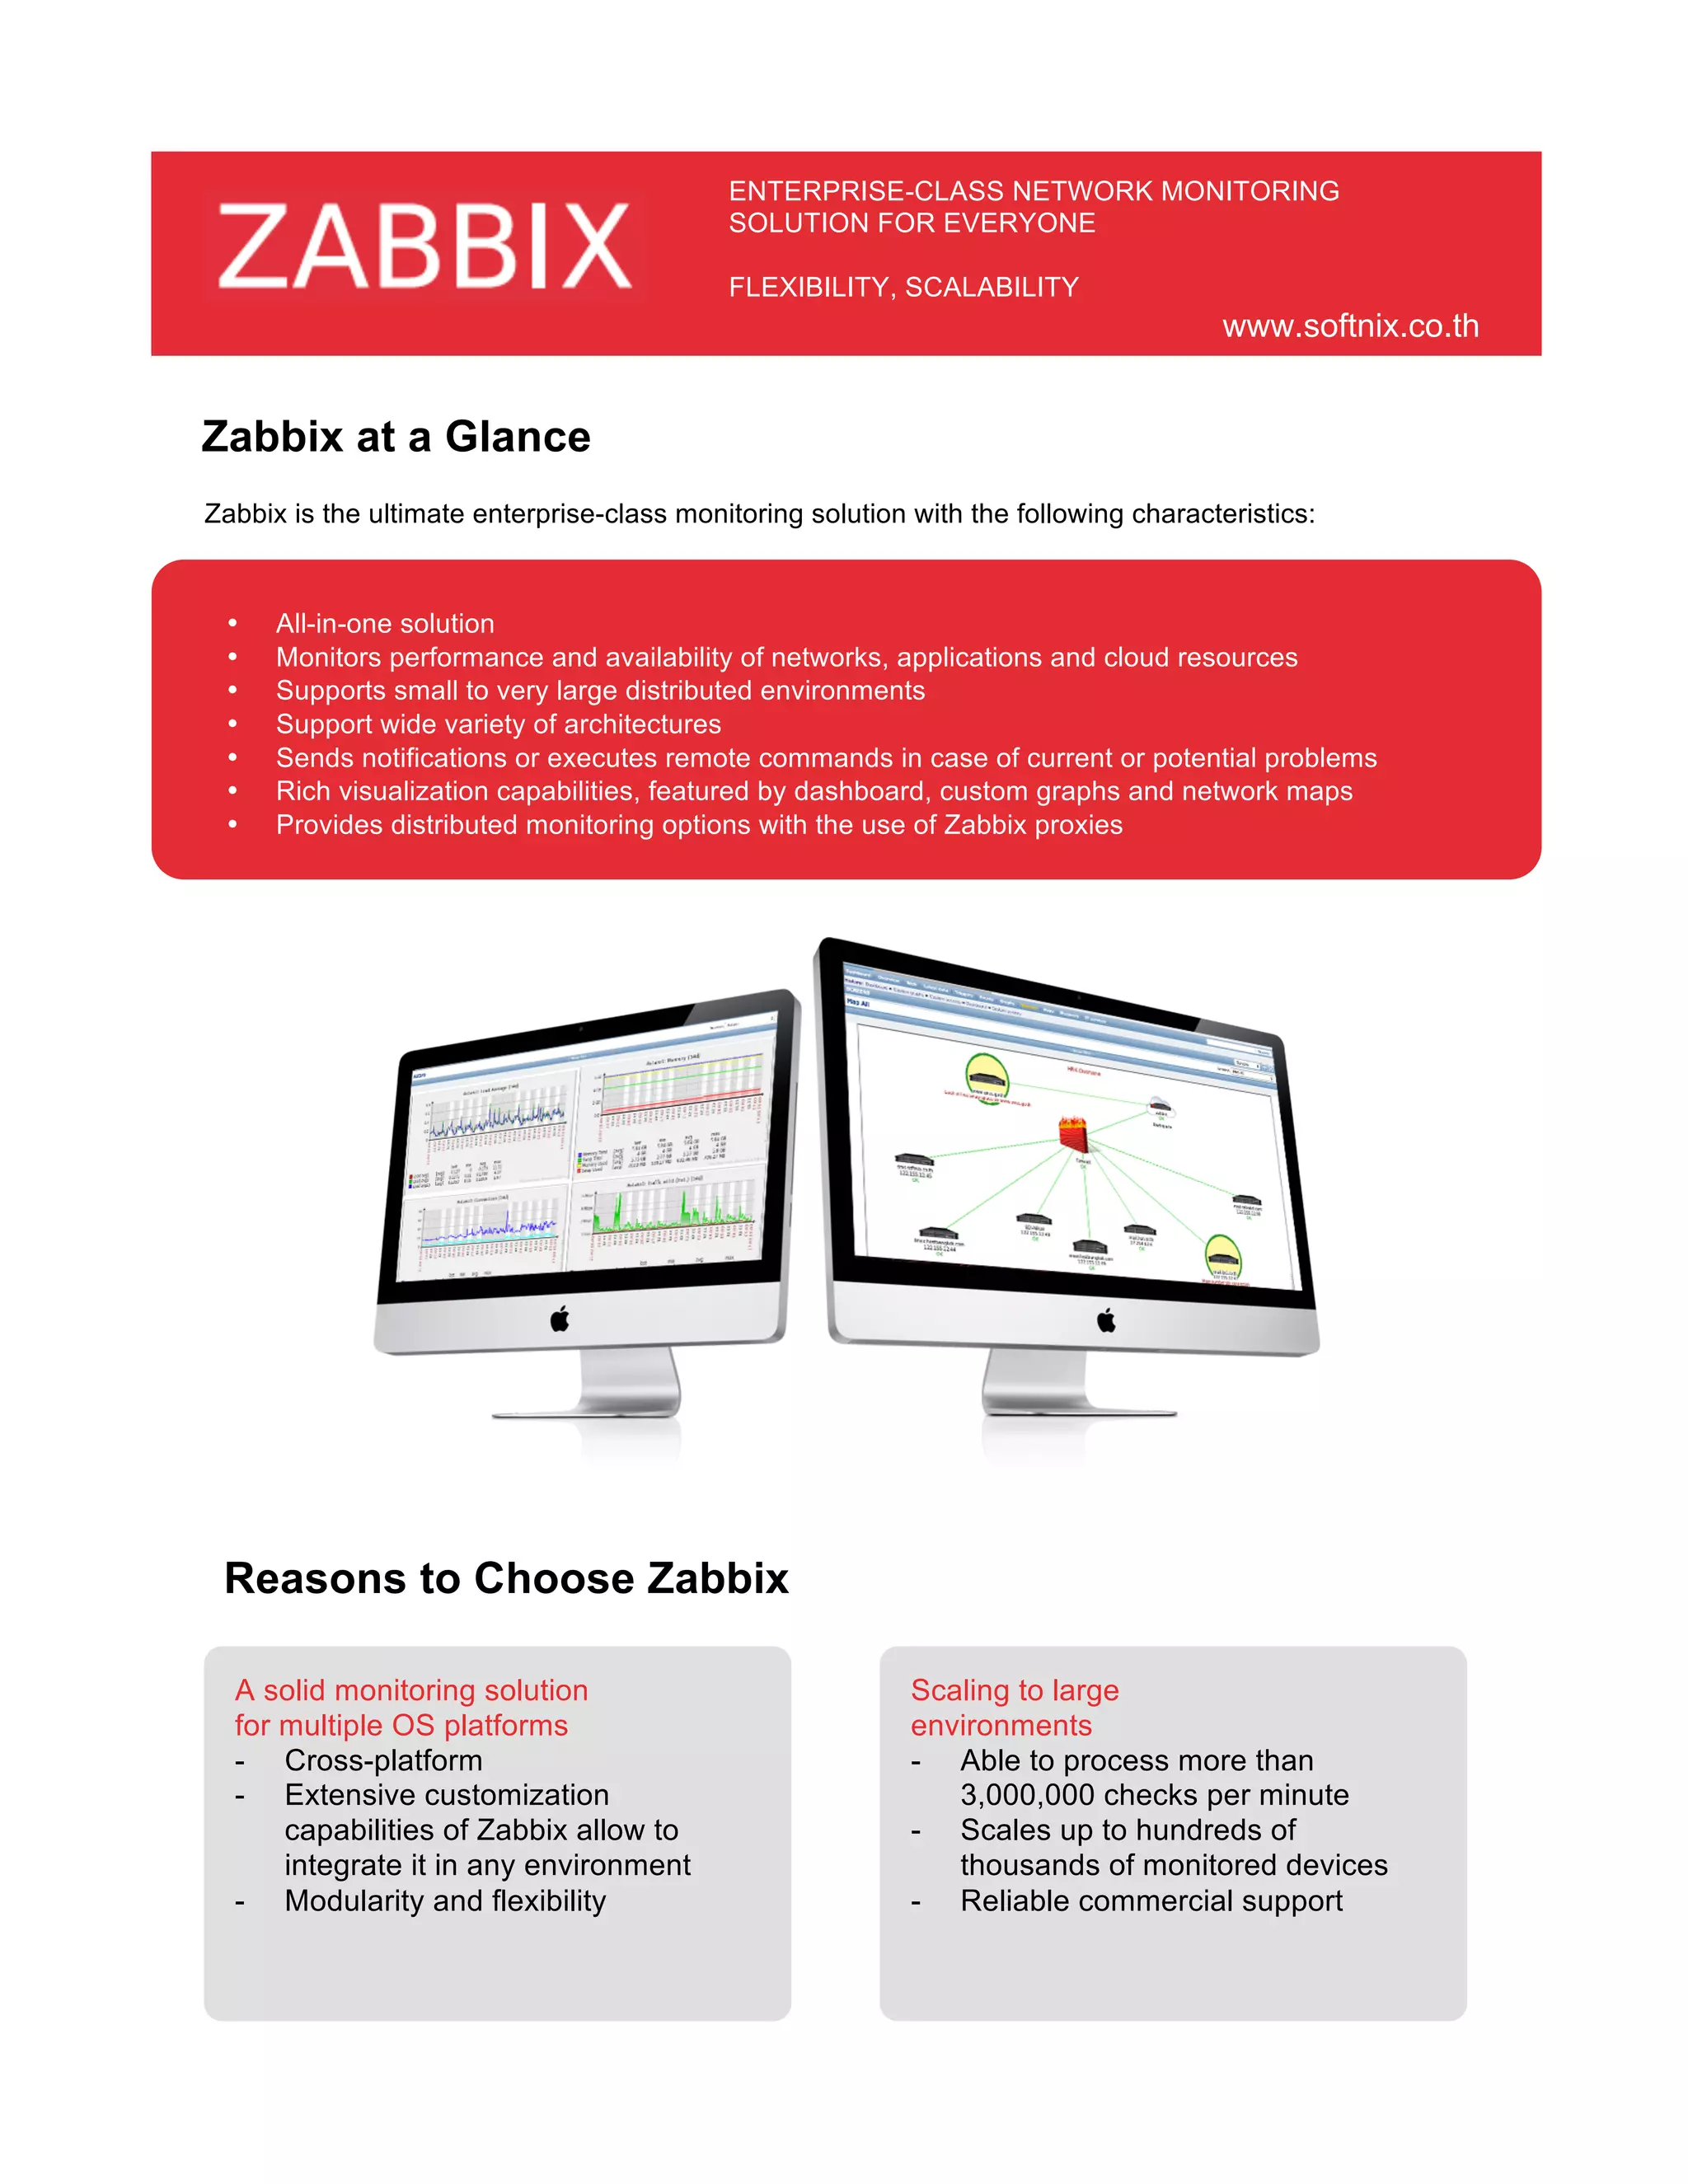

Zabbix is an enterprise-class network monitoring solution that is flexible, scalable, and supports small to very large distributed environments. It monitors performance and availability across networks, applications, and cloud resources. Zabbix provides rich visualization through dashboards, custom graphs, and network maps. It also sends notifications or executes commands if it detects current or potential problems.


![Nagios core vs. nagios xi presentation power point.pptx [diperbaiki]](https://cdn.slidesharecdn.com/ss_thumbnails/nagioscorevs-160911025342-thumbnail.jpg?width=640&height=640&fit=bounds)