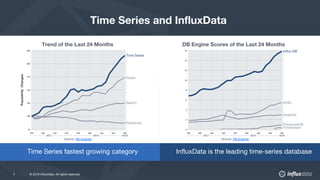
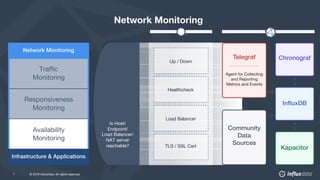
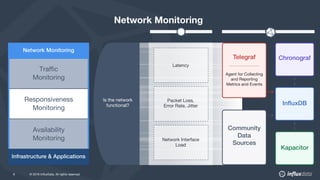
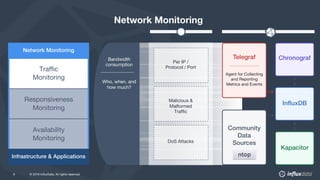
Luca Deri, Founder of ntop
Daniella Pontes, Sr. Product Marketing Mgr at InfluxData
April 2019
Monitoring Containerized
Application Environments
with eBPF
© 2019 InfluxData. All rights reserved.2
The open source time
series database
Real time visibility into stacks,
sensors, and systems
What is
InfluxData?
© 2018 InfluxData. All rights reserved.3 © 2019 InfluxData. All rights reserved.3
At a glance
Founded
Mission
Focus
Difference
Traction
Business Model
2013
San Francisco HQ, 114+FTE’s, 55+ in Technical Functions
Be the Modern Engine for metrics and events
Purpose built Time Series Data Platform
Sensor, Infrastructure and Business Process Monitoring
One foundation platform to monitor and control the physical and virtual world
Purpose built, fastest time to awesome, real actions in real-time
Clear leadership in the fastest growing segment of the database work
~205,698 unique active deployments, 506+ customers
Including: IBM, Cisco, PayPal, SAP, Comcast, Tesla, and Siemens
Open source distribution with closed source economics
Clear and critical monetization
© 2018 InfluxData. All rights reserved.4 © 2019 InfluxData. All rights reserved.4
Time Series and InfluxData
Time Series fastest growing category InfluxData is the leading time-series database
Trend of the Last 24 Months DB Engine Scores of the Last 24 Months
Source: DB-Engines Source: DB-Engines
© 2018 InfluxData. All rights reserved.5 © 2019 InfluxData. All rights reserved.5
Market Drivers
© 2018 InfluxData. All rights reserved.6 © 2019 InfluxData. All rights reserved.6
Age of Instrumentation
Sensorification of the Physical World Instrumentation of the Virtual World
© 2018 InfluxData. All rights reserved.7 © 2019 InfluxData. All rights reserved.7
Traffic
Monitoring
Responsiveness
Monitoring
Availability
Monitoring
Network Monitoring
Up / Down
Is Host/
Endpoint/
Load Balancer/
NAT server
reachable?
Healthcheck
Load Balancer
TLS / SSL Cert
© 2018 InfluxData. All rights reserved.8 © 2019 InfluxData. All rights reserved.8
Traffic
Monitoring
Responsiveness
Monitoring
Availability
Monitoring
Network Monitoring
Latency
Packet Loss,
Error Rate, Jitter
Network Interface
Load
Is the network
functional?
© 2018 InfluxData. All rights reserved.9 © 2019 InfluxData. All rights reserved.9
Traffic
Monitoring
Responsiveness
Monitoring
Availability
Monitoring
Network Monitoring
Per IP /
Protocol / Port
Malicious &
Malformed
Traffic
DoS Attacks
Bandwidth
consumption
Who, when, and
how much?
ntop
© 2019 InfluxData. All rights reserved.10
© 2019 - ntop.org 1
Luca Deri <deri@ntop.org>
@lucaderi

Luca Deri <deri@ntop.org>
@lucaderi

Monitoring Containerised Application
Environments with eBPF
© 2018 InfluxData. All rights reserved.11 © 2019 InfluxData. All rights reserved.11
Right tool, right job
Fast and easy install, unified system of insight with
open source integrations to other frameworks
HA and scalable. Optimized for high write and query
loads, and efficient storage.
Real-time analytics. Correlation of metrics, events and
inner system observation. All monitoring functionalities,
passive & active, supported in one place.
Open Source Easy to start and expand
Performant
No guessing, focus
Purpose-built
Effective
© 2018 InfluxData. All rights reserved.12 © 2019 InfluxData. All rights reserved.12
Resources
Events calendar: https://www.influxdata.com/events/
Ntop Conference Padova (8-9 Maio, 2019):
https://www.ntop.org/ntopconf2019/
Influxdays London (13-14 June, 2019)
https://influxdays.com/
InfluxData Solution Page: Network Performance Monitoring
Tech Papers & Webinars:
Tech Paper: Network Monitoring with InfluxData
Webinar: How to Monitor Your Network with InfluxData
Thank You

Monitoring Containerized Application Environments with eBPF

  • 1.
    Luca Deri, Founderof ntop Daniella Pontes, Sr. Product Marketing Mgr at InfluxData April 2019 Monitoring Containerized Application Environments with eBPF
  • 2.
    © 2019 InfluxData.All rights reserved.2 The open source time series database Real time visibility into stacks, sensors, and systems What is InfluxData?
  • 3.
    © 2018 InfluxData.All rights reserved.3 © 2019 InfluxData. All rights reserved.3 At a glance Founded Mission Focus Difference Traction Business Model 2013 San Francisco HQ, 114+FTE’s, 55+ in Technical Functions Be the Modern Engine for metrics and events Purpose built Time Series Data Platform Sensor, Infrastructure and Business Process Monitoring One foundation platform to monitor and control the physical and virtual world Purpose built, fastest time to awesome, real actions in real-time Clear leadership in the fastest growing segment of the database work ~205,698 unique active deployments, 506+ customers Including: IBM, Cisco, PayPal, SAP, Comcast, Tesla, and Siemens Open source distribution with closed source economics Clear and critical monetization
  • 4.
    © 2018 InfluxData.All rights reserved.4 © 2019 InfluxData. All rights reserved.4 Time Series and InfluxData Time Series fastest growing category InfluxData is the leading time-series database Trend of the Last 24 Months DB Engine Scores of the Last 24 Months Source: DB-Engines Source: DB-Engines
  • 5.
    © 2018 InfluxData.All rights reserved.5 © 2019 InfluxData. All rights reserved.5 Market Drivers
  • 6.
    © 2018 InfluxData.All rights reserved.6 © 2019 InfluxData. All rights reserved.6 Age of Instrumentation Sensorification of the Physical World Instrumentation of the Virtual World
  • 7.
    © 2018 InfluxData.All rights reserved.7 © 2019 InfluxData. All rights reserved.7 Traffic Monitoring Responsiveness Monitoring Availability Monitoring Network Monitoring Up / Down Is Host/ Endpoint/ Load Balancer/ NAT server reachable? Healthcheck Load Balancer TLS / SSL Cert
  • 8.
    © 2018 InfluxData.All rights reserved.8 © 2019 InfluxData. All rights reserved.8 Traffic Monitoring Responsiveness Monitoring Availability Monitoring Network Monitoring Latency Packet Loss, Error Rate, Jitter Network Interface Load Is the network functional?
  • 9.
    © 2018 InfluxData.All rights reserved.9 © 2019 InfluxData. All rights reserved.9 Traffic Monitoring Responsiveness Monitoring Availability Monitoring Network Monitoring Per IP / Protocol / Port Malicious & Malformed Traffic DoS Attacks Bandwidth consumption Who, when, and how much? ntop
  • 10.
    © 2019 InfluxData.All rights reserved.10 © 2019 - ntop.org 1 Luca Deri <deri@ntop.org> @lucaderi
 Luca Deri <deri@ntop.org> @lucaderi
 Monitoring Containerised Application Environments with eBPF
  • 11.
    © 2018 InfluxData.All rights reserved.11 © 2019 InfluxData. All rights reserved.11 Right tool, right job Fast and easy install, unified system of insight with open source integrations to other frameworks HA and scalable. Optimized for high write and query loads, and efficient storage. Real-time analytics. Correlation of metrics, events and inner system observation. All monitoring functionalities, passive & active, supported in one place. Open Source Easy to start and expand Performant No guessing, focus Purpose-built Effective
  • 12.
    © 2018 InfluxData.All rights reserved.12 © 2019 InfluxData. All rights reserved.12 Resources Events calendar: https://www.influxdata.com/events/ Ntop Conference Padova (8-9 Maio, 2019): https://www.ntop.org/ntopconf2019/ Influxdays London (13-14 June, 2019) https://influxdays.com/ InfluxData Solution Page: Network Performance Monitoring Tech Papers & Webinars: Tech Paper: Network Monitoring with InfluxData Webinar: How to Monitor Your Network with InfluxData
  • 13.