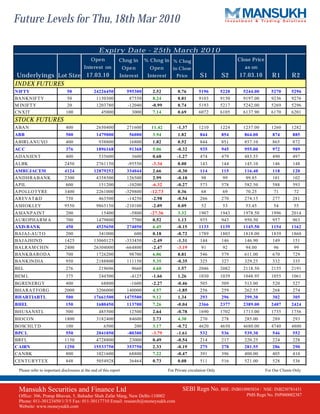
1) The document provides future levels for various indices and stocks for the expiry date of 25th March 2010 based on data as of 17th March 2010. It includes information such as open interest, change in open interest, closing price and support and resistance levels for each stock/index.
2) Many stocks saw an increase in open interest ranging from 0.18% to 16.25%, while some saw a decrease as high as 27.36%. Closing prices for most were near the day's high or low compared to the opening price.
3) Support and resistance levels for the following trading session are provided to analyze where prices of different stocks are likely to find support or encounter resistance.
- The document provides future levels for various indices and stocks for the expiry date of 25th March 2010, including open interest, changes in open interest, and closing prices from 12th March 2010.
- It lists key support and resistance levels (S1, S2, R1, R2) as well as future projections for each underlying.
- Stocks are grouped by sector and show details such as lot size, open interest, percentage changes, and closing prices for monitoring trends in the market.
- The document provides information on future levels for various indices and stocks including the open interest, change in open interest, and closing price as of April 21, 2010.
- Key indices like Nifty were at 5241.10 points with an increase in open interest of 7.58% compared to the previous day. Other indices like Banknifty and Minifity also saw increases in open interest.
- Many stocks saw increases in open interest of over 10% such as ABAN, ABB, APOLLO TYRE, ASIAN PAINTS, AXIS BANK, and HCL TECH among others. Some stocks like ADANIENT saw over 20% increase.
The document provides a summary of future levels for various indices and stocks in India on March 22nd, 2010. It lists the open interest, change in open interest percentage, change in closing price percentage and closing price for each underlying as of that date. Key data points included are the lot size, support and resistance levels, and future ranges for Nifty, Bank Nifty, Mini Nifty and other indices as well as stocks across various sectors.
The document provides a summary of future levels for various indices and stocks for the expiry date of 25th March 2010. It lists the open interest, change in open interest, percentage change in open interest, percentage change in closing price, and support and resistance levels for each underlying. For most stocks, the open interest increased from 19th March 2010 levels, though a few saw a decrease. Closing prices on 19th March also increased for most stocks, while some saw a decrease. The document provides this information to help analyze expected price movements and trading opportunities for the listed underlyings.
The document provides stock and index future levels for various Indian assets as of March 19, 2010. It includes information on the open interest, change in open interest from the previous day, percentage changes, support and resistance levels, and closing prices for each underlying asset. The assets covered include indexes like Nifty, Banknifty, stock futures across various sectors, and commodity futures.
This document provides future levels for various indices and stocks for expiry on June 24, 2010. It includes information such as the open price, change from open price, and close price for each underlying asset. The close prices show most indices and stocks decreased from their open prices, with changes ranging from -20.64% to 21.32%. Support and resistance levels are also provided.
The Report contains detailed information about the current level of stocks and the changes that took place throughout the day.In order to provide a better understanding it provides information about the Index future and Stock future.The report also contains information about the Future level of stocks and it acts as a guide and teacher for its readers so that they can properly plan out their stocks and investment.
The document provides information on future levels for various indices and stocks on April 23rd, 2010, including the open interest, change in open interest from the previous day, percentage change in open interest and closing price, and support and resistance levels. The Nifty index saw an increase in open interest of 6.42% and closed 0.24% higher. Bank Nifty also saw an increase in open interest of 6.58% and closed 0.35% higher. Most other indices and many individual stocks saw increases in open interest and mixed changes in closing price compared to the previous day.
- The document provides information on future levels for various indices and stocks on May 13th 2010, including open interest, changes in open interest and closing prices.
- Key indices like Nifty, Banknifty and CNXIT saw increases in open interest between 0.33-1.17% and closing prices remained relatively stable, increasing 0.33-0.59%.
- Many stocks saw increases in open interest between 1-15% while closing prices for most stocks remained close to the previous day but some saw more significant increases or decreases of up to 2-3%.
The document is a market report that provides key data on futures and options contracts expiring on January 31, 2013 for various stocks and indices. It includes data such as open interest levels as of January 28, current price levels and support and resistance levels for each underlying contract. The report shows changes in open interest levels from the previous day and percentage changes in both open interest and closing prices.
This document provides a summary of key support and resistance levels, as well as changes in open interest and closing prices, for various stock futures contracts trading on the Indian exchanges. It shows that for the period ending February 5, 2013, open interest increased the most for NIFTY (+4.79%) and declined the most for CROMPGREAV (-0.34%). Most contracts closed lower for the day, with declines ranging from -2.11% for HAVELLS to +3.33% for BIOCON. Key support and resistance levels are also provided to watch for potential upside or downside moves in prices over the next few days.
The Report contains detailed information about the current level of stocks and the changes that took place throughout the day.In order to provide a better understanding it provides information about the Index future and Stock future.The report also contains information about the Future level of stocks and it acts as a guide and teacher for its readers so that they can properly plan out their stocks and investment.
The document provides a summary of key support and resistance levels for various stock and index futures contracts trading on Indian commodity exchanges. It lists the open interest, changes in open interest, and closing prices for contracts expiring on August 25, 2011. Support and resistance levels are also given to identify potential price points where demand or supply may come into play. The summary covers over 50 individual stocks and indices like Nifty, Bank Nifty, CNXIT, among others.
The document is a market report providing information on future levels for various indices and stocks in India, including changes in open interest, support and resistance levels, and previous day's closing prices. It summarizes data on Nifty, Bank Nifty, Mini Nifty and other indices, as well as over 100 individual stocks. For each, it lists the lot size, changes in open interest, support and resistance levels, and other key statistics from June 20th, 2011.
The Report contains detailed information about the current level of stocks and the changes that took place throughout the day.In order to provide a better understanding it provides information about the Index future and Stock future.The report also contains information about the Future level of stocks and it acts as a guide and teacher for its readers so that they can properly plan out their stocks and investment.
- The document provides information on future levels for various indices and stocks including the open interest, change in open interest, and closing price as of March 23, 2010.
- It lists data for index futures like Nifty, Banknifty, and CNXIT as well as stock futures for over 50 companies across sectors like banking, oil and gas, pharmaceuticals, automotive, and more.
- For each listing, it provides the lot size, open interest on March 23, change in open interest from the previous day, percentage change in open interest and closing price, along with support and resistance levels.
The Report contains detailed information about the current level of stocks and the changes that took place throughout the day.In order to provide a better understanding it provides information about the Index future and Stock future.The report also contains information about the Future level of stocks and it acts as a guide and teacher for its readers so that they can properly plan out their stocks and investment.
The document is a market report listing future levels for various indices and stocks traded on Indian exchanges. It provides information such as the open interest, change in open interest from the previous day, percentage change in open and closing prices, and support and resistance levels for each underlying asset. The report indicates overall declines in most indices and stocks over the past day, with the Nifty down 1.29% and Banknifty down 1.48%. It lists detailed pricing data and analysis for over 100 individual stocks and indices trading in futures markets in India.
- The document is an analysis of key support and resistance levels for futures and options contracts expiring on September 29, 2011.
- It provides data on changes in open interest and closing prices for various indexes and stocks, as well as support and resistance levels.
- The data shows changes over the period from September 23, 2011 and gives analysts levels to watch as expiration approaches.
1) The document provides key data on futures and options contracts for various stocks and indices expiring on March 28, 2013. It includes data such as open interest, changes in open interest, support and resistance levels, and spot prices for various stocks and indices like Nifty, Bank Nifty, CNXIT and others.
2) Most stocks saw an increase in open interest compared to the previous day, with some seeing a decrease. Support and resistance levels are provided which can be used to identify potential price points.
3) Spot prices on March 11, 2013 closed generally higher than the previous day's close for many stocks, though some closed lower or unchanged.
The document is a listing of future levels for various indices and stocks on the Indian market. It provides information such as the open interest, change in open interest from the previous day, and price levels for the near-term expiry of September 30th, 2010. Key data points listed include the lot size, open price, daily change percentages, support and resistance price levels, and close price as of September 17th, 2010 for dozens of stocks and indices trading in futures contracts on Indian exchanges.
The document provides stock and index future levels for Monday, March 8th 2010. It includes information such as the open interest, change in open interest from the previous day, percentage change in open interest and closing price for various indices and stocks. The levels provided are for contracts expiring on March 25th 2010.
The document is a summary of key support and resistance levels for various stocks and indices in the Indian market as of April 4, 2013. It provides information such as the open interest, change in open interest, support and resistance levels, and previous day's close price for various stocks, indices and their futures contracts. The Nifty, Bank Nifty and CNX IT were among the indices covered. Stocks from various sectors like banking, oil & gas, infrastructure, pharmaceuticals, auto, etc. were also included in the summary.
This document provides a summary of future levels for various stock and index futures contracts expiring on 25th March 2010. It lists the underlying asset, open interest, change in open interest from the previous day, percentage change in open and close price from the previous day's close, and support and resistance levels for each contract. Key information reported includes the 10%+ increase in open interest for Nifty, Minifty and CNXIT index futures, and over 10% increase in open interest for stocks like ABAN, ACC, Ashok Leyland, Biocon, and Hero Honda. Support and resistance levels are also provided for reference.
The Report contains detailed information about the current level of stocks and the changes that took place throughout the day.In order to provide a better understanding it provides information about the Index future and Stock future.The report also contains information about the Future level of stocks and it acts as a guide and teacher for its readers so that they can properly plan out their stocks and investment.
The document provides a summary of futures trading data for various indices and stocks for an expiry date of February 23, 2012. It includes information such as the open interest, changes in open interest, support and resistance levels, and closing prices for different contracts. Overall, the data shows mixed performance across indices and stocks with some seeing an increase in open interest while others saw a decrease.
- The document is a summary of future levels for various indexes and stocks on the Indian market as of March 10, 2010, including open interest, changes from the previous day, and closing prices.
- It provides this data for indexes like Nifty, Banknifty, and stocks across sectors like banking, energy, auto, pharmaceuticals, and more.
- Key statistics included are the expiry date of March 25, 2010, lot sizes for each underlying, open interest, changes in open interest and closing prices from the previous day, and support and resistance price levels.
The Report contains detailed information about the current level of stocks and the changes that took place throughout the day.In order to provide a better understanding it provides information about the Index future and Stock future.The report also contains information about the Future level of stocks and it acts as a guide and teacher for its readers so that they can properly plan out their stocks and investment.
The document provides a summary of future levels for various indices and stocks in the Indian market as of March 9, 2010. It lists the open interest, change in open interest from the previous day, percentage change in open interest and closing price for each underlying. It also provides support and resistance levels S1, S2, R1 and R2 for each underlying.
1) The document provides future levels for various indices and stocks for Friday, May 14th 2010, with expiry on May 27th 2010. It includes information such as the open interest, change in open interest from the previous day, and high, low and closing price levels.
2) Many stocks saw an increase in open interest compared to the previous day, with some major indices and stocks seeing gains of over 10% in open interest.
3) Closing prices on May 13th for most stocks fell within the provided support and resistance levels for the contracts, with some stocks rising or falling more than 1% from the previous close.
The Report contains detailed information about the current level of stocks and the changes that took place throughout the day.In order to provide a better understanding it provides information about the Index future and Stock future.The report also contains information about the Future level of stocks and it acts as a guide and teacher for its readers so that they can properly plan out their stocks and investment.
The document provides stock and index future levels for the Indian market. It includes information such as the underlying asset, lot size, open interest, change in open interest percentage, and support and resistance price levels for each asset. The close prices from September 8, 2010 are also listed. The information is presented in a table format for easy reference.
The document is a market report that provides key support and resistance levels for various stocks and indexes in the Indian market. It summarizes the change in open interest and closing prices from February 1st, 2013 for futures contracts expiring on February 28th, 2013. For each stock or index, it lists the lot size, open interest, change in open interest, support and resistance price levels to watch.
This document provides a summary of key support and resistance levels as well as open interest data for various stock futures contracts expiring on February 28, 2013. Nifty futures saw an increase in open interest of 1,168,250 contracts or 9.71% compared to the previous day, while closing at 6,038.05 points, down 0.48%. Bank Nifty futures open interest rose 10.85% with a closing price down 0.72%. A total of 38 individual stock futures contracts are summarized, with details on open interest changes and support and resistance price levels for each contract.
The document appears to be a listing of future levels for various indices and stocks on the Indian market. It provides information such as the open interest, change in open interest from the previous day, and price changes for various stocks and indices. The table suggests that the overall market was up on the day of September 15th, with the Nifty index rising 0.85% and Bank Nifty rising 0.45%, while some individual stocks showed both gains and losses.
The Report contains detailed information about the current level of stocks and the changes that took place throughout the day.In order to provide a better understanding it provides information about the Index future and Stock future.The report also contains information about the Future level of stocks and it acts as a guide and teacher for its readers so that they can properly plan out their stocks and investment.
The document is a market report on futures and options contracts expiring on November 29, 2012. It provides key data points for various indices and stocks including open interest levels as of November 21st, changes in open interest levels, and support and resistance price levels. Open interest increased the most for BHEL at 21.53% while it decreased the most for Alok Textiles at -7.69%. The report also lists last closing prices on November 21st and provides near term support and resistance price levels for each underlying asset.
The Report contains detailed information about the current level of stocks and the changes that took place throughout the day.In order to provide a better understanding it provides information about the Index future and Stock future.The report also contains information about the Future level of stocks and it acts as a guide and teacher for its readers so that they can properly plan out their stocks and investment.
The document provides stock and index futures information for various Indian companies and indices. It includes details like the open price, change in price from open, closing price ranges and the actual closing price as of 13.09.2010 for various stocks and indices. The information is presented in a tabular format with details like lot size, interest rates and price ranges for the day's trading.
The document is a market report providing information on futures and options trading for various stocks and indices in the Indian market as of February 11, 2013. It includes details such as the open interest, changes in open interest from the previous day, closing price and support and resistance levels for various stocks and indices trading in the market such as Nifty, Bank Nifty, CNXIT and over 50 individual stocks.
The document provides stock market data for various companies in India, including open interest levels, changes in open interest levels, and closing stock prices, as of February 12, 2013. Key data points included are for the Nifty, Bank Nifty, CNXIT indexes as well as over 50 individual stocks across various sectors. Support and resistance levels are also provided for each stock.
Similar to Moneysukh future level report 18/3/2010 (16)
The document provides quarterly financial results for PNB, UCO Bank, and City Union Bank. For PNB, revenue saw a marginal increase for the quarter ended September 2013 while profit declined 52.56%. UCO Bank reported a 5.92% rise in revenue and a remarkable 285.88% increase in net profit for the quarter. City Union Bank's revenue grew 20.48% while net profit growth was modest at 4.89% for the quarter.
The revenue and profits of India Cements declined in the quarter ended September 2013 compared to the same period last year. The net loss for the quarter was Rs. 225.30 million versus a net profit of Rs. 490.80 million last year. Operating profit also decreased from Rs. 2082.30 million to Rs. 1119.00 million.
In contrast, Tech Mahindra saw significant growth in the September 2013 quarter over the corresponding period last year. Total revenue increased 175.64% to Rs. 41562.40 million. Net profit rose sharply by 298.83% to Rs. 6386.40 million. Operating profit also grew from Rs. 2352.80 million to Rs. 8989
The revenue of Indraprastha Gas zoomed 18.11% for the quarter ended September 2013 compared to the same period last year. However, the Net Profit registered a slight decline of 6.51%. Glaxo Consumer Healthcare witnessed an 18.23% growth in revenue but Net Profit grew only 14.3% for the quarter. BHEL's sales declined 14.93% for the quarter while Net Profit fell sharply by 64.22% compared to the corresponding quarter of the previous year. Operating profit also decreased for BHEL.
This document provides key support and resistance levels for various stock indexes and individual stocks along with their open interest, change in open interest, and closing price information as of November 5, 2013. It lists Nifty, Bank Nifty, CNXIT, and various individual stock futures with their lot size, open interest, change in open interest, support levels 1 and 2 (S1 and S2), resistance levels 1 and 2 (R1 and R2), and closing price on November 5.
- Nifty futures closed at 6298.80 on Tuesday, at a premium of 45.65 points over the spot closing of 6253.15. Nifty December 2013 futures ended at a premium of 92.05 points over the spot closing.
- The put call ratio for Nifty options was 1.31, indicating higher open interest in put options. The put call ratio for Bank Nifty options was 0.97.
- For the upcoming session, the market seems bullish. However, 6317 and 6343 could act as crucial resistance levels, while 6210 and 6170 may serve as near-term support levels.
- The document provides key support and resistance levels for various stocks and indices based on their open interest as of October 30, 2013, the day before expiry. It notes the change in open interest and closing price for each underlying from the previous day. Support levels 1 and 2 (S1, S2) and resistance levels 1 and 2 (R1, R2) are given.
- Open interest increased for Nifty futures but decreased for Bank Nifty and CNXIT futures. Several individual stocks saw significant decreases in open interest, including Adani Power, Hindalco, HDIL, and JSW Steel, while open interest grew for IndusInd Bank, HDFC, and Kotak Bank.
-
The Nifty futures closed at 6,255, up 0.5% from the previous day's close. Trading volumes declined across most derivative products. Put call ratios for both Nifty and Bank Nifty options were above 1, indicating greater open interest for put options. The report provides closing prices and open interest figures for various stocks. It also outlines the most actively traded call and put options, and recommends a bearish options strategy for Nifty.
This document provides key support and resistance levels for futures contracts of various stocks trading on Indian exchanges, based on their open interest and closing price on October 29, 2013. It lists over 50 stocks, along with their lot size, open interest, change in open interest from the previous day, support and resistance levels, and closing price. The expiry date for the contracts is October 31, 2013.
The document is a daily derivative report that provides the following key information:
- Nifty futures closed at 6231.10, a premium of 10.20 points over the spot closing of 6220.90. Open interest on Nifty October futures contracted by 1.3 million units to 12.82 million units.
- Several stock futures like Tata Steel, Yes Bank, DLF, and ICICI Bank traded at discounts to their spot closing prices.
- Put call ratios for Nifty and Bank Nifty options were 1.66 and 1.27 respectively, indicating higher put open interest.
- Total futures and options turnover increased 94.24% compared to the previous day, with gains
This document provides key support and resistance levels for various stock futures contracts expiring on October 31, 2013. It lists underlying stocks, their lot size, open interest, change in open interest, percentage change in open interest and closing price from October 28, 2013. It also provides support levels S1 and S2 and resistance levels R1 and R2 for each stock future contract based on technical analysis.
This document provides key support and resistance levels for various stock indexes and futures as of October 25, 2013. It lists underlying assets, their lot size, open interest, changes in open interest, support and resistance levels, and closing prices from the previous day. The expiry date for the futures contracts is October 31, 2013. It contains this information for indexes like Nifty, Bank Nifty, CNXIT and over 50 stock futures.
The document is a daily derivatives report that provides key information on the NIFTY futures market. Some of the key details included in the summary are:
- NIFTY futures closed at 6,141, down 19.45 points (0.32%) from the previous day's close.
- Total futures and options volume declined 21.02% compared to the previous day.
- The put call ratio for Nifty and Bank Nifty options was 1.45 and 1.08 respectively, indicating higher put open interest.
- Most active stock futures like DLF, ITC, Yes Bank and Tata Steel were trading at premiums between 0.25-2.90 points compared to their spot prices
- Nifty futures closed at 6177.00 on Thursday, at a premium of 12.65 points over the spot closing of 6164.35. Nifty November 2013 futures ended at 6227.05, at a premium of 62.70 points over the spot closing.
- Trading volumes increased for index futures (10.78%), index options (10.21%) and decreased for stock futures (-6.60%) and stock options (-11.76%).
- Key support and resistance levels for Nifty are seen at 6105/6032 and 6235/6280 respectively.
This document provides a summary of futures trading data for various stocks and indices for the expiry date of 31st October 2013. It lists the underlying asset, lot size, open interest, change in open interest, support and resistance levels, and closing price from 23rd October 2013. Key details include an overall increase in open interest for Nifty futures of 6.54% and Bank Nifty futures of 4.06%, while open interest decreased for CNXIT futures by 7.9%. Support and resistance levels are provided to indicate possible price movement ranges.
Nifty futures closed lower at 6,178.35 points, down 0.39% from the previous day's close. Trading volumes increased across all derivative segments. Put call ratios for both Nifty and Bank Nifty options were above 1, indicating greater open interest in put options. Most active calls and puts were seen in the 6,100-6,300 strike price range for the October 31 expiry. The report provides an outlook for Nifty, noting key resistance and support levels. It also includes a sample options strategy for Nifty and a tracker of previous strategies.
Nifty futures closed lower at 6,178.35 points, down 0.39% from the previous day's close. Trading volumes increased across all derivative segments. Put call ratios for both Nifty and Bank Nifty options indicate a bearish sentiment. Most active calls and puts were seen in the 6,100-6,300 strike prices for the October 31 expiry. The report provides an outlook for Nifty, noting key resistance and support levels. It also includes the most and least active stocks by change in open interest. Strategies tracked show profits booked from positions in Nifty futures and options.
This document provides key support and resistance levels for various stock indexes and futures as of October 22, 2013. It lists underlying assets, their lot sizes, open interest levels and changes, and support and resistance price levels. The expiry date for futures contracts is October 31, 2013. Overall, open interest increased for many indexes and stocks compared to the previous day.
- The document provides key support and resistance levels for various stocks and indices in the futures and options market. It lists the underlying, lot size, open interest, change in open interest, closing price and support and resistance levels for each stock.
- The highest changes in open interest were seen in Federal Bank (44.72%), IDFC (10.08%), and Cairn India (10.99%) while the largest falls were in HDFCBank (-2.22%) and LIC Housing Finance (-1.49%).
- The expiry date for the futures and options contracts is 31st October 2013.
- The Nifty futures closed at 6236.00 on Monday, a premium of 31.05 points over the spot closing of 6,204.95.
- Put call ratios for Nifty and Bank Nifty options were 1.59 and 1.06 respectively, indicating higher put open interest.
- Total futures and options turnover decreased by 17.43% on Monday compared to the previous day, with index options seeing the largest fall of 19.52%.
More from Mansukh Investment & Trading Solutions (20)
The Role of White Label Bookkeeping Services in Supporting the Growth and Sca...YourLegal Accounting
Effective financial management is important for expansion and scalability in the ever-changing US business environment. White Label Bookkeeping services is an innovative solution that is becoming more and more popular among businesses. These services provide a special method for managing financial duties effectively, freeing up companies to concentrate on their main operations and growth plans. We’ll look at how White Label Bookkeeping can help US firms expand and develop in this blog.
Efficient PHP Development Solutions for Dynamic Web ApplicationsHarwinder Singh
Unlock the full potential of your web projects with our expert PHP development solutions. From robust backend systems to dynamic front-end interfaces, we deliver scalable, secure, and high-performance applications tailored to your needs. Trust our skilled team to transform your ideas into reality with custom PHP programming, ensuring seamless functionality and a superior user experience.
Tired of chasing down expiring contracts and drowning in paperwork? Mastering contract management can significantly enhance your business efficiency and productivity. This guide unveils expert secrets to streamline your contract management process. Learn how to save time, minimize risk, and achieve effortless contract management.
Enhancing Adoption of AI in Agri-food: IntroductionCor Verdouw
Introduction to the Panel on: Pathways and Challenges: AI-Driven Technology in Agri-Food, AI4Food, University of Guelph
“Enhancing Adoption of AI in Agri-food: a Path Forward”, 18 June 2024
❼❷⓿❺❻❷❽❷❼❽ Dpboss Matka Result Satta Matka Guessing Satta Fix jodi Kalyan Final ank Satta Matka Dpbos Final ank Satta Matta Matka 143 Kalyan Matka Guessing Final Matka Final ank Today Matka 420 Satta Batta Satta 143 Kalyan Chart Main Bazar Chart vip Matka Guessing Dpboss 143 Guessing Kalyan night
Adani Group's Active Interest In Increasing Its Presence in the Cement Manufa...Adani case
Time and again, the business group has taken up new business ventures, each of which has allowed it to expand its horizons further and reach new heights. Even amidst the Adani CBI Investigation, the firm has always focused on improving its cement business.
𝐔𝐧𝐯𝐞𝐢𝐥 𝐭𝐡𝐞 𝐅𝐮𝐭𝐮𝐫𝐞 𝐨𝐟 𝐄𝐧𝐞𝐫𝐠𝐲 𝐄𝐟𝐟𝐢𝐜𝐢𝐞𝐧𝐜𝐲 𝐰𝐢𝐭𝐡 𝐍𝐄𝐖𝐍𝐓𝐈𝐃𝐄’𝐬 𝐋𝐚𝐭𝐞𝐬𝐭 𝐎𝐟𝐟𝐞𝐫𝐢𝐧𝐠𝐬
Explore the details in our newly released product manual, which showcases NEWNTIDE's advanced heat pump technologies. Delve into our energy-efficient and eco-friendly solutions tailored for diverse global markets.
Satta matka fixx jodi panna all market dpboss matka guessing fixx panna jodi kalyan and all market game liss cover now 420 matka office mumbai maharashtra india fixx jodi panna
Call me 9040963354
WhatsApp 9040963354
The Most Inspiring Entrepreneurs to Follow in 2024.pdfthesiliconleaders
In a world where the potential of youth innovation remains vastly untouched, there emerges a guiding light in the form of Norm Goldstein, the Founder and CEO of EduNetwork Partners. His dedication to this cause has earned him recognition as a Congressional Leadership Award recipient.
5. Future Levels
Expiry Date - 25th March 2010
Open Chng in % Chng in % Chng Close Price
Interest on Open Open in Close as on
Underlyings Lot Size 17.03.10 Interest Interest Price S1 S2 17.03.10 R1 R2
RELM ED IA 600 1683600 12000 0.72 1.10 219 221 224.30 228 231
REN U K A 5000 40120000 1990000 5.22 -3.85 74 75 76.15 78 80
RN RL 3576 35363064 -200256 -0.56 -1.40 62 62 63.25 65 66
RO LT A 1800 3389400 43200 1.29 -1.06 179 181 182.20 185 187
RPO WER 2000 18992000 36000 0.19 -0.35 140 141 141.45 143 144
S AIL 1350 7450650 641250 9.42 1.58 235 238 241.00 244 247
S BIN 132 3658380 51084 1.42 0.35 2004 2017 2030.05 2044 2057
SCI 2400 1238400 105600 9.32 4.57 150 154 159.15 162 164
SESA G O A 1500 17403000 402000 2.36 0.87 432 436 439.30 444 448
S IEMEN S 752 1026480 -34592 -3.26 0.83 721 730 738.50 746 753
SIN T EX 1400 1230600 50400 4.27 -1.21 259 263 266.00 270 274
S TER 438 5187234 328062 6.75 0.68 816 827 838.70 848 857
ST ERLIN BIO 2500 3462500 40000 1.17 2.49 104 106 108.95 110 112
S UN PHARMA 225 297900 7875 2.72 1.81 1659 1682 1705.55 1724 1742
SU N T V 1000 322000 21000 6.98 -1.25 409 414 420.25 430 440
S UZLO N 3000 64491000 2421000 3.90 -0.99 73 74 74.85 76 78
SYN D IBA N K 3800 2409200 19000 0.79 0.17 86 86 86.30 87 87
T A T A CH EM 1350 1377000 -45900 -3.23 0.27 311 312 313.80 316 319
T A T A CO M M 525 2035425 19950 0.99 0.19 283 285 286.25 288 290
TATAMO TO RS 850 14499300 312800 2.20 -0.72 768 774 780.00 790 801
TATAPO WER 200 2252000 356400 18.80 -0.64 1343 1356 1370.05 1389 1409
TATAS TEEL 764 18458240 1508136 8.90 0.78 621 627 632.00 640 648
T A T A T EA 550 369600 3850 1.05 -0.19 949 953 956.50 963 969
TC S 1000 4898000 95000 1.98 1.38 823 831 839.55 846 853
T ECH M 600 1078200 57000 5.58 0.44 910 916 922.10 933 944
T IT A N 206 191168 -6180 -3.13 0.14 1777 1795 1814.00 1843 1872
T RIVEN I 3850 8096550 1524600 23.20 4.84 120 125 130.00 134 137
TTM L 10450 30284100 2612500 9.44 -0.21 23 24 23.70 24 24
T U LIP 500 269500 57500 27.12 -3.10 869 882 895.00 920 945
T V-18 1825 5546175 -43800 -0.78 -0.74 73 74 74.10 75 76
U CO BA N K 5000 11085000 40000 0.36 -1.05 55 56 56.50 57 58
U LT RA CEM CO 400 626000 -19200 -2.98 -0.95 1076 1091 1105.75 1126 1146
U N IO N BA N K 1050 1898400 -8400 -0.44 1.11 261 263 265.00 268 271
U N IPH O S 1400 932400 -72800 -7.24 0.99 156 157 158.50 160 161
UN ITEC H 4500 65200500 6988500 12.01 -1.92 72 73 73.90 76 77
VID EO IN D 850 1773100 124950 7.58 0.61 226 228 230.40 233 236
VIJA YA BA N K 6900 16560000 -207000 -1.23 -0.52 47 48 47.80 48 49
VO LT A S 2700 1417500 -62100 -4.20 0.15 166 167 168.80 171 174
WELG U J 1600 14468800 403200 2.87 1.18 263 267 270.00 272 274
WIPRO 600 1965000 -10200 -0.52 1.48 726 733 740.90 746 751
YESBA N K 2200 4752000 2200 0.05 0.29 244 245 246.30 248 250
Z EEL 1400 3092600 39200 1.28 0.42 268 270 272.50 276 280
Please refer to important disclosures at the end of this report For Private circulation Only For Our Clients Only
Mansukh Securities and Finance Ltd SEBI Regn No. BSE: INB010985834 / NSE: INB230781431
Office: 306, Pratap Bhavan, 5, Bahadur Shah Zafar Marg, New Delhi-110002 PMS Regn No. INP000002387
Phone: 011-30123450/1/3/5 Fax: 011-30117710 Email: research@moneysukh.com
Website: www.moneysukh.com
6. Future Levels
Research Desk Phone: 011-30211872/73 Email: research@moneysukh.com
NAME DESIGNATION E-MAIL
Varun Gupta Head - Research varungupta@moneysukh.com
Pashupati Nath Jha Research Analyst pashupatinathjha@moneysukh.com
Ajay Lakra Research Analyst ajaylakra@moneysukh.com
Vikram Singh Research Analyst vikram_research@moneysukh.com
This report is for the personal information of the authorized recipient and does not construe to be any investment, legal or taxation advice to you.
Mansukh Securities and Finance Ltd (hereinafter referred as MSFL) is not soliciting any action based on it. This report is not for public distribution
and has been furnished to you solely for your information and should not be reproduced or redistributed to any person in any form.
The report is based upon information that we consider reliable, but we do not represent that it is accurate or complete. MSFL or any of its affiliates
or employees shall not be in any way responsible for any loss or damage that may arise to any person from any inadvertent error in the information
contained in this report. MSFL or any of its affiliates or employees do not provide, at any time, any express or implied warranty of any kind,
regarding any matter pertaining to this report, including without limitation the implied warranties of merchantability, fitness for a particular
purpose, and non-infringement. The recipients of this report should rely on their own investigations.
MSFL and/or its affiliates and/or employees may have interests/positions, financial or otherwise in the securities mentioned in this report. This
information is subject to change without any prior notice. MSFL reserves the right to make modifications and alterations to this statement as may
be required from time to time. Nevertheless, MSFL is committed to providing independent and transparent recommendations to its clients, and
would be happy to provide information in response to specific client queries.
Mansukh Securities and Finance Ltd SEBI Regn No. BSE: INB010985834 / NSE: INB230781431
Office: 306, Pratap Bhavan, 5, Bahadur Shah Zafar Marg, New Delhi-110002 PMS Regn No. INP000002387
Phone: 011-30123450/1/3/5 Fax: 011-30117710 Email: research@moneysukh.com
Website: www.moneysukh.com