Future Level Trading Analysis by Mansukh Investment and Trading Solutions 3/5/2010
•
0 likes•88 views

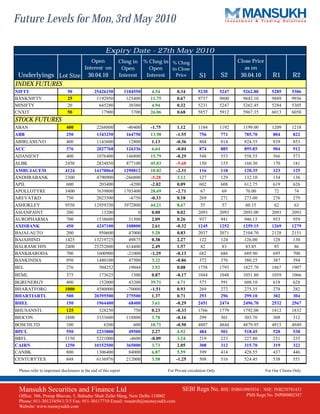
The Report contains detailed information about the current level of stocks and the changes that took place throughout the day.In order to provide a better understanding it provides information about the Index future and Stock future.The report also contains information about the Future level of stocks and it acts as a guide and teacher for its readers so that they can properly plan out their stocks and investment.

Recommended
More Related Content
What's hot
What's hot (20)
Similar to Future Level Trading Analysis by Mansukh Investment and Trading Solutions 3/5/2010
Similar to Future Level Trading Analysis by Mansukh Investment and Trading Solutions 3/5/2010 (20)
More from Mansukh Investment & Trading Solutions
More from Mansukh Investment & Trading Solutions (20)
Recently uploaded
Recently uploaded (20)
Future Level Trading Analysis by Mansukh Investment and Trading Solutions 3/5/2010
- 1. Future Levels for Mon, 3rd May 2010 Expiry Date - 27th May 2010 Open Chng in % Chng in % Chng Close Price Interest on Open Open in Close as on Underlyings Lot Size 30.04.10 Interest Interest Price S1 S2 30.04.10 R1 R2 INDEX FUTURES NIFTY 50 25426150 1104550 4.54 0.34 5230 5247 5262.80 5285 5306 BANKNIFTY 25 1192950 125400 11.75 0.67 9757 9800 9842.10 9889 9936 MINIFTY 20 645280 30380 4.94 0.32 5231 5247 5262.45 5284 5305 CNXIT 50 17900 3700 26.06 0.68 5857 5912 5967.35 6013 6058 STOCK FUTURES ABAN 400 2268800 -40400 -1.75 1.12 1184 1192 1199.00 1209 1218 ABB 250 1343250 164750 13.98 -1.55 756 771 785.70 804 822 ABIRLANUVO 400 1143600 12800 1.13 -0.36 804 814 824.35 839 853 ACC 376 2027768 126336 6.64 -0.04 874 885 895.85 904 912 ADANIENT 400 1076400 146800 15.79 -0.29 548 553 558.55 566 573 ALBK 2450 2824850 877100 45.03 -5.68 150 155 160.30 170 181 AMBUJACEM 4124 14170064 1290812 10.02 -2.31 116 118 120.35 123 125 ANDHRABANK 2300 4790900 -266800 -5.28 3.12 127 129 132.10 134 136 APIL 600 203400 -4200 -2.02 0.09 602 608 612.75 619 626 APOLLOTYRE 3400 7639800 1703400 28.69 -2.71 67 69 70.00 72 74 AREVAT&D 750 2023500 -6750 -0.33 0.18 269 271 273.00 276 279 ASHOKLEY 9550 12959350 3972800 44.21 8.67 55 57 60.15 62 63 ASIANPAINT 200 13200 0 0.00 0.02 2093 2093 2093.00 2093 2093 AUROPHARMA 700 1538600 31500 2.09 0.26 937 941 946.15 953 959 AXISBANK 450 4247100 108000 2.61 -0.32 1245 1252 1259.15 1269 1279 BAJAJ-AUTO 200 950600 47000 5.20 0.83 2037 2071 2104.70 2128 2151 BAJAJHIND 1425 13219725 49875 0.38 2.27 122 124 126.00 128 130 BALRAMCHIN 2400 25252800 614400 2.49 1.57 82 83 83.85 85 86 BANKBARODA 700 1600900 -21000 -1.29 -0.13 682 686 689.90 695 700 BANKINDIA 950 1480100 47500 3.32 -0.86 372 376 380.25 387 394 BEL 276 504252 19044 3.92 0.08 1758 1793 1827.70 1867 1907 BEML 375 173625 1500 0.87 -0.17 1044 1048 1051.80 1059 1066 BGRENERGY 400 152000 43200 39.71 4.71 575 591 608.10 618 628 BHARATFORG 1000 4580000 -70000 -1.51 0.93 269 272 275.35 278 282 BHARTIARTL 500 20395500 275500 1.37 0.71 293 296 299.10 302 304 BHEL 150 1964400 68400 3.61 -0.29 2451 2474 2496.70 2532 2567 BHUSANSTL 125 328250 750 0.23 -0.33 1766 1779 1792.00 1812 1832 BIOCON 1800 3333600 118800 3.70 -0.16 299 301 303.70 308 312 BOSCHLTD 100 6200 600 10.71 -0.50 4807 4844 4879.95 4915 4949 BPCL 550 2233000 49500 2.27 4.92 484 501 518.45 528 538 BRFL 1150 5221000 -4600 -0.09 3.24 219 223 227.80 231 235 CAIRN 1250 10152500 365000 3.73 2.05 308 312 315.70 319 322 CANBK 800 1306400 84000 6.87 5.59 399 414 428.55 437 446 CENTURYTEX 848 6136976 212000 3.58 -1.25 508 516 524.45 538 551 Please refer to important disclosures at the end of this report For Private circulation Only For Our Clients Only Mansukh Securities and Finance Ltd SEBI Regn No. BSE: INB010985834 / NSE: INB230781431 Office: 306, Pratap Bhavan, 5, Bahadur Shah Zafar Marg, New Delhi-110002 PMS Regn No. INP000002387 Phone: 011-30123450/1/3/5 Fax: 011-30117710 Email: research@moneysukh.com Website: www.moneysukh.com
- 2. Future Levels Expiry Date - 27th May 2010 Open Chng in % Chng in % Chng Close Price Interest on Open Open in Close as on Underlyings Lot Size 30.04.10 Interest Interest Price S1 S2 30.04.10 R1 R2 CESC 1100 405900 -28600 -6.58 3.01 392 399 405.95 411 416 CHAMBLFERT 3450 8455950 -100050 -1.17 0.61 64 65 66.00 67 68 CHENNPETRO 1800 743400 50400 7.27 -0.75 275 277 279.70 284 288 CIPLA 1250 5010000 221250 4.62 2.99 333 338 344.05 348 352 COLPAL 550 121550 -3300 -2.64 0.87 734 739 744.15 748 752 CONCOR 250 25750 -1000 -3.74 -0.54 1275 1286 1297.85 1313 1329 CROMPGREAV 1750 1410500 -418250 -22.87 4.03 249 256 263.50 268 272 CUMMINSIND 950 255550 35150 15.95 0.31 551 562 574.10 585 595 DABUR 2700 531900 45900 9.44 -0.08 178 179 181.15 183 184 DCHL 3400 3083800 0 0.00 2.06 147 149 151.30 153 155 DENABANK 5250 6462750 -850500 -11.63 1.60 87 88 88.75 90 91 DISHTV 5150 23365550 597400 2.62 0.84 36 36 36.10 36 37 DIVISLAB 620 676420 35340 5.51 0.29 668 672 675.65 681 687 DLF 800 15036000 340000 2.31 0.50 306 309 311.95 316 319 DRREDDY 400 862000 2800 0.33 2.63 1239 1254 1268.80 1281 1294 EDUCOMP 375 2776125 21000 0.76 1.28 671 677 683.25 691 698 EKC 2000 3654000 288000 8.56 4.65 114 118 121.50 124 127 ESSAROIL 1412 18235980 -48008 -0.26 0.54 138 139 139.95 142 143 FEDERALBNK 851 552299 -7659 -1.37 0.14 288 291 293.30 297 300 FINANTECH 150 975600 20700 2.17 2.02 1530 1549 1567.10 1580 1594 FORTIS 1300 10757500 751400 7.51 5.34 162 167 171.60 175 177 FSL 9500 27293500 -361000 -1.31 3.69 30 30 30.95 31 32 GAIL 1125 3523500 82125 2.39 2.70 414 422 429.15 434 439 GESHIP 1200 681600 141600 26.22 -1.91 320 326 331.25 341 350 GLAXO 300 78300 3000 3.98 1.35 1860 1890 1919.75 1939 1959 GMRINFRA 2500 25030000 585000 2.39 1.06 65 66 67.00 68 69 GODREJIND 1300 834600 119600 16.73 4.76 159 163 167.20 170 173 GRASIM 176 559328 20240 3.75 -1.39 2692 2717 2741.75 2784 2826 GSPL 6100 10321200 231800 2.30 -0.31 94 95 95.80 97 99 GTL 750 6125250 3750 0.06 1.24 395 401 407.20 411 415 GTLINFRA 4850 69539300 48500 0.07 0.73 41 41 41.50 42 42 GTOFFSHORE 500 1161000 -9000 -0.77 -0.12 457 464 470.25 478 486 GVKPIL 4750 23754750 1653000 7.48 0.33 44 45 45.50 46 47 HCC 2100 7478100 115500 1.57 1.78 128 130 131.80 133 135 HCLTECH 1300 2246400 180700 8.75 2.81 375 385 395.15 402 409 HDFC 150 1741950 88500 5.35 -0.42 2770 2793 2817.10 2850 2883 HDFCBANK 200 2474800 256800 11.58 0.72 1972 1984 1996.55 2008 2020 HDIL 774 15003216 -517032 -3.33 1.25 266 268 270.75 274 277 HEROHONDA 200 1535000 19000 1.25 2.69 1814 1847 1878.75 1900 1922 Please refer to important disclosures at the end of this report For Private circulation Only For Our Clients Only Mansukh Securities and Finance Ltd SEBI Regn No. BSE: INB010985834 / NSE: INB230781431 Office: 306, Pratap Bhavan, 5, Bahadur Shah Zafar Marg, New Delhi-110002 PMS Regn No. INP000002387 Phone: 011-30123450/1/3/5 Fax: 011-30117710 Email: research@moneysukh.com Website: www.moneysukh.com
- 3. Future Levels Expiry Date - 27th May 2010 Open Chng in % Chng in % Chng Close Price Interest on Open Open in Close as on Underlyings Lot Size 30.04.10 Interest Interest Price S1 S2 30.04.10 R1 R2 HINDALCO 3518 17976980 1678086 10.30 -0.97 175 177 178.20 180 182 HINDPETRO 650 5469750 238550 4.56 6.80 288 303 316.65 326 334 HINDUNILVR 1000 21558000 387000 1.83 1.82 230 232 234.70 236 238 HINDZINC 250 283500 -15500 -5.18 0.80 1223 1233 1242.75 1250 1258 HOTELEELA 7500 6720000 -225000 -3.24 0.10 49 49 49.55 50 50 IBREALEST 1300 15398500 -332800 -2.12 6.36 157 164 170.50 174 178 ICICIBANK 350 11097450 521500 4.93 0.59 937 943 948.45 957 966 ICSA 1200 4666800 433200 10.23 14.13 116 128 139.70 147 154 IDBI 2400 14428800 1034400 7.72 2.88 121 124 126.85 129 131 IDEA 2700 31033800 629100 2.07 -0.73 59 60 61.00 62 63 IDFC 2950 10271900 162250 1.60 1.15 167 169 170.95 172 174 IFCI 7880 89028240 4743760 5.63 2.79 52 52 53.35 54 55 INDHOTEL 3798 4534812 -174708 -3.71 1.59 107 107 108.30 109 110 INDIACEM 1450 15114800 321900 2.18 -1.76 121 124 125.80 129 132 INDIAINFO 2500 11567500 435000 3.91 0.92 107 108 109.45 111 112 INDIANB 2200 1551000 316800 25.67 2.42 218 222 226.00 230 233 INFOSYSTCH 200 2200600 83600 3.95 0.85 2638 2676 2714.95 2744 2774 IOB 2950 6602100 575250 9.54 0.71 91 92 92.80 94 95 IOC 1200 3481200 -63600 -1.79 6.92 270 283 295.10 302 309 ISPATIND 12450 78298050 2340600 3.08 -0.25 20 20 20.25 21 21 ITC 1125 8627625 243000 2.90 -0.64 263 264 265.65 267 269 IVRCLINFRA 1000 4753000 39000 0.83 0.39 180 181 182.30 184 185 JINDALSAW 1000 14102000 -503000 -3.44 0.25 217 218 218.40 219 220 JINDALSTEL 960 3704640 89280 2.47 -0.32 730 737 742.65 750 758 JISLJALEQS 250 54000 11000 25.58 -1.84 1062 1081 1100.80 1130 1159 JPASSOCIAT 1688 24217736 1007736 4.34 -0.30 145 147 147.85 150 152 JPPOWER 3125 7387500 -9375 -0.13 -0.20 73 74 74.20 75 76 JSWSTEEL 412 5261652 178808 3.52 -0.72 1202 1215 1228.50 1248 1268 KFA 4250 14632750 637500 4.56 2.57 49 50 49.95 50 51 KOTAKBANK 550 2706000 62700 2.37 1.03 728 733 738.65 744 750 KSOILS 5900 12201200 1864400 18.04 -1.62 65 66 66.75 68 70 LICHSGFIN 425 1424175 88400 6.62 1.76 931 944 957.50 969 980 LITL 6380 19778000 -159500 -0.80 0.94 63 63 64.30 65 66 LT 200 2779800 53000 1.94 0.86 1588 1600 1611.70 1624 1637 LUPIN 350 487550 37800 8.40 1.84 1652 1684 1716.90 1741 1766 M&M 624 5093712 124176 2.50 0.75 516 522 528.05 533 538 MARUTI 200 3641600 92600 2.61 -0.88 1258 1268 1278.15 1293 1308 MCDOWELL-N 250 1482500 -126250 -7.85 3.64 1203 1231 1258.90 1276 1293 MCLEODRUSS 900 4292100 181800 4.42 2.86 221 225 229.90 233 236 Please refer to important disclosures at the end of this report For Private circulation Only For Our Clients Only Mansukh Securities and Finance Ltd SEBI Regn No. BSE: INB010985834 / NSE: INB230781431 Office: 306, Pratap Bhavan, 5, Bahadur Shah Zafar Marg, New Delhi-110002 PMS Regn No. INP000002387 Phone: 011-30123450/1/3/5 Fax: 011-30117710 Email: research@moneysukh.com Website: www.moneysukh.com
- 4. Future Levels Expiry Date - 27th May 2010 Open Chng in % Chng in % Chng Close Price Interest on Open Open in Close as on Underlyings Lot Size 30.04.10 Interest Interest Price S1 S2 30.04.10 R1 R2 MLL 4900 10113600 49000 0.49 0.59 59 60 59.90 60 61 MOSERBAER 2475 5845950 -59400 -1.01 1.23 73 74 74.30 75 76 MPHASIS 800 1892000 40800 2.20 3.65 643 663 682.20 694 706 MRPL 4450 6523700 -35600 -0.54 2.20 75 76 76.75 78 79 MTNL 3200 16665600 438400 2.70 0.07 71 71 71.50 72 73 MUNDRAPORT 300 1305600 44700 3.55 -0.26 731 737 742.60 750 757 NAGARCONST 2000 2272000 32000 1.43 1.68 187 189 190.80 193 196 NAGARFERT 5250 18128250 -189000 -1.03 2.82 32 32 32.85 33 34 NATIONALUM 575 1834250 -6325 -0.34 0.74 391 394 397.05 401 406 NEYVELILIG 1475 1783275 -30975 -1.71 0.97 148 150 151.70 153 154 NOIDATOLL 8200 14694400 336200 2.34 0.90 33 34 33.65 34 34 NTPC 1625 17405375 -250250 -1.42 1.49 203 205 207.20 209 210 OFSS 300 430200 900 0.21 0.05 2151 2160 2170.20 2186 2203 ONGC 225 2443950 -78975 -3.13 0.60 1027 1040 1053.20 1063 1073 ONMOBILE 550 459800 31350 7.32 -0.73 373 380 386.10 397 407 OPTOCIRCUI 2040 1283160 93840 7.89 -0.04 222 224 225.95 229 232 ORCHIDCHEM 2100 5609100 48300 0.87 0.70 154 156 158.65 161 163 ORIENTBANK 1200 992400 76800 8.39 1.48 348 350 352.55 355 357 PANTALOONR 850 1465400 -8500 -0.58 0.70 409 413 417.45 421 425 PATELENG 500 471500 47500 11.20 -0.65 451 456 460.30 467 473 PATNI 1300 577200 102700 21.64 0.31 519 529 538.30 545 551 PETRONET 4400 4923600 -70400 -1.41 2.78 78 80 81.25 82 84 PFC 1200 386400 37200 10.65 -1.80 264 267 270.45 275 281 PIRHEALTH 500 6956000 216500 3.21 -0.81 524 532 538.95 547 554 PNB 300 1740300 105000 6.42 0.61 1020 1030 1039.60 1049 1058 POLARIS 2800 1918000 123200 6.86 0.03 183 184 185.50 188 190 POWERGRID 1925 9236150 86625 0.95 -0.05 109 109 109.95 111 112 PRAJIND 2200 6892600 644600 10.32 3.35 93 95 97.10 99 101 PTC 2350 2234850 16450 0.74 0.84 113 114 114.50 115 116 PUNJLLOYD 1500 15940500 99000 0.62 0.82 163 164 165.85 168 170 RANBAXY 800 4001600 211200 5.57 1.42 438 442 445.70 450 455 RCOM 700 19058200 780500 4.27 -0.75 161 163 164.45 168 171 RECLTD 1950 3601650 516750 16.75 -1.49 252 253 255.10 258 261 RELCAPITAL 276 6853632 58512 0.86 1.30 727 734 742.05 751 761 RELIANCE 300 13670700 277200 2.07 -0.37 1017 1024 1030.25 1040 1050 RELINFRA 276 5364612 220800 4.29 1.19 1108 1125 1141.85 1161 1181 RELMEDIA 600 2374800 4800 0.20 0.84 208 210 211.30 214 216 RENUKA 5000 60165000 1855000 3.18 1.47 61 61 62.05 63 64 Please refer to important disclosures at the end of this report For Private circulation Only For Our Clients Only Mansukh Securities and Finance Ltd SEBI Regn No. BSE: INB010985834 / NSE: INB230781431 Office: 306, Pratap Bhavan, 5, Bahadur Shah Zafar Marg, New Delhi-110002 PMS Regn No. INP000002387 Phone: 011-30123450/1/3/5 Fax: 011-30117710 Email: research@moneysukh.com Website: www.moneysukh.com
- 5. Future Levels Expiry Date - 27th May 2010 Open Chng in % Chng in % Chng Close Price Interest on Open Open in Close as on Underlyings Lot Size 30.04.10 Interest Interest Price S1 S2 30.04.10 R1 R2 RNRL 3576 44199360 2614056 6.29 3.76 66 68 70.45 72 74 ROLTA 1800 2183400 -61200 -2.73 2.05 182 186 189.15 192 194 RPOWER 2000 19370000 -98000 -0.50 -0.82 161 162 163.20 165 167 SAIL 1350 7206300 534600 8.01 -1.33 213 216 219.00 223 228 SBIN 132 2870604 348612 13.82 1.17 2255 2276 2298.00 2319 2341 SCI 2400 878400 -86400 -8.96 0.30 163 164 164.85 166 168 SESAGOA 500 19426000 824500 4.43 -0.29 416 420 422.65 427 432 SIEMENS 752 1098672 84224 8.30 1.16 692 701 711.00 718 725 SINTEX 1400 1101800 124600 12.75 -1.08 315 320 325.90 332 339 STER 438 5436456 -25842 -0.47 0.30 819 823 827.40 833 839 STERLINBIO 2500 2460000 -45000 -1.80 5.23 108 111 114.65 117 120 SUNPHARMA 225 610875 -8550 -1.38 -1.31 1542 1558 1574.25 1599 1623 SUNTV 500 141000 5000 3.68 0.47 420 422 423.85 426 428 SUZLON 3000 83484000 1353000 1.65 1.54 68 69 69.30 70 71 SYNDIBANK 3800 2736000 171000 6.67 0.27 92 93 93.65 95 97 TATACHEM 1350 1119150 140400 14.34 2.32 344 350 355.40 360 364 TATACOMM 525 2311050 19425 0.85 -0.02 268 270 271.50 274 276 TATAMOTORS 850 10602050 994500 10.35 3.13 835 852 869.20 882 894 TATAPOWER 200 1423600 53000 3.87 0.07 1339 1349 1359.45 1371 1383 TATASTEEL 764 19464428 1752616 9.90 -2.10 598 609 619.10 636 653 TATATEA 550 359700 12100 3.48 3.83 991 1024 1057.35 1081 1105 TCS 500 7909500 258500 3.38 0.52 761 764 768.05 773 779 TECHM 600 2369400 52200 2.25 0.67 765 772 778.35 785 791 TITAN 206 244110 19776 8.82 0.80 2111 2124 2136.90 2155 2173 TRIVENI 3850 6853000 269500 4.09 3.81 108 111 112.95 115 117 TTML 10450 30127350 794200 2.71 0.86 23 23 23.40 24 24 TULIP 250 200750 -750 -0.37 1.22 836 840 843.65 848 852 TV-18 1825 5086275 -34675 -0.68 1.46 82 82 83.25 84 85 UCOBANK 5000 9505000 -165000 -1.71 -1.63 67 68 69.30 71 73 ULTRACEMCO 400 1060800 114400 12.09 -4.17 933 956 979.50 1014 1048 UNIONBANK 1050 1265250 33600 2.73 -1.45 306 309 312.35 317 322 UNIPHOS 1400 2773400 -152600 -5.22 13.93 143 156 169.30 176 183 UNITECH 4500 47745000 -2524500 -5.02 2.59 83 84 85.30 86 87 VIDEOIND 854 3985618 314272 8.56 1.67 230 232 234.45 236 238 VIJAYABANK 6900 15014400 289800 1.97 1.23 52 53 53.65 54 55 VOLTAS 2700 1965600 91800 4.90 0.94 179 180 181.80 184 186 WELGUJ 1600 18036800 -228800 -1.25 0.93 269 271 271.95 273 275 WIPRO 600 2844600 387600 15.78 -2.20 658 666 674.55 689 704 YESBANK 2200 4518800 288200 6.81 -1.73 279 283 287.65 294 300 ZEEL 1400 3460800 -149800 -4.15 1.55 294 299 304.70 308 311 Note: Stocks in Blue are Nifty-50 scrips, OI & Price > 3% is in Green, OI & Price < 3% is in Red else in Black. Cells in Yellow indicates revision of Lot Size Please refer to important disclosures at the end of this report For Private circulation Only For Our Clients Only Mansukh Securities and Finance Ltd SEBI Regn No. BSE: INB010985834 / NSE: INB230781431 Office: 306, Pratap Bhavan, 5, Bahadur Shah Zafar Marg, New Delhi-110002 PMS Regn No. INP000002387 Phone: 011-30123450/1/3/5 Fax: 011-30117710 Email: research@moneysukh.com Website: www.moneysukh.com
- 6. Future Levels Research Desk Phone: 011-30211872/73 Email: research@moneysukh.com NAME DESIGNATION E-MAIL Varun Gupta Head - Research varungupta@moneysukh.com Pashupati Nath Jha Research Analyst pashupatinathjha@moneysukh.com Ajay Lakra Research Analyst ajaylakra@moneysukh.com Vikram Singh Research Analyst vikram_research@moneysukh.com This report is for the personal information of the authorized recipient and does not construe to be any investment, legal or taxation advice to you. Mansukh Securities and Finance Ltd (hereinafter referred as MSFL) is not soliciting any action based on it. This report is not for public distribution and has been furnished to you solely for your information and should not be reproduced or redistributed to any person in any form. The report is based upon information that we consider reliable, but we do not represent that it is accurate or complete. MSFL or any of its affiliates or employees shall not be in any way responsible for any loss or damage that may arise to any person from any inadvertent error in the information contained in this report. MSFL or any of its affiliates or employees do not provide, at any time, any express or implied warranty of any kind, regarding any matter pertaining to this report, including without limitation the implied warranties of merchantability, fitness for a particular purpose, and non-infringement. The recipients of this report should rely on their own investigations. MSFL and/or its affiliates and/or employees may have interests/positions, financial or otherwise in the securities mentioned in this report. This information is subject to change without any prior notice. MSFL reserves the right to make modifications and alterations to this statement as may be required from time to time. Nevertheless, MSFL is committed to providing independent and transparent recommendations to its clients, and would be happy to provide information in response to specific client queries. Mansukh Securities and Finance Ltd SEBI Regn No. BSE: INB010985834 / NSE: INB230781431 Office: 306, Pratap Bhavan, 5, Bahadur Shah Zafar Marg, New Delhi-110002 PMS Regn No. INP000002387 Phone: 011-30123450/1/3/5 Fax: 011-30117710 Email: research@moneysukh.com Website: www.moneysukh.com