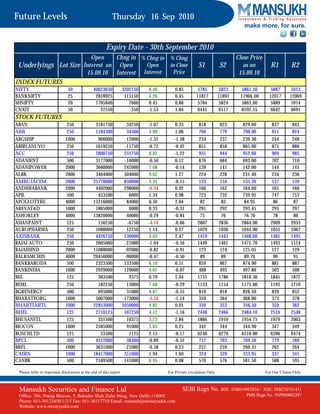
The document appears to be a listing of future levels for various indices and stocks on the Indian market. It provides information such as the open interest, change in open interest from the previous day, and price changes for various stocks and indices. The table suggests that the overall market was up on the day of September 15th, with the Nifty index rising 0.85% and Bank Nifty rising 0.45%, while some individual stocks showed both gains and losses.
The document is a listing of future levels for various indices and stocks on the Indian market. It provides information such as the open interest, change in open interest from the previous day, and price levels for the near-term expiry of September 30th, 2010. Key data points listed include the lot size, open price, daily change percentages, support and resistance price levels, and close price as of September 17th, 2010 for dozens of stocks and indices trading in futures contracts on Indian exchanges.
The Report contains detailed information about the current level of stocks and the changes that took place throughout the day.In order to provide a better understanding it provides information about the Index future and Stock future.The report also contains information about the Future level of stocks and it acts as a guide and teacher for its readers so that they can properly plan out their stocks and investment.
The document provides stock and index future levels for the Indian market. It includes information such as the underlying asset, lot size, open interest, change in open interest percentage, and support and resistance price levels for each asset. The close prices from September 8, 2010 are also listed. The information is presented in a table format for easy reference.
The document provides a summary of key support and resistance levels for various stock and index futures contracts trading on Indian commodity exchanges. It lists the open interest, changes in open interest, and closing prices for contracts expiring on August 25, 2011. Support and resistance levels are also given to identify potential price points where demand or supply may come into play. The summary covers over 50 individual stocks and indices like Nifty, Bank Nifty, CNXIT, among others.
The document provides stock and index futures information for various Indian companies and indices. It includes details like the open price, change in price from open, closing price ranges and the actual closing price as of 13.09.2010 for various stocks and indices. The information is presented in a tabular format with details like lot size, interest rates and price ranges for the day's trading.
- The document provides future levels for various indices and stocks for the expiry date of 25th March 2010, including open interest, changes in open interest, and closing prices from 12th March 2010.
- It lists key support and resistance levels (S1, S2, R1, R2) as well as future projections for each underlying.
- Stocks are grouped by sector and show details such as lot size, open interest, percentage changes, and closing prices for monitoring trends in the market.
This document provides future levels for various indices and stocks for expiry on June 24, 2010. It includes information such as the open price, change from open price, and close price for each underlying asset. The close prices show most indices and stocks decreased from their open prices, with changes ranging from -20.64% to 21.32%. Support and resistance levels are also provided.
The document is a summary of futures contract information for various stocks and indices as of August 4, 2011. It provides details such as the open interest, changes in open interest from the previous day, and price information like the opening price, support and resistance levels for each underlying asset. The information indicates overall decreases in open interest and prices across many stocks and indices from the previous day.
1) The document provides key data on futures and options contracts for various stocks and indices expiring on March 28, 2013. It includes data such as open interest, changes in open interest, support and resistance levels, and spot prices for various stocks and indices like Nifty, Bank Nifty, CNXIT and others.
2) Most stocks saw an increase in open interest compared to the previous day, with some seeing a decrease. Support and resistance levels are provided which can be used to identify potential price points.
3) Spot prices on March 11, 2013 closed generally higher than the previous day's close for many stocks, though some closed lower or unchanged.
The document is a market report that provides key data on the performance of various stocks and indices in the Indian market on February 7, 2013. It includes data such as the open interest, changes in open interest, closing prices, and support and resistance levels for various stocks and indices such as Nifty, Bank Nifty, CNXIT and several others. The report indicates modest changes in open interest and closing prices for most stocks, with some experiencing gains and others experiencing losses on the day.
The Report contains detailed information about the current level of stocks and the changes that took place throughout the day.In order to provide a better understanding it provides information about the Index future and Stock future.The report also contains information about the Future level of stocks and it acts as a guide and teacher for its readers so that they can properly plan out their stocks and investment.
The document provides information on futures contracts for various indices and stocks trading on Indian exchanges. It lists the open interest, changes in open interest from the previous day, and closing prices for each underlying asset. Key data points included are the expiry date of August 25th, 2021 for the contracts, open interest levels and changes for various indices like Nifty, Bank Nifty and stocks from various sectors like banking, FMCG, oil & gas, and more. Price levels for the day along with support and resistance levels are also listed.
1) The document provides a summary of key support and resistance levels, along with open interest data, for various stock and index futures contracts expiring on June 28, 2012.
2) It shows that open interest declined for many contracts over the past few days, with some seeing declines of over 40%.
3) The close prices of most contracts were relatively unchanged from the previous day, with some seeing small gains or losses of around 0.1%.
The document appears to be a market report listing information on future contracts for various indexes and stocks traded on Indian exchanges. It includes details such as the open interest, changes in open interest from the previous date, and support and resistance price levels for each underlying asset. The information is presented in a table format with the underlying asset name, lot size, exchange, and other data points about trading activity and price movements.
The document is a report on futures and options trading from October 10, 2012. It provides key support and resistance levels as well as changes in open interest and closing prices for various indices and stocks. Some highlights include the Nifty closing at 5675, down 0.85% with open interest up 7.06%. Bank Nifty closed at 11338.20, down 1.39% with open interest up 4.75%. Open interest on stocks such as ACC was up 7.45%, APOLLOTYRE up 2.41%, and BPCL up 2.99%. Stocks like HDIL saw open interest drop 6.96% while HAVELLS dropped 3.46%.
The document provides stock and index future levels for various Indian assets as of March 19, 2010. It includes information on the open interest, change in open interest from the previous day, percentage changes, support and resistance levels, and closing prices for each underlying asset. The assets covered include indexes like Nifty, Banknifty, stock futures across various sectors, and commodity futures.
The Report contains detailed information about the current level of stocks and the changes that took place throughout the day.In order to provide a better understanding it provides information about the Index future and Stock future.The report also contains information about the Future level of stocks and it acts as a guide and teacher for its readers so that they can properly plan out their stocks and investment.
The document is a market report that provides information on futures contracts for various indices and stocks trading on Indian exchanges, including changes in open interest and closing prices. Some key details:
- Date of report is August 25, 2011 focusing on expiry of contracts for that date
- Provides data on Nifty, Bank Nifty, Mini Nifty and other index futures, as well as over 100 individual stocks
- For each, it lists the lot size, changes in open interest, changes in closing prices, and support and resistance price levels
The document provides stock and index futures data from the Indian markets, including open interest, changes in open interest, support and resistance levels, and closing prices, as of February 29, 2012. Key indices like Nifty, Bank Nifty, and Mini Nifty are included, along with over 50 individual stocks spanning various sectors. The data suggests mixed performance across indices and stocks over the previous day, with some seeing increases in open interest and others seeing decreases.
The document provides a summary of future levels for various indices and stocks in India on March 22nd, 2010. It lists the open interest, change in open interest percentage, change in closing price percentage and closing price for each underlying as of that date. Key data points included are the lot size, support and resistance levels, and future ranges for Nifty, Bank Nifty, Mini Nifty and other indices as well as stocks across various sectors.
The document is a summary of futures and options data for various stocks and indices for an expiry date of February 23, 2012. It provides information such as the open interest, changes in open interest from a previous date, and support and resistance levels for each underlying asset. Overall, it shows the trading activity and price levels for a variety of Indian equities, indices, and commodities in the derivatives market on that date.
- The document is an analysis of key support and resistance levels for futures and options contracts expiring on September 29, 2011.
- It provides data on changes in open interest and closing prices for various indexes and stocks, as well as support and resistance levels.
- The data shows changes over the period from September 23, 2011 and gives analysts levels to watch as expiration approaches.
This document provides a summary of key support and resistance levels for various stocks and indices based on futures trading data as of November 23, 2012. It lists the underlying asset, lot size, open interest, changes in open interest from the previous date, and support and resistance price levels for each. Major indices like Nifty, Bank Nifty and key stocks across sectors like banking, auto, IT, metals, and FMCG are included.
Nifty Aug 5200 call added 4.30 lakh shares in OI, up 9.37% and 5300 call added5.54 lakh shares in OI, up 12.99%. On the put side nifty Aug 5100 put added 9.79 lakh shares in OI, up24.64% and 5000 put added 10.99 lakh in OI, up 16.30%. The put-call ratio of stock option decreases from 0.45 to 0.34 while put-call ratio of index option decreased from 1.24 to 1.19. On the whole the put call ratio was at 1.15.
The document appears to be a market report providing information on futures contracts for various indices and stocks traded on Indian exchanges. It includes data such as open interest, changes in open interest, and support and resistance price levels for each underlying asset.
The document provides a summary of key support and resistance levels for various Indian stock and index futures contracts expiring on April 26, 2012. It lists the underlying asset, lot size, open interest as of April 25, changes in open interest, and closing price levels for the previous day, along with support and resistance levels for each contract based on technical analysis. Over 20 stock and index futures contracts are summarized with relevant data points in a tabular format.
The document appears to be a report on future levels for various stocks and indices in the Indian market. It provides data on the open interest, changes in open interest, and closing prices for various stocks and indices as of December 15, 2010. It lists lot sizes, support and resistance levels, and provides percentage changes for the underlying assets. The report also notes an expiry date of December 30, 2010 and appears to be analyzing positions ahead of that expiry.
- The document provides data on changes in open interest and closing prices for various stock and index futures contracts expiring on August 25, 2011.
- It shows that for index futures, open interest increased the most for Nifty (12.16%) and Bank Nifty (0.70%) while decreasing for Mini Nifty (-15.22%).
- For stock futures, open interest increased the most for Canara Bank (24.98%) and Bajaj Auto (22.90%) while decreasing the most for Ashok Leyland (-15.40%) and Aban Offshore (-7.98%).
- Support and resistance levels are provided for the various contracts.
The document appears to be a market report that provides data on changes in open interest and closing prices for various stocks and indices for the futures market. It includes data such as the lot size, open interest as of February 9th, change in open interest, percentage change in open interest, change in closing price, support and resistance levels, and closing prices as of February 9th for various underlyings like Nifty, Banknifty, stocks etc. The report is dated February 10th and provides this data for planning or analysis purposes in the futures market.
The document is a market report listing future levels for various indices and stocks traded on Indian exchanges. It provides information such as the open interest, change in open interest from the previous day, percentage change in open and closing prices, and support and resistance levels for each underlying asset. The report indicates overall declines in most indices and stocks over the past day, with the Nifty down 1.29% and Banknifty down 1.48%. It lists detailed pricing data and analysis for over 100 individual stocks and indices trading in futures markets in India.
The document provides a summary of future levels for various indices and stocks in India. It includes information such as the underlying asset, lot size, open interest, change in open interest and price from the previous day, and support and resistance levels. Overall it summarizes the closing prices and trends of various stocks and indices trading in futures markets in India on September 23, 2010.
The document provides information on future levels for various indices and stocks on April 23rd, 2010, including the open interest, change in open interest from the previous day, percentage change in open interest and closing price, and support and resistance levels. The Nifty index saw an increase in open interest of 6.42% and closed 0.24% higher. Bank Nifty also saw an increase in open interest of 6.58% and closed 0.35% higher. Most other indices and many individual stocks saw increases in open interest and mixed changes in closing price compared to the previous day.
The Report contains detailed information about the current level of stocks and the changes that took place throughout the day.In order to provide a better understanding it provides information about the Index future and Stock future.The report also contains information about the Future level of stocks and it acts as a guide and teacher for its readers so that they can properly plan out their stocks and investment.
The document provides stock and index futures data including open interest, change in open interest, and closing prices from August 13, 2010. Over 50 stocks and indices are listed with details on lot size, opening price and interest, daily change percentages, and upper and lower price ranges. Most stocks saw changes in open interest between -10% to 10% and closing price changes between -1% to 3% from the previous day.
- The document provides information on future levels for various indices and stocks including the open interest, change in open interest, and closing price as of April 21, 2010.
- Key indices like Nifty were at 5241.10 points with an increase in open interest of 7.58% compared to the previous day. Other indices like Banknifty and Minifity also saw increases in open interest.
- Many stocks saw increases in open interest of over 10% such as ABAN, ABB, APOLLO TYRE, ASIAN PAINTS, AXIS BANK, and HCL TECH among others. Some stocks like ADANIENT saw over 20% increase.
The Report contains detailed information about the current level of stocks and the changes that took place throughout the day.In order to provide a better understanding it provides information about the Index future and Stock future.The report also contains information about the Future level of stocks and it acts as a guide and teacher for its readers so that they can properly plan out their stocks and investment.
- The document provides data on changes in open interest and closing prices for various stock futures contracts expiring on August 25, 2011.
- It shows that the open interest increased over 11% for Nifty futures but decreased over 7% for Mini Nifty futures as of August 9, 2011 compared to the previous day.
- The closing price of Nifty futures was 5095.60 with support at 4852 and resistance at 5195 according to the analysis.
The document is a market report that provides key data on futures and options contracts expiring on January 31, 2013 for various stocks and indices. It includes data such as open interest levels as of January 28, current price levels and support and resistance levels for each underlying contract. The report shows changes in open interest levels from the previous day and percentage changes in both open interest and closing prices.
1) The document provides stock futures data for various companies listed on Indian exchanges, including open interest, changes in open interest, and support and resistance levels, as of February 19, 2013.
2) Overall, open interest increased for many stocks compared to the previous day, such as Nifty (+6.08%) and Bank Nifty (+2.77%), while decreasing for some others such as ACC (-1.53%).
3) Support and resistance levels are provided to indicate price points where demand is expected to increase or decrease for each stock, to be used as price targets or entry/exit points by traders.
The document appears to be a summary of key support and resistance levels for various stocks and indices in the Indian market. It provides information such as the open interest, change in open interest, support and resistance price levels, and closing prices as of March 11, 2013 for stocks/indices including Nifty, Bank Nifty, CNXIT and various individual stocks across diverse sectors. The summary includes analysis for over 50 stocks/indices and their corresponding futures contracts trading on Indian exchanges.
The document provides a summary of futures and options data for various Indian stocks and indices for an expiry date of November 29, 2012. It includes details such as the open interest, changes in open interest from the previous day, and support and resistance levels for each underlying asset. Overall, the document analyzes the movement and activity in the Indian futures and options market for a selection of stocks and indices.
The document provides stock market data for various companies in India, including open interest levels, changes in open interest levels, and closing stock prices, as of February 12, 2013. Key data points included are for the Nifty, Bank Nifty, CNXIT indexes as well as over 50 individual stocks across various sectors. Support and resistance levels are also provided for each stock.
1) The document provides stock futures data including open interest, changes in open interest, and closing prices as of November 30, 2011 for various Indian stocks and indices.
2) Key data shown includes the underlying asset, lot size, open interest as of November 30th, change in open interest, change in closing price, support and resistance levels, and closing price as of November 30th.
3) Stocks and indices covered include the Nifty, Bank Nifty, CNXIT, stocks across various sectors such as banking, FMCG, autos, and support and resistance levels are provided to analyze price movement.
The document provides a summary of futures contracts for various indices and stocks trading on Indian exchanges as of November 22, 2011. It includes details such as the open interest, changes in open interest from the previous day, and closing prices. Some key points are that open interest decreased for many contracts such as Nifty, Bank Nifty, CNXIT and several individual stocks, while it increased for others such as Nifty, SBI, and Cipla. Closing prices increased for some contracts like Nifty, Cipla and decreased for others like Bank Nifty, Asian Paints.
- The document provides key data on futures contracts for various indices and stocks expiring on January 25, 2012.
- It includes information such as the open interest, change in open interest, change in price, support and resistance levels, and closing price for each underlying asset as of January 12, 2012.
- The assets span various indices like Nifty, Bank Nifty, and CNXIT as well as individual stocks from sectors like banking, auto, pharmaceuticals, infrastructure etc.
1) The document provides future levels for various indices and stocks for Friday, May 14th 2010, with expiry on May 27th 2010. It includes information such as the open interest, change in open interest from the previous day, and high, low and closing price levels.
2) Many stocks saw an increase in open interest compared to the previous day, with some major indices and stocks seeing gains of over 10% in open interest.
3) Closing prices on May 13th for most stocks fell within the provided support and resistance levels for the contracts, with some stocks rising or falling more than 1% from the previous close.
1. The document provides stock and index future levels for the NSE India market as of June 30, 2011.
2. It includes information such as the open interest, change in open interest, underlying price levels, and support and resistance levels for various stocks and indices.
3. The levels indicated are expiry levels for the June 2011 futures contracts.
1) The document provides stock futures data for various companies listed on Indian exchanges, including open interest, changes in open interest, and support and resistance levels, as of February 27, 2013.
2) Overall, most companies saw declines in open interest compared to the previous day, with some major declines of over 10% reported.
3) Support and resistance levels are provided to indicate price points that could trigger buying or selling activity.
The document provides quarterly financial results for PNB, UCO Bank, and City Union Bank. For PNB, revenue saw a marginal increase for the quarter ended September 2013 while profit declined 52.56%. UCO Bank reported a 5.92% rise in revenue and a remarkable 285.88% increase in net profit for the quarter. City Union Bank's revenue grew 20.48% while net profit growth was modest at 4.89% for the quarter.
The revenue and profits of India Cements declined in the quarter ended September 2013 compared to the same period last year. The net loss for the quarter was Rs. 225.30 million versus a net profit of Rs. 490.80 million last year. Operating profit also decreased from Rs. 2082.30 million to Rs. 1119.00 million.
In contrast, Tech Mahindra saw significant growth in the September 2013 quarter over the corresponding period last year. Total revenue increased 175.64% to Rs. 41562.40 million. Net profit rose sharply by 298.83% to Rs. 6386.40 million. Operating profit also grew from Rs. 2352.80 million to Rs. 8989
The revenue of Indraprastha Gas zoomed 18.11% for the quarter ended September 2013 compared to the same period last year. However, the Net Profit registered a slight decline of 6.51%. Glaxo Consumer Healthcare witnessed an 18.23% growth in revenue but Net Profit grew only 14.3% for the quarter. BHEL's sales declined 14.93% for the quarter while Net Profit fell sharply by 64.22% compared to the corresponding quarter of the previous year. Operating profit also decreased for BHEL.
This document provides key support and resistance levels for various stock indexes and individual stocks along with their open interest, change in open interest, and closing price information as of November 5, 2013. It lists Nifty, Bank Nifty, CNXIT, and various individual stock futures with their lot size, open interest, change in open interest, support levels 1 and 2 (S1 and S2), resistance levels 1 and 2 (R1 and R2), and closing price on November 5.
- Nifty futures closed at 6298.80 on Tuesday, at a premium of 45.65 points over the spot closing of 6253.15. Nifty December 2013 futures ended at a premium of 92.05 points over the spot closing.
- The put call ratio for Nifty options was 1.31, indicating higher open interest in put options. The put call ratio for Bank Nifty options was 0.97.
- For the upcoming session, the market seems bullish. However, 6317 and 6343 could act as crucial resistance levels, while 6210 and 6170 may serve as near-term support levels.
- The document provides key support and resistance levels for various stocks and indices based on their open interest as of October 30, 2013, the day before expiry. It notes the change in open interest and closing price for each underlying from the previous day. Support levels 1 and 2 (S1, S2) and resistance levels 1 and 2 (R1, R2) are given.
- Open interest increased for Nifty futures but decreased for Bank Nifty and CNXIT futures. Several individual stocks saw significant decreases in open interest, including Adani Power, Hindalco, HDIL, and JSW Steel, while open interest grew for IndusInd Bank, HDFC, and Kotak Bank.
-
The Nifty futures closed at 6,255, up 0.5% from the previous day's close. Trading volumes declined across most derivative products. Put call ratios for both Nifty and Bank Nifty options were above 1, indicating greater open interest for put options. The report provides closing prices and open interest figures for various stocks. It also outlines the most actively traded call and put options, and recommends a bearish options strategy for Nifty.
This document provides key support and resistance levels for futures contracts of various stocks trading on Indian exchanges, based on their open interest and closing price on October 29, 2013. It lists over 50 stocks, along with their lot size, open interest, change in open interest from the previous day, support and resistance levels, and closing price. The expiry date for the contracts is October 31, 2013.
The document is a daily derivative report that provides the following key information:
- Nifty futures closed at 6231.10, a premium of 10.20 points over the spot closing of 6220.90. Open interest on Nifty October futures contracted by 1.3 million units to 12.82 million units.
- Several stock futures like Tata Steel, Yes Bank, DLF, and ICICI Bank traded at discounts to their spot closing prices.
- Put call ratios for Nifty and Bank Nifty options were 1.66 and 1.27 respectively, indicating higher put open interest.
- Total futures and options turnover increased 94.24% compared to the previous day, with gains
This document provides key support and resistance levels for various stock futures contracts expiring on October 31, 2013. It lists underlying stocks, their lot size, open interest, change in open interest, percentage change in open interest and closing price from October 28, 2013. It also provides support levels S1 and S2 and resistance levels R1 and R2 for each stock future contract based on technical analysis.
This document provides key support and resistance levels for various stock indexes and futures as of October 25, 2013. It lists underlying assets, their lot size, open interest, changes in open interest, support and resistance levels, and closing prices from the previous day. The expiry date for the futures contracts is October 31, 2013. It contains this information for indexes like Nifty, Bank Nifty, CNXIT and over 50 stock futures.
The document is a daily derivatives report that provides key information on the NIFTY futures market. Some of the key details included in the summary are:
- NIFTY futures closed at 6,141, down 19.45 points (0.32%) from the previous day's close.
- Total futures and options volume declined 21.02% compared to the previous day.
- The put call ratio for Nifty and Bank Nifty options was 1.45 and 1.08 respectively, indicating higher put open interest.
- Most active stock futures like DLF, ITC, Yes Bank and Tata Steel were trading at premiums between 0.25-2.90 points compared to their spot prices
- Nifty futures closed at 6177.00 on Thursday, at a premium of 12.65 points over the spot closing of 6164.35. Nifty November 2013 futures ended at 6227.05, at a premium of 62.70 points over the spot closing.
- Trading volumes increased for index futures (10.78%), index options (10.21%) and decreased for stock futures (-6.60%) and stock options (-11.76%).
- Key support and resistance levels for Nifty are seen at 6105/6032 and 6235/6280 respectively.
This document provides a summary of futures trading data for various stocks and indices for the expiry date of 31st October 2013. It lists the underlying asset, lot size, open interest, change in open interest, support and resistance levels, and closing price from 23rd October 2013. Key details include an overall increase in open interest for Nifty futures of 6.54% and Bank Nifty futures of 4.06%, while open interest decreased for CNXIT futures by 7.9%. Support and resistance levels are provided to indicate possible price movement ranges.
Nifty futures closed lower at 6,178.35 points, down 0.39% from the previous day's close. Trading volumes increased across all derivative segments. Put call ratios for both Nifty and Bank Nifty options were above 1, indicating greater open interest in put options. Most active calls and puts were seen in the 6,100-6,300 strike price range for the October 31 expiry. The report provides an outlook for Nifty, noting key resistance and support levels. It also includes a sample options strategy for Nifty and a tracker of previous strategies.
Nifty futures closed lower at 6,178.35 points, down 0.39% from the previous day's close. Trading volumes increased across all derivative segments. Put call ratios for both Nifty and Bank Nifty options indicate a bearish sentiment. Most active calls and puts were seen in the 6,100-6,300 strike prices for the October 31 expiry. The report provides an outlook for Nifty, noting key resistance and support levels. It also includes the most and least active stocks by change in open interest. Strategies tracked show profits booked from positions in Nifty futures and options.
This document provides key support and resistance levels for various stock indexes and futures as of October 22, 2013. It lists underlying assets, their lot sizes, open interest levels and changes, and support and resistance price levels. The expiry date for futures contracts is October 31, 2013. Overall, open interest increased for many indexes and stocks compared to the previous day.
- The document provides key support and resistance levels for various stocks and indices in the futures and options market. It lists the underlying, lot size, open interest, change in open interest, closing price and support and resistance levels for each stock.
- The highest changes in open interest were seen in Federal Bank (44.72%), IDFC (10.08%), and Cairn India (10.99%) while the largest falls were in HDFCBank (-2.22%) and LIC Housing Finance (-1.49%).
- The expiry date for the futures and options contracts is 31st October 2013.
- The Nifty futures closed at 6236.00 on Monday, a premium of 31.05 points over the spot closing of 6,204.95.
- Put call ratios for Nifty and Bank Nifty options were 1.59 and 1.06 respectively, indicating higher put open interest.
- Total futures and options turnover decreased by 17.43% on Monday compared to the previous day, with index options seeing the largest fall of 19.52%.
More from Mansukh Investment & Trading Solutions (20)
6. Future Levels
make more, for sure.
NAME DESIGNATION E-MAIL
Varun Gupta Head - Research varungupta@moneysukh.com
Pashupati Nath Jha Research Analyst pashupatinathjha@moneysukh.com
Vikram Singh Research Analyst vikram_research@moneysukh.com
This report is for the personal information of the authorized recipient and does not construe to be any investment, legal or taxation advice to you.
Mansukh Securities and Finance Ltd (hereinafter referred as MSFL) is not soliciting any action based on it. This report is not for public distribution and
has been furnished to you solely for your information and should not be reproduced or redistributed to any person in any form.
The report is based upon information that we consider reliable, but we do not represent that it is accurate or complete. MSFL or any of its affiliates or
employees shall not be in any way responsible for any loss or damage that may arise to any person from any inadvertent error in the information
contained in this report. MSFL or any of its affiliates or employees do not provide, at any time, any express or implied warranty of any kind, regarding
any matter pertaining to this report, including without limitation the implied warranties of merchantability, fitness for a particular purpose, and non-
infringement. The recipients of this report should rely on their own investigations.
MSFL and/or its affiliates and/or employees may have interests/positions, financial or otherwise in the securities mentioned in this report. This
information is subject to change without any prior notice. MSFL reserves the right to make modifications and alterations to this statement as may be
required from time to time. Nevertheless, MSFL is committed to providing independent and transparent recommendations to its clients, and would be
happy to provide information in response to specific client queries.
Please refer to important disclosures at the end of this report For Private circulation Only For Our Clients Only
Mansukh Securities and Finance Ltd SEBI Regn No. BSE: INB010985834 / NSE: INB230781431
Office: 306, Pratap Bhavan, 5, Bahadur Shah Zafar Marg, New Delhi-110002 PMS Regn No. INP000002387
Phone: 011-30123450/1/3/5 Fax: 011-30117710 Email: research@moneysukh.com
Website: www.moneysukh.com