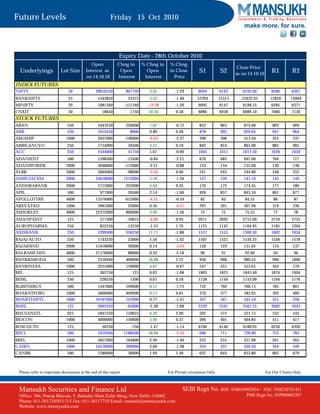
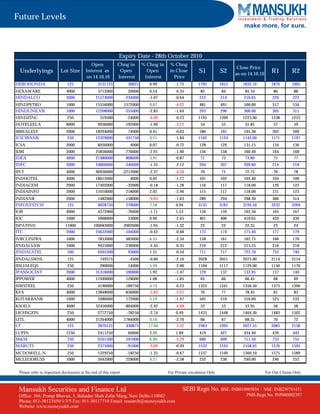
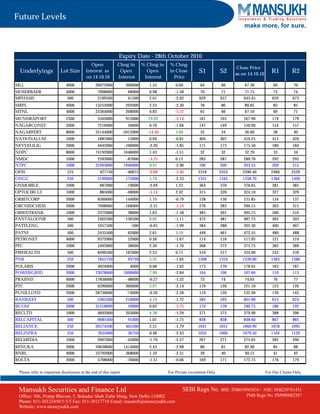
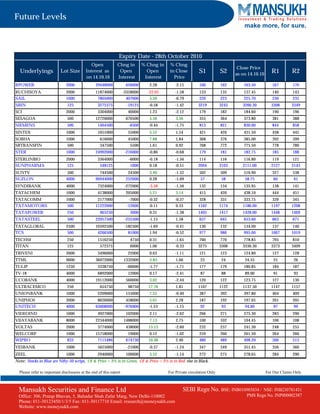
The document is a market report listing future levels for various indices and stocks traded on Indian exchanges. It provides information such as the open interest, change in open interest from the previous day, percentage change in open and closing prices, and support and resistance levels for each underlying asset. The report indicates overall declines in most indices and stocks over the past day, with the Nifty down 1.29% and Banknifty down 1.48%. It lists detailed pricing data and analysis for over 100 individual stocks and indices trading in futures markets in India.
The document provides a summary of key support and resistance levels for various stock and index futures contracts trading on Indian commodity exchanges. It lists the open interest, changes in open interest, and closing prices for contracts expiring on August 25, 2011. Support and resistance levels are also given to identify potential price points where demand or supply may come into play. The summary covers over 50 individual stocks and indices like Nifty, Bank Nifty, CNXIT, among others.
- The document provides information on future levels for various indices and stocks including the open interest, change in open interest, and closing price as of April 21, 2010.
- Key indices like Nifty were at 5241.10 points with an increase in open interest of 7.58% compared to the previous day. Other indices like Banknifty and Minifity also saw increases in open interest.
- Many stocks saw increases in open interest of over 10% such as ABAN, ABB, APOLLO TYRE, ASIAN PAINTS, AXIS BANK, and HCL TECH among others. Some stocks like ADANIENT saw over 20% increase.
1) The document provides future levels for various indices and stocks for the expiry date of 25th March 2010 based on data as of 17th March 2010. It includes information such as open interest, change in open interest, closing price and support and resistance levels for each stock/index.
2) Many stocks saw an increase in open interest ranging from 0.18% to 16.25%, while some saw a decrease as high as 27.36%. Closing prices for most were near the day's high or low compared to the opening price.
3) Support and resistance levels for the following trading session are provided to analyze where prices of different stocks are likely to find support or encounter resistance.
The document appears to be a market report listing information on future contracts for various indexes and stocks traded on Indian exchanges. It includes details such as the open interest, changes in open interest from the previous date, and support and resistance price levels for each underlying asset. The information is presented in a table format with the underlying asset name, lot size, exchange, and other data points about trading activity and price movements.
The document appears to be a listing of future levels for various indices and stocks on the Indian market. It provides information such as the open interest, change in open interest from the previous day, and price changes for various stocks and indices. The table suggests that the overall market was up on the day of September 15th, with the Nifty index rising 0.85% and Bank Nifty rising 0.45%, while some individual stocks showed both gains and losses.
The Report contains detailed information about the current level of stocks and the changes that took place throughout the day.In order to provide a better understanding it provides information about the Index future and Stock future.The report also contains information about the Future level of stocks and it acts as a guide and teacher for its readers so that they can properly plan out their stocks and investment.
The document provides stock and index futures information for various Indian companies and indices. It includes details like the open price, change in price from open, closing price ranges and the actual closing price as of 13.09.2010 for various stocks and indices. The information is presented in a tabular format with details like lot size, interest rates and price ranges for the day's trading.
The document provides a summary of future levels for various indices and stocks in India. It includes information such as the underlying asset, lot size, open interest, change in open interest and price from the previous day, and support and resistance levels. Overall it summarizes the closing prices and trends of various stocks and indices trading in futures markets in India on September 23, 2010.
The document appears to be a market report summarizing key support and resistance levels as well as changes in open interest and closing prices for various stock indexes and individual stocks in the Indian market as of October 12, 2012. It provides data such as the lot size, open interest as of that date, changes in open and closing interest levels, and support and resistance price points for indexes like Nifty, Bank Nifty and individual stocks across various sectors.
- The document is an analysis of futures and options data from January 5th, 2012 with an expiry date of January 25th, 2012.
- It provides information such as open interest, changes in open interest, changes in closing price for various stocks and indices.
- The stocks and indices include Nifty, Bank Nifty, CNXIT, 3IINFOTECH, ABAN, ABB, and many others across various sectors. Metrics like lot size, open interest, support and resistance levels are provided.
The document is a market report that provides key information on futures and options contracts for various indices and stocks, including:
- Open interest levels as of 09/05/2012 and the change from the previous day
- Changes in open interest levels and closing prices
- Support and resistance levels for the contracts
- Closing prices as of 09/05/2012
It summarizes data on futures contracts for various Indian indices and over 50 individual stocks across sectors.
The document provides a summary of futures and options data for various indices and stocks as of May 10, 2012. It includes details such as the open interest, changes in open interest from the previous day, closing price and resistance and support levels for different contracts that are set to expire on May 31, 2012. A total of over 80 stocks and indices are mentioned along with their corresponding futures contract details.
The document is a listing of future levels for various indices and stocks on the Indian market. It provides information such as the open interest, change in open interest from the previous day, and price levels for the near-term expiry of September 30th, 2010. Key data points listed include the lot size, open price, daily change percentages, support and resistance price levels, and close price as of September 17th, 2010 for dozens of stocks and indices trading in futures contracts on Indian exchanges.
The document appears to be a report on futures and options market data from October 25, 2012. It includes key details on various indices and stocks traded, including their open interest, changes in open interest from the previous day, and closing prices. For each listing, it provides support and resistance levels (S1, S2, R1, R2) as well as the previous day's close for reference. The report contains this information for various stock futures, index futures, and individual stocks.
The document provides a summary of future levels for various indices and stocks in India on March 22nd, 2010. It lists the open interest, change in open interest percentage, change in closing price percentage and closing price for each underlying as of that date. Key data points included are the lot size, support and resistance levels, and future ranges for Nifty, Bank Nifty, Mini Nifty and other indices as well as stocks across various sectors.
The Report contains detailed information about the current level of stocks and the changes that took place throughout the day.In order to provide a better understanding it provides information about the Index future and Stock future.The report also contains information about the Future level of stocks and it acts as a guide and teacher for its readers so that they can properly plan out their stocks and investment.
- The document is an analysis of key support and resistance levels for futures and options contracts expiring on September 29, 2011.
- It provides data on changes in open interest and closing prices for various indexes and stocks, as well as support and resistance levels.
- The data shows changes over the period from September 23, 2011 and gives analysts levels to watch as expiration approaches.
The document is a market report providing information on future levels for various indices and stocks in India, including changes in open interest, support and resistance levels, and previous day's closing prices. It summarizes data on Nifty, Bank Nifty, Mini Nifty and other indices, as well as over 100 individual stocks. For each, it lists the lot size, changes in open interest, support and resistance levels, and other key statistics from June 20th, 2011.
The document is a report on futures and options trading from October 10, 2012. It provides key support and resistance levels as well as changes in open interest and closing prices for various indices and stocks. Some highlights include the Nifty closing at 5675, down 0.85% with open interest up 7.06%. Bank Nifty closed at 11338.20, down 1.39% with open interest up 4.75%. Open interest on stocks such as ACC was up 7.45%, APOLLOTYRE up 2.41%, and BPCL up 2.99%. Stocks like HDIL saw open interest drop 6.96% while HAVELLS dropped 3.46%.
This document provides future levels for various indices and stocks for expiry on June 24, 2010. It includes information such as the open price, change from open price, and close price for each underlying asset. The close prices show most indices and stocks decreased from their open prices, with changes ranging from -20.64% to 21.32%. Support and resistance levels are also provided.
The document provides stock and index futures data for the Indian markets, including open interest, changes in open interest, and support and resistance levels, for the expiry date of April 26th, 2012. It lists information for various indices like Nifty, Bank Nifty, and CNXIT, as well as over 100 individual stocks. For each, it gives the lot size, open interest as of April 20th, changes in open interest, support levels S1 and S2, and resistance levels R1 and R2.
The document is a market report that provides key information on futures and options contracts for various stocks and indices in the Indian market. It includes details such as the current open interest, changes in open interest from the previous day, current price levels and resistance and support price points for each underlying asset. Some assets saw increases in open interest while others saw decreases. Price changes from the previous close were mostly positive but some stocks closed lower.
The document is a market report that provides key information on futures and options contracts expiring on May 31, 2012. It includes details such as the open interest, changes in open interest, and closing prices for various indices, stocks and their contracts. The report highlights that overall, open interest increased for many contracts such as Nifty, Banknifty and Minifity indices, while declining for some individual stocks such as ABB, Aban Offshore and Axis Bank. Closing prices declined across various indices and stocks compared to the previous day.
The document provides a summary of key support and resistance levels, as well as changes in open interest and closing prices, for various stock and index futures contracts expiring on November 24, 2011. It shows that open interest increased for many contracts such as Nifty, Banknifty, and Axis Bank, while decreasing for others such as Minifity and Alok Textiles. Closing prices changed modestly up or down for most contracts. Key support and resistance levels are given to watch for future price direction.
The document is a market report that provides key support and resistance levels as well as changes in open interest and closing prices for various stock and index futures contracts. It summarizes data for the expiry date of October 25, 2012. The report shows that overall, open interest increased for many stock futures but decreased for some index futures, while closing prices declined across various contracts. Key support and resistance levels are provided to analyze likely price movements.
- The document is a summary of future levels for various indexes and stocks on the Indian market as of March 10, 2010, including open interest, changes from the previous day, and closing prices.
- It provides this data for indexes like Nifty, Banknifty, and stocks across sectors like banking, energy, auto, pharmaceuticals, and more.
- Key statistics included are the expiry date of March 25, 2010, lot sizes for each underlying, open interest, changes in open interest and closing prices from the previous day, and support and resistance price levels.
The document appears to be a report on future levels for various stocks and indices in the Indian market. It provides data on the open interest, changes in open interest, and closing prices for various stocks and indices as of December 15, 2010. It lists lot sizes, support and resistance levels, and provides percentage changes for the underlying assets. The report also notes an expiry date of December 30, 2010 and appears to be analyzing positions ahead of that expiry.
The document provides information on futures contracts for various indices and stocks trading on Indian exchanges. It lists the open interest, changes in open interest from the previous day, and closing prices for each underlying asset. Key data points included are the expiry date of August 25th, 2021 for the contracts, open interest levels and changes for various indices like Nifty, Bank Nifty and stocks from various sectors like banking, FMCG, oil & gas, and more. Price levels for the day along with support and resistance levels are also listed.
The document appears to be a market report listing information on future contracts for various indexes and stocks traded on Indian exchanges. It includes data such as open interest, changes in open interest, and support and resistance price levels for each underlying asset. The report indicates most indexes and stocks closed slightly down on the day with a few exceptions, and provides analysis of price trends in the futures market.
The document is a market report that provides key information on futures and options contracts for various indices and stocks trading on Indian exchanges. It includes details such as the open interest, changes in open interest from the previous date, and support and resistance levels for different underlying assets. The report indicates that open interest increased for many stock futures contracts while declining for some index futures on October 1, 2012 compared to the previous day.
The document provides a summary of key support and resistance levels for various Indian stock and index futures contracts. It lists the underlying asset, lot size, open interest, changes in open interest from the previous day, and support and resistance price levels for each contract. The expiry date for all contracts is listed as October 25, 2012.
- The document provides key data on futures and options contracts expiring on September 29, 2011, including open interest, changes in open interest, and closing prices for various indices and stocks.
- Data is given for indexes like Nifty, Bank Nifty, and stocks from various sectors like banking, auto, pharmaceuticals, infrastructure etc.
- For each contract, details like lot size, open interest as of September 13, 2011, change in open interest, change in closing price and support and resistance levels are listed.
1) The document provides stock futures data including open interest, changes in open interest, and closing prices as of November 30, 2011 for various Indian stocks and indices.
2) Key data shown includes the underlying asset, lot size, open interest as of November 30th, change in open interest, change in closing price, support and resistance levels, and closing price as of November 30th.
3) Stocks and indices covered include the Nifty, Bank Nifty, CNXIT, stocks across various sectors such as banking, FMCG, autos, and support and resistance levels are provided to analyze price movement.
- The document is a summary of key support and resistance levels for various stock and index futures contracts trading on Indian exchanges, along with open interest data and price movements from December 16th, 2011.
- It provides information on over 50 individual stocks, indices and sectors, including Nifty, Bank Nifty, CNXIT, stocks across various industries like banking, auto, pharmaceuticals, energy and more.
- For each contract, it lists the lot size, open interest as of December 16th, changes in open interest, support and resistance price levels, and closing price on December 16th.
The document provides stock and index future levels for the Indian market. It includes information such as the underlying asset, lot size, open interest, change in open interest percentage, and support and resistance price levels for each asset. The close prices from September 8, 2010 are also listed. The information is presented in a table format for easy reference.
This document provides a summary of key stock futures data as of December 19, 2011 for the expiry date of December 29, 2011. It includes information such as the underlying stock, lot size, open interest as of December 19, changes in open interest, changes in closing price, support and resistance levels, and closing price for each stock future. A total of over 50 Indian stock futures are summarized.
- The document is a summary of key support and resistance levels for various stock futures contracts expiring on December 29, 2011.
- It provides information such as open interest, changes in open interest, support and resistance price levels, and closing prices for various stocks.
- Stocks mentioned include NIFTY, BANKNIFTY, MINIFTY, CNXIT and many others across sectors such as banking, pharmaceuticals, automobiles and more.
- The document is an analysis of futures and options data from January 5th, 2012 with an expiry date of January 25th, 2012.
- It provides information on the open interest, change in open interest, and change in closing price for various stock indexes and individual stocks.
- The data shows the current values as well as support and resistance levels for each underlying asset.
The document provides a summary of key information on futures contracts for various Indian stock market indices and stocks, including the underlying, lot size, open interest, changes in open interest, support and resistance levels, and closing prices as of March 15, 2012. It lists data for index futures contracts including Nifty, Banknifty, and CNXIT, as well as over 100 individual stock futures contracts. The information indicates overall decreases in open interest and closing prices across many contracts compared to the previous day.
The document provides stock and futures market data for various Indian companies as of October 31, 2012. It includes information such as the open interest, changes in open interest from the previous day, and support and resistance levels for different stocks. The data indicates modest changes in open interest and prices for most stocks, with some experiencing larger percentage gains or losses.
- The document is a summary of futures and options data for various stocks and indices as of January 16, 2012, with an expiry date of January 25, 2012.
- It provides information on the open interest, change in open interest, change in price, support and resistance levels, and closing price for each underlying asset.
- The underlying assets include stock futures, index futures, and individual stocks across various sectors such as banking, oil and gas, automobiles, pharmaceuticals, and textiles.
The document appears to be a market report listing information on futures contracts for various indices and stocks traded on Indian exchanges, including the open interest, changes in open interest, and support and resistance price levels. It provides data on Nifty, Bank Nifty, Mini Nifty, CNXIT index futures as well as over 100 individual stocks. For each contract, it lists the lot size, open interest, changes in open interest from the previous date as well as support, resistance and closing prices for that day.
This document provides a summary of key support and resistance levels for various stocks and indices in the futures and options market as of April 10, 2013. It shows the open interest, changes in open interest from the previous day, and closing prices for various stocks and indices like Nifty, Bank Nifty, CNXIT and individual stocks. The support and resistance levels are also provided to analyze the market trend and possible trading opportunities.
The document appears to be a market report listing various stock and index futures contracts traded on the National Stock Exchange of India. It provides data on the open interest, changes in open interest, and closing prices for various contracts expiring on October 28, 2010. The report includes futures contracts based on indices like Nifty, Bank Nifty and Minifity as well as individual stocks across various sectors.
The document is a market report that provides key information on futures and options contracts for various indices and stocks trading on Indian exchanges. It includes details such as the open interest, changes in open interest from the previous date, support and resistance levels, and previous day's closing prices for various contracts that will expire on September 29, 2011.
The document provides a summary of futures trading data for various indices and stocks for an expiry date of February 23, 2012. It includes information such as the open interest, changes in open interest, support and resistance levels, and closing prices for different contracts. Overall, the data shows mixed performance across indices and stocks with some seeing an increase in open interest while others saw a decrease.
Similar to Future trade insights for 15 Oct by Mansukh (20)
The document provides quarterly financial results for PNB, UCO Bank, and City Union Bank. For PNB, revenue saw a marginal increase for the quarter ended September 2013 while profit declined 52.56%. UCO Bank reported a 5.92% rise in revenue and a remarkable 285.88% increase in net profit for the quarter. City Union Bank's revenue grew 20.48% while net profit growth was modest at 4.89% for the quarter.
The revenue and profits of India Cements declined in the quarter ended September 2013 compared to the same period last year. The net loss for the quarter was Rs. 225.30 million versus a net profit of Rs. 490.80 million last year. Operating profit also decreased from Rs. 2082.30 million to Rs. 1119.00 million.
In contrast, Tech Mahindra saw significant growth in the September 2013 quarter over the corresponding period last year. Total revenue increased 175.64% to Rs. 41562.40 million. Net profit rose sharply by 298.83% to Rs. 6386.40 million. Operating profit also grew from Rs. 2352.80 million to Rs. 8989
The revenue of Indraprastha Gas zoomed 18.11% for the quarter ended September 2013 compared to the same period last year. However, the Net Profit registered a slight decline of 6.51%. Glaxo Consumer Healthcare witnessed an 18.23% growth in revenue but Net Profit grew only 14.3% for the quarter. BHEL's sales declined 14.93% for the quarter while Net Profit fell sharply by 64.22% compared to the corresponding quarter of the previous year. Operating profit also decreased for BHEL.
This document provides key support and resistance levels for various stock indexes and individual stocks along with their open interest, change in open interest, and closing price information as of November 5, 2013. It lists Nifty, Bank Nifty, CNXIT, and various individual stock futures with their lot size, open interest, change in open interest, support levels 1 and 2 (S1 and S2), resistance levels 1 and 2 (R1 and R2), and closing price on November 5.
- Nifty futures closed at 6298.80 on Tuesday, at a premium of 45.65 points over the spot closing of 6253.15. Nifty December 2013 futures ended at a premium of 92.05 points over the spot closing.
- The put call ratio for Nifty options was 1.31, indicating higher open interest in put options. The put call ratio for Bank Nifty options was 0.97.
- For the upcoming session, the market seems bullish. However, 6317 and 6343 could act as crucial resistance levels, while 6210 and 6170 may serve as near-term support levels.
- The document provides key support and resistance levels for various stocks and indices based on their open interest as of October 30, 2013, the day before expiry. It notes the change in open interest and closing price for each underlying from the previous day. Support levels 1 and 2 (S1, S2) and resistance levels 1 and 2 (R1, R2) are given.
- Open interest increased for Nifty futures but decreased for Bank Nifty and CNXIT futures. Several individual stocks saw significant decreases in open interest, including Adani Power, Hindalco, HDIL, and JSW Steel, while open interest grew for IndusInd Bank, HDFC, and Kotak Bank.
-
The Nifty futures closed at 6,255, up 0.5% from the previous day's close. Trading volumes declined across most derivative products. Put call ratios for both Nifty and Bank Nifty options were above 1, indicating greater open interest for put options. The report provides closing prices and open interest figures for various stocks. It also outlines the most actively traded call and put options, and recommends a bearish options strategy for Nifty.
This document provides key support and resistance levels for futures contracts of various stocks trading on Indian exchanges, based on their open interest and closing price on October 29, 2013. It lists over 50 stocks, along with their lot size, open interest, change in open interest from the previous day, support and resistance levels, and closing price. The expiry date for the contracts is October 31, 2013.
The document is a daily derivative report that provides the following key information:
- Nifty futures closed at 6231.10, a premium of 10.20 points over the spot closing of 6220.90. Open interest on Nifty October futures contracted by 1.3 million units to 12.82 million units.
- Several stock futures like Tata Steel, Yes Bank, DLF, and ICICI Bank traded at discounts to their spot closing prices.
- Put call ratios for Nifty and Bank Nifty options were 1.66 and 1.27 respectively, indicating higher put open interest.
- Total futures and options turnover increased 94.24% compared to the previous day, with gains
This document provides key support and resistance levels for various stock futures contracts expiring on October 31, 2013. It lists underlying stocks, their lot size, open interest, change in open interest, percentage change in open interest and closing price from October 28, 2013. It also provides support levels S1 and S2 and resistance levels R1 and R2 for each stock future contract based on technical analysis.
This document provides key support and resistance levels for various stock indexes and futures as of October 25, 2013. It lists underlying assets, their lot size, open interest, changes in open interest, support and resistance levels, and closing prices from the previous day. The expiry date for the futures contracts is October 31, 2013. It contains this information for indexes like Nifty, Bank Nifty, CNXIT and over 50 stock futures.
The document is a daily derivatives report that provides key information on the NIFTY futures market. Some of the key details included in the summary are:
- NIFTY futures closed at 6,141, down 19.45 points (0.32%) from the previous day's close.
- Total futures and options volume declined 21.02% compared to the previous day.
- The put call ratio for Nifty and Bank Nifty options was 1.45 and 1.08 respectively, indicating higher put open interest.
- Most active stock futures like DLF, ITC, Yes Bank and Tata Steel were trading at premiums between 0.25-2.90 points compared to their spot prices
- Nifty futures closed at 6177.00 on Thursday, at a premium of 12.65 points over the spot closing of 6164.35. Nifty November 2013 futures ended at 6227.05, at a premium of 62.70 points over the spot closing.
- Trading volumes increased for index futures (10.78%), index options (10.21%) and decreased for stock futures (-6.60%) and stock options (-11.76%).
- Key support and resistance levels for Nifty are seen at 6105/6032 and 6235/6280 respectively.
This document provides a summary of futures trading data for various stocks and indices for the expiry date of 31st October 2013. It lists the underlying asset, lot size, open interest, change in open interest, support and resistance levels, and closing price from 23rd October 2013. Key details include an overall increase in open interest for Nifty futures of 6.54% and Bank Nifty futures of 4.06%, while open interest decreased for CNXIT futures by 7.9%. Support and resistance levels are provided to indicate possible price movement ranges.
Nifty futures closed lower at 6,178.35 points, down 0.39% from the previous day's close. Trading volumes increased across all derivative segments. Put call ratios for both Nifty and Bank Nifty options were above 1, indicating greater open interest in put options. Most active calls and puts were seen in the 6,100-6,300 strike price range for the October 31 expiry. The report provides an outlook for Nifty, noting key resistance and support levels. It also includes a sample options strategy for Nifty and a tracker of previous strategies.
Nifty futures closed lower at 6,178.35 points, down 0.39% from the previous day's close. Trading volumes increased across all derivative segments. Put call ratios for both Nifty and Bank Nifty options indicate a bearish sentiment. Most active calls and puts were seen in the 6,100-6,300 strike prices for the October 31 expiry. The report provides an outlook for Nifty, noting key resistance and support levels. It also includes the most and least active stocks by change in open interest. Strategies tracked show profits booked from positions in Nifty futures and options.
This document provides key support and resistance levels for various stock indexes and futures as of October 22, 2013. It lists underlying assets, their lot sizes, open interest levels and changes, and support and resistance price levels. The expiry date for futures contracts is October 31, 2013. Overall, open interest increased for many indexes and stocks compared to the previous day.
- The document provides key support and resistance levels for various stocks and indices in the futures and options market. It lists the underlying, lot size, open interest, change in open interest, closing price and support and resistance levels for each stock.
- The highest changes in open interest were seen in Federal Bank (44.72%), IDFC (10.08%), and Cairn India (10.99%) while the largest falls were in HDFCBank (-2.22%) and LIC Housing Finance (-1.49%).
- The expiry date for the futures and options contracts is 31st October 2013.
- The Nifty futures closed at 6236.00 on Monday, a premium of 31.05 points over the spot closing of 6,204.95.
- Put call ratios for Nifty and Bank Nifty options were 1.59 and 1.06 respectively, indicating higher put open interest.
- Total futures and options turnover decreased by 17.43% on Monday compared to the previous day, with index options seeing the largest fall of 19.52%.
More from Mansukh Investment & Trading Solutions (20)
Discovering Delhi - India's Cultural Capital.pptxcosmo-soil
Delhi, the heartbeat of India, offers a rich blend of history, culture, and modernity. From iconic landmarks like the Red Fort to bustling commercial hubs and vibrant culinary scenes, Delhi's real estate landscape is dynamic and diverse. Discover the essence of India's capital, where tradition meets innovation.
In World Expo 2010 Shanghai – the most visited Expo in the World History
https://www.britannica.com/event/Expo-Shanghai-2010
China’s official organizer of the Expo, CCPIT (China Council for the Promotion of International Trade https://en.ccpit.org/) has chosen Dr. Alyce Su as the Cover Person with Cover Story, in the Expo’s official magazine distributed throughout the Expo, showcasing China’s New Generation of Leaders to the World.
5 Compelling Reasons to Invest in Cryptocurrency NowDaniel
In recent years, cryptocurrencies have emerged as more than just a niche fascination; they have become a transformative force in global finance and technology. Initially propelled by the enigmatic Bitcoin, cryptocurrencies have evolved into a diverse ecosystem of digital assets with the potential to reshape how we perceive and interact with money.
What Lessons Can New Investors Learn from Newman Leech’s Success?Newman Leech
Newman Leech's success in the real estate industry is based on key lessons and principles, offering practical advice for new investors and serving as a blueprint for building a successful career.
Calculation of compliance cost: Veterinary and sanitary control of aquatic bi...Alexander Belyaev
Calculation of compliance cost in the fishing industry of Russia after extended SCM model (Veterinary and sanitary control of aquatic biological resources (ABR) - Preparation of documents, passing expertise)
How to Invest in Cryptocurrency for Beginners: A Complete GuideDaniel
Cryptocurrency is digital money that operates independently of a central authority, utilizing cryptography for security. Unlike traditional currencies issued by governments (fiat currencies), cryptocurrencies are decentralized and typically operate on a technology called blockchain. Each cryptocurrency transaction is recorded on a public ledger, ensuring transparency and security.
Cryptocurrencies can be used for various purposes, including online purchases, investment opportunities, and as a means of transferring value globally without the need for intermediaries like banks.
Budgeting as a Control Tool in Government Accounting in Nigeria
Being a Paper Presented at the Nigerian Maritime Administration and Safety Agency (NIMASA) Budget Office Staff at Sojourner Hotel, GRA, Ikeja Lagos on Saturday 8th June, 2024.
6. Future Levels
make more, for sure.
NAME DESIGNATION E-MAIL
Varun Gupta Head - Research varungupta@moneysukh.com
Pashupati Nath Jha Research Analyst pashupatinathjha@moneysukh.com
Vikram Singh Research Analyst vikram_research@moneysukh.com
This report is for the personal information of the authorized recipient and does not construe to be any investment, legal or taxation advice to you.
Mansukh Securities and Finance Ltd (hereinafter referred as MSFL) is not soliciting any action based on it. This report is not for public distribution and
has been furnished to you solely for your information and should not be reproduced or redistributed to any person in any form.
The report is based upon information that we consider reliable, but we do not represent that it is accurate or complete. MSFL or any of its affiliates or
employees shall not be in any way responsible for any loss or damage that may arise to any person from any inadvertent error in the information
contained in this report. MSFL or any of its affiliates or employees do not provide, at any time, any express or implied warranty of any kind, regarding
any matter pertaining to this report, including without limitation the implied warranties of merchantability, fitness for a particular purpose, and non-
infringement. The recipients of this report should rely on their own investigations.
MSFL and/or its affiliates and/or employees may have interests/positions, financial or otherwise in the securities mentioned in this report. This
information is subject to change without any prior notice. MSFL reserves the right to make modifications and alterations to this statement as may be
required from time to time. Nevertheless, MSFL is committed to providing independent and transparent recommendations to its clients, and would be
happy to provide information in response to specific client queries.
Please refer to important disclosures at the end of this report For Private circulation Only For Our Clients Only
Mansukh Securities and Finance Ltd SEBI Regn No. BSE: INB010985834 / NSE: INB230781431
Office: 306, Pratap Bhavan, 5, Bahadur Shah Zafar Marg, New Delhi-110002 PMS Regn No. INP000002387
Phone: 011-30123450/1/3/5 Fax: 011-30117710 Email: research@moneysukh.com
Website: www.moneysukh.com