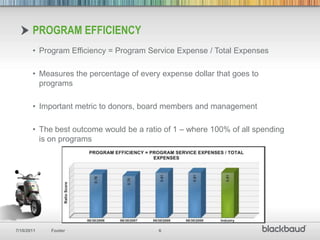
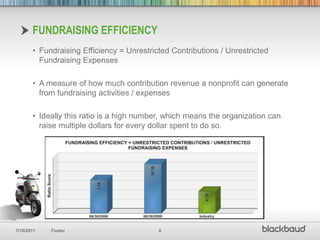
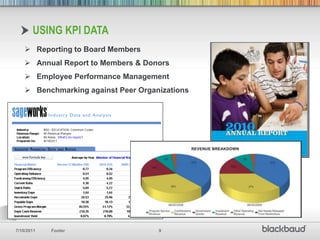
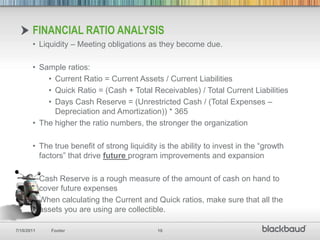
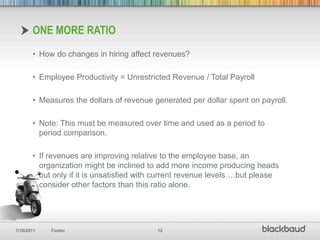
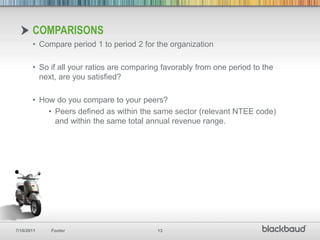
Designed for finance managers, CFOs, and accountants, this session will examine what key performance indicators nonprofits should look at to gauge their operational efficiency, stewardship of resources, and performance compared to peer organizations. The session will also include a discussion of the tools and data that are available to enhance this process and to improve accountability to donors and other stakeholders.
The Basic function of QuickBooks software Stuart Braud
Storing financial information safely over cloud is the first choice of every accountant. And we found that QuickBooks is the most valuable tool for any business. QuickBooks is a financial accounting software program manufactured by Intuit. There are a lot of features and functions of QB, some of them are known and some are unknown facts from others. Therefore, today in this presentation we are going to discuss some of the most important functions of QuickBooks.
OKRs: Objectives and Key Results, the basicsnikos batsios
A workshop on understanding the basics on using OKRs for your organisation. Ericsson's High Performing Team Environment (HTE) network Learnathon (learning marathon), February 2015.
Basic of Financial Accounting - Easy NotesFaHaD .H. NooR
These notes will provide you understanding basic of financial accounting
Financial accounting is a specialized branch of accounting that keeps track of a company's financial transactions. Using standardized guidelines, the transactions are recorded, summarized, and presented in a financial report or financial statement such as an income statement or a balance sheet.
Companies issue financial statements on a routine schedule. The statements are considered external because they are given to people outside of the company, with the primary recipients being owners/stockholders, as well as certain lenders. If a corporation's stock is publicly traded, however, its financial statements (and other financial reportings) tend to be widely circulated, and information will likely reach secondary recipients such as competitors, customers, employees, labor organizations, and investment analysts.
It's important to point out that the purpose of financial accounting is not to report the value of a company. Rather, its purpose is to provide enough information for others to assess the value of a company for themselves.If financial accounting is going to be useful, a company's reports need to be credible, easy to understand, and comparable to those of other companies. To this end, financial accounting follows a set of common rules known as accounting standards or generally accepted accounting principles (GAAP, pronounced "gap").
Here's a link to the full resolution PDF http://static.klipfolio.com/ebook/intro-to-kpis-slides.pdf
In today’s ultra competitive business ecosystem, only the strong survive. In order to keep your team on top of their game, you need to cultivate a data-driven culture by sharing the right performance indicators and business metrics with your team.
A Key Performance Indicator is a measurable value that demonstrates how effectively a company is achieving key business objectives. Organizations use KPIs at multiple levels to evaluate their success at reaching targets. High-level KPIs may focus on the overall performance of the enterprise, while low-level KPIs may focus on processes in departments such as sales, marketing or a call center.
I've worked to simplify the partner marketing process by building a roadmap of what that process looks like. I call it the ABCD Partner Marketing Process. This process ensures partnerships are aligned and effective in empowering sales and creating revenue for both partners.
Measuring Your Business’ KPIs: A WhitepaperResults
http://info.results.com/rethinking_kpis | Results.com offers a comprehensive whitepaper to help you measure your business’ key performance indicators (KPIs). By learning what metrics best represent business success, you can create goals for success.
A journey from a bad kpi to an excellent strategyAleksey Savkin
When I face a business challenge I'm trying to see the root of the problem. Having a quick-fix solution is fine, but what if a quick-fix solution is not possible unless fundamental issues are resolved. I see this often with KPIs. People ask to help with KPIs for this or for that, but the problem that they actually experience is a fundamental one - they have a vague strategy that is hard to follow.
Recently I had a conversation with Pablo, one of our Spain-based customers. His company is a leading national manufacturer and his question was about a KPI to help with the poor performance of their business. Our dialog was really insightful for both of us. Pablo sorted out things about strategy and KPIs; I was able to trace verbally the problem of a bad KPI back to its root - a poorly formulated strategy.
The result is not an article, but a dialog between me and Pablo. Together we completed a journey from a pointless KPI request to ideas about formulating a better strategy:
http://www.bscdesigner.com/a-journey-from-a-bad-kpi-to-an-excellent-strategy.htm
Nagios Conference 2014 - Jorge Higueros - Making KPIs Component Work For You ...Nagios
Jorge Higueros's presentation on Making KPIs Component Work For You With Nagios.
The presentation was given during the Nagios World Conference North America held Oct 13th - Oct 16th, 2014 in Saint Paul, MN. For more information on the conference (including photos and videos), visit: http://go.nagios.com/conference
South Florida HDI Malcolm Fry event Feb 29 2012Eddie Vidal
In everyday life, measurement is an essential component. How big? How far? How high? How heavy? What’s the time? What’s the cost? Quite simply, measurement is as old as time itself. So what is a good measurement and how can it impact performance when aiming to exceed targets?
Information Technology Service Management (ITSM) is focused on defining and managing processes to optimize performance. ITSM metrics provide a vast amount of data in the form of measurements. That data must be translated into information that can be used to monitor and manage the business. Learning how to leverage this information produces knowledge used to produce service improvements and sustained performance. In this course, we will take an in-depth look at the ITIL 2011 Edition metrics for incident, problem, change, and service desk management.
This workshop, presented by the renowned Malcolm Fry, is a fun, informative, and productive learning experience about metrics based on ITIL 2011. The workshop contains a series of breakout opportunities that allow for networking and collaborative learning. Course participants will receive and learn how to use a spreadsheet enabling them to report on metrics for the service desk.
Financial ratios and their use in understanding Financial StatementsPranav Dedhia
An introduction and in-depth understanding on the importance of Financial ratios in understanding financial statements of business entities along with relevant examples
When it comes to measuring the success of your nonprofit, identifying the right key performance indicators (KPIs) is everything.
Learn the top 20 KPIs for Nonprofits.
Mel feller looks at creating a more profitable businessMel Feller
Mel Feller Looks at Creating a More Profitable Business
Making a profit is the most important - some might say the only - objective of a business. Profit measures success. It can be defined simply: Revenues - Expenses = Profit. Therefore, to increase profits you must raise revenues, lower expenses, or both. To make improvements you must know what is really going on financially at all times. You have to watch every financial event without any kind of optimistic filter.
This article is a series of questions with comments to help you analyze your profits, their sufficiency and trend, the contribution of each of your product lines or services to them, and to help you determine if you have the kind of record system you need. The questions and comments are not meant to be definitive presentations on the subjects.
Pace 2009 Effective Financial ManagementLinnea Blair
Presented at PACE 2009 Convention by Linnea Blair, Advisors On Target. Some information in this presentation is sourced from RAN ONE, Inc. Advisors On Target is a RAN ONE Business Advisor.
3 Evaluation methods for working with financial statements.The f.docxtamicawaysmith
3 Evaluation methods for working with financial statements.
The first is RATIO ANALYSIS.
This helps you evaluate the financial performance of a company.
Chapter 3+4 are combined. You try to answer one main question: How ratio analysis is used to evaluate the financial performance of a company.
In order to do ratio analysis you need data, and the data comes from financial statements. The two main statements that we used to calculate the ratio: balance sheet and income statement. 3 & 4 chapters are accounting review. He imported info that reminds us of those two statements. All we need to study is this power point.
Review of balance sheet:
How finance people read balance sheet is a bit different because it fits our needs.
Balance sheet is two sides. One side is called assets and other side is called liabilities and equity.
The assets side is everything the company owns.
The liability side is everything the company owes others.
Other definition could be, the assets could be considered the companies investment.
If asset is the companies the investments then liabilities is where we get the money from to fund the investments.
Capital budgeting team from finance determines if they can afford the projects and liabilities they can afford before accounting department gets its it.
Assets should always equal the liabilities.
Bonds are long term debt. Total debt equals depts. Plus equity. Short-term debt is current liabilities and long term debt is bonds. Short term is like A.P., s-t notes payable, current liabilities.
Total assets tell you the value of the company.
The value=D + E.
Income statements = revenues-expenses=net income or net loss.
They show whether the company makes profit or losses, revenues and expenses.
The very important number is net income. Whether it is positive or negative.
If it positive then perfect, everyone is happy…to a certain extent.
As soon as you have profit, you have to deduct taxes (corporate taxes)
The rest is divided between dividends and retained earnings, depends how much is distributed where. Depends on many factors. They usually start by putting a lot in retained earning and use it as an internal source of finance, the management will do anything they can do in order to maximize RE.
The ratio we use to calculate the RE from Net Income is called the
RETENTION RATIO= THE RATIO THAT WE USE TO CALCULATE RETAINED EARNING FROM NET INCOME.
The name of the ratio that goes to dividends from net income is called dividend payout ratio.
Revenues maybe up to 90% of them comes from SALES. The other 10% come from like investments from shares you receive dividends, you receive INTERESTS from BONDS.
Expenses, since most of the money comes from sales then the most of the expenses come from COGS. The rest is salaries, maintenance etc.
Sales-COGS=Gross profit-rest=net incomes-taxes=real net income that goes two ways.
Earning per share=EPS =Total net incomes/shares outstanding. Means like $162/100= $1.62 means eve ...
Lecture 12816 and 20216 for chapters 3+43 Evaluation m.docxsmile790243
Lecture 1/28/16 and 2/02/16 for chapters 3+4
3 Evaluation methods for working with financial statements.
The first is RATIO ANALYSIS.
This helps you evaluate the financial performance of a company.
Chapter 3+4 are combined. You try to answer one main question: How ratio
analysis is used to evaluate the financial performance of a company.
In order to do ratio analysis you need data, and the data comes from financial
statements. The two main statements that we used to calculate the ratio: balance
sheet and income statement. 3 & 4 chapters are accounting review. He imported info
that reminds us of those two statements. All we need to study is this power point.
Review of balance sheet:
How finance people read balance sheet is a bit different because it fits our needs.
Balance sheet is two sides. One side is called assets and other side is called liabilities
and equity.
The assets side is everything the company owns.
The liability side is everything the company owes others.
Other definition could be, the assets could be considered the companies investment.
If asset is the companies the investments then liabilities is where we get the money
from to fund the investments.
Capital budgeting team from finance determines if they can afford the projects and
liabilities they can afford before accounting department gets its it.
Assets should always equal the liabilities.
Bonds are long term debt. Total debt equals depts. Plus equity. Short‐term debt is
current liabilities and long term debt is bonds. Short term is like A.P., s‐t notes
payable, current liabilities.
Total assets tell you the value of the company.
The value=D + E.
Income statements = revenues‐expenses=net income or net loss.
They show whether the company makes profit or losses, revenues and expenses.
The very important number is net income. Whether it is positive or negative.
If it positive then perfect, everyone is happy…to a certain extent.
As soon as you have profit, you have to deduct taxes (corporate taxes)
The rest is divided between dividends and retained earnings, depends how much is
distributed where. Depends on many factors. They usually start by putting a lot in
retained earning and use it as an internal source of finance, the management will do
anything they can do in order to maximize RE.
The ratio we use to calculate the RE from Net Income is called the
RETENTION RATIO= THE RATIO THAT WE USE TO CALCULATE RETAINED
EARNING FROM NET INCOME.
The name of the ratio that goes to dividends from net income is called dividend
payout ratio.
Revenues maybe up to 90% of them comes from SALES. The other 10% come from
like investments from shares you receive dividends, you receive INTERESTS from
BONDS.
Expenses, since most of the money comes from sales then the most of the expenses
come from COGS. The rest is salaries, maintenance etc.
Sales‐COGS=Gross profit‐rest=net incomes‐taxes=real net income that goes two
ways.
Earning per share=EPS =Total ne ...
Philanthropy by the Numbers: The story behind the statsBlackbaud
In our latest edition of npEXPERTS, top thought leaders from across the industry share their perspective on the latest trends and what's next for the social good industry.
Encryption in Microsoft 365 - ExpertsLive Netherlands 2024Albert Hoitingh
In this session I delve into the encryption technology used in Microsoft 365 and Microsoft Purview. Including the concepts of Customer Key and Double Key Encryption.
Essentials of Automations: Optimizing FME Workflows with ParametersSafe Software
Are you looking to streamline your workflows and boost your projects’ efficiency? Do you find yourself searching for ways to add flexibility and control over your FME workflows? If so, you’re in the right place.
Join us for an insightful dive into the world of FME parameters, a critical element in optimizing workflow efficiency. This webinar marks the beginning of our three-part “Essentials of Automation” series. This first webinar is designed to equip you with the knowledge and skills to utilize parameters effectively: enhancing the flexibility, maintainability, and user control of your FME projects.
Here’s what you’ll gain:
- Essentials of FME Parameters: Understand the pivotal role of parameters, including Reader/Writer, Transformer, User, and FME Flow categories. Discover how they are the key to unlocking automation and optimization within your workflows.
- Practical Applications in FME Form: Delve into key user parameter types including choice, connections, and file URLs. Allow users to control how a workflow runs, making your workflows more reusable. Learn to import values and deliver the best user experience for your workflows while enhancing accuracy.
- Optimization Strategies in FME Flow: Explore the creation and strategic deployment of parameters in FME Flow, including the use of deployment and geometry parameters, to maximize workflow efficiency.
- Pro Tips for Success: Gain insights on parameterizing connections and leveraging new features like Conditional Visibility for clarity and simplicity.
We’ll wrap up with a glimpse into future webinars, followed by a Q&A session to address your specific questions surrounding this topic.
Don’t miss this opportunity to elevate your FME expertise and drive your projects to new heights of efficiency.
The Art of the Pitch: WordPress Relationships and SalesLaura Byrne
Clients don’t know what they don’t know. What web solutions are right for them? How does WordPress come into the picture? How do you make sure you understand scope and timeline? What do you do if sometime changes?
All these questions and more will be explored as we talk about matching clients’ needs with what your agency offers without pulling teeth or pulling your hair out. Practical tips, and strategies for successful relationship building that leads to closing the deal.
Elevating Tactical DDD Patterns Through Object CalisthenicsDorra BARTAGUIZ
After immersing yourself in the blue book and its red counterpart, attending DDD-focused conferences, and applying tactical patterns, you're left with a crucial question: How do I ensure my design is effective? Tactical patterns within Domain-Driven Design (DDD) serve as guiding principles for creating clear and manageable domain models. However, achieving success with these patterns requires additional guidance. Interestingly, we've observed that a set of constraints initially designed for training purposes remarkably aligns with effective pattern implementation, offering a more ‘mechanical’ approach. Let's explore together how Object Calisthenics can elevate the design of your tactical DDD patterns, offering concrete help for those venturing into DDD for the first time!
UiPath Test Automation using UiPath Test Suite series, part 3DianaGray10
Welcome to UiPath Test Automation using UiPath Test Suite series part 3. In this session, we will cover desktop automation along with UI automation.
Topics covered:
UI automation Introduction,
UI automation Sample
Desktop automation flow
Pradeep Chinnala, Senior Consultant Automation Developer @WonderBotz and UiPath MVP
Deepak Rai, Automation Practice Lead, Boundaryless Group and UiPath MVP
Software Delivery At the Speed of AI: Inflectra Invests In AI-Powered QualityInflectra
In this insightful webinar, Inflectra explores how artificial intelligence (AI) is transforming software development and testing. Discover how AI-powered tools are revolutionizing every stage of the software development lifecycle (SDLC), from design and prototyping to testing, deployment, and monitoring.
Learn about:
• The Future of Testing: How AI is shifting testing towards verification, analysis, and higher-level skills, while reducing repetitive tasks.
• Test Automation: How AI-powered test case generation, optimization, and self-healing tests are making testing more efficient and effective.
• Visual Testing: Explore the emerging capabilities of AI in visual testing and how it's set to revolutionize UI verification.
• Inflectra's AI Solutions: See demonstrations of Inflectra's cutting-edge AI tools like the ChatGPT plugin and Azure Open AI platform, designed to streamline your testing process.
Whether you're a developer, tester, or QA professional, this webinar will give you valuable insights into how AI is shaping the future of software delivery.
Accelerate your Kubernetes clusters with Varnish CachingThijs Feryn
A presentation about the usage and availability of Varnish on Kubernetes. This talk explores the capabilities of Varnish caching and shows how to use the Varnish Helm chart to deploy it to Kubernetes.
This presentation was delivered at K8SUG Singapore. See https://feryn.eu/presentations/accelerate-your-kubernetes-clusters-with-varnish-caching-k8sug-singapore-28-2024 for more details.
Securing your Kubernetes cluster_ a step-by-step guide to success !KatiaHIMEUR1
Today, after several years of existence, an extremely active community and an ultra-dynamic ecosystem, Kubernetes has established itself as the de facto standard in container orchestration. Thanks to a wide range of managed services, it has never been so easy to set up a ready-to-use Kubernetes cluster.
However, this ease of use means that the subject of security in Kubernetes is often left for later, or even neglected. This exposes companies to significant risks.
In this talk, I'll show you step-by-step how to secure your Kubernetes cluster for greater peace of mind and reliability.
Neuro-symbolic is not enough, we need neuro-*semantic*Frank van Harmelen
Neuro-symbolic (NeSy) AI is on the rise. However, simply machine learning on just any symbolic structure is not sufficient to really harvest the gains of NeSy. These will only be gained when the symbolic structures have an actual semantics. I give an operational definition of semantics as “predictable inference”.
All of this illustrated with link prediction over knowledge graphs, but the argument is general.
Generating a custom Ruby SDK for your web service or Rails API using Smithyg2nightmarescribd
Have you ever wanted a Ruby client API to communicate with your web service? Smithy is a protocol-agnostic language for defining services and SDKs. Smithy Ruby is an implementation of Smithy that generates a Ruby SDK using a Smithy model. In this talk, we will explore Smithy and Smithy Ruby to learn how to generate custom feature-rich SDKs that can communicate with any web service, such as a Rails JSON API.
Connector Corner: Automate dynamic content and events by pushing a buttonDianaGray10
Here is something new! In our next Connector Corner webinar, we will demonstrate how you can use a single workflow to:
Create a campaign using Mailchimp with merge tags/fields
Send an interactive Slack channel message (using buttons)
Have the message received by managers and peers along with a test email for review
But there’s more:
In a second workflow supporting the same use case, you’ll see:
Your campaign sent to target colleagues for approval
If the “Approve” button is clicked, a Jira/Zendesk ticket is created for the marketing design team
But—if the “Reject” button is pushed, colleagues will be alerted via Slack message
Join us to learn more about this new, human-in-the-loop capability, brought to you by Integration Service connectors.
And...
Speakers:
Akshay Agnihotri, Product Manager
Charlie Greenberg, Host
2. What are KPI’s? Key Performance Indicators, or KPI’s, are quantifiable measures of an organization’s performance, activities, or success. Used to measure progress towards goals Translate an organization’s mission into clear, measurable outcomes
3. Why are they important to nonprofits? Transparency to internal and external audiences Accountability to Donors/Funders Proof of Delivery on Mission
4. Financial KPI’s – The basics While KPI’s can be organization or even campaign specific, basic financial KPI’s are relevant to most nonprofits. Some examples: Average Donor Contribution Cost per dollar raised Program Efficiency Liquidity Fundraising Efficiency Operating Reliance Employee Productivity
5. 3 Important Ratios Three key ratios that are of interest to nonprofit stakeholders Program efficiency ratio – How much of every expense dollar goes to programs? Operating reliance ratio – How much of your total expenses are covered by program services revenue? Fundraising efficiency ratio – What multiple is your contribution revenue of your fundraising expenses?
6. Program Efficiency Program Efficiency = Program Service Expense / Total Expenses Measures the percentage of every expense dollar that goes to programs Important metric to donors, board members and management The best outcome would be a ratio of 1 – where 100% of all spending is on programs
7.
8. A measure of your organization’s ability to cover total expenses from program services alone
9. Very important if program services revenue are deemed most consistent and predictable
10.
11. A measure of how much contribution revenue a nonprofit can generate from fundraising activities / expenses
38. Habitat for Humanity NTEE Code L20 – Housing Development, Construction and Management Revenue Band: $1MM-$10MM Revenue Composition Example Organization
39. Program Efficiency What expenses are allocated to programs? - Resale store expense? Ratio Score
41. Fundraising Efficiency Depends on what is included in your contribution revenue number as well as your fundraising expense number
42. Our sample org is on par with its peers for program efficiency, below its peers for operating reliance and above its peers for fundraising efficiency What questions might you ask about this particular organization based on its 3 key ratios? My thoughts: What percentage of their contributions are gifts in kind? Do they have a ReStore operation? Where are those $? Contributions or Programs? How are donations of building materials treated? Are mortgage payments considered program services revenues? Considerations and Questions
43. Ratios are best used as conversation starters There are specific aspects to your business model that may make a particular ratio look “good” or “bad” – but the reality is the opposite Be clear what numbers you have included in the numerator and denominator and why Ratios need comparisons to make them relevant – a solitary number is not useful Period to period comparisons Peer comparisons Financial Ratios can give you a quick picture of your organization’s overall strength In Summary
Editor's Notes
Section header
Let’s take a look at how our sample organization compares to its peers….
Section header
High level business model – raise money and supplies to build and sell houses to those who could not otherwise afford them.