Download to read offline
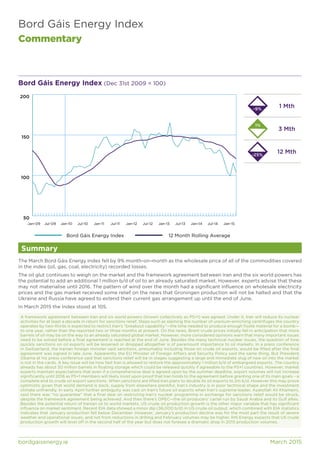
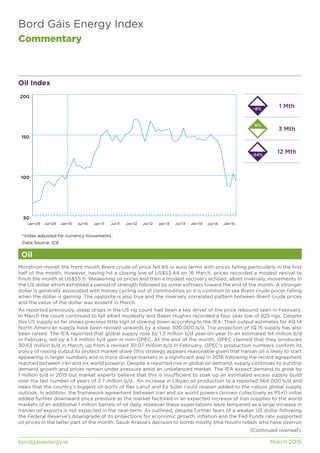
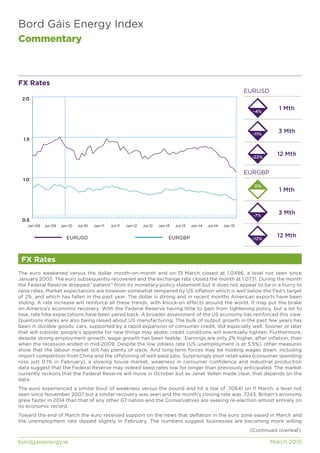

1) The Bord Gáis Energy Index fell 9% in March as wholesale prices of oil, gas, coal, and electricity all recorded losses. A framework agreement between Iran and world powers added downward pressure on oil prices by potentially adding 1 million barrels per day of Iranian oil to global markets, though experts say this increase may not occur until 2016. 2) Natural gas prices in the UK fell as strong liquefied natural gas imports increased supplies. Coal prices also weakened due to high stock levels in Europe and declining demand from China. 3) Irish wholesale electricity prices fell due to lower gas and coal prices, but prices were also influenced by the intermittent pattern of wind power, which at times led to price


